
Quantitative trading uses math, statistics, and algorithms to analyze data and automate trading decisions. Unlike traditional trading, it avoids emotional biases and operates on predefined rules. This method processes vast datasets, identifies patterns, and executes trades, often dominating markets (e.g., 70% of U.S. equity trading volume). However, it requires careful strategy design, risk management, and continuous refinement as markets evolve.
Key Takeaways:
- What It Is: Data-driven trading using algorithms and statistical models.
- Why It Matters: Removes emotions, processes large datasets, and improves consistency.
- Common Myths: You don’t need a PhD, it’s not risk-free, and coding is a tool - not the focus.
- How It Works: Steps include hypothesis creation, data collection, backtesting, and automated execution.
- Strategies: Trend following, mean reversion, statistical arbitrage, and sentiment analysis.
- Tools: Python, broker APIs, and VPS for continuous, low-latency trading.
### How to Create a Trading Algorithm:
- Learn financial markets and trading basics.
- Develop programming skills (Python is ideal).
- Backtest strategies to ensure reliability.
- Transition to live trading with VPS hosting for stability.
Quantitative trading offers disciplined, data-driven methods but requires ongoing research and robust infrastructure to succeed.
How Quantitative Trading Works
Quantitative Trading Process: From Hypothesis to Live Execution
Understanding the structured process - from forming a hypothesis to executing trades - is key to applying quant trading strategies effectively.
The Quantitative Trading Process, Step by Step
Quantitative trading follows a well-defined workflow. Skipping any step can lead to poor results.
It all starts with a hypothesis about a market inefficiency. For example: "Stocks that outperform the S&P 500 over the past 12 months tend to continue outperforming over the next 3 months." This idea is then converted into a clear mathematical rule. From there, the process moves through stages like data collection, signal generation, backtesting, and live execution.
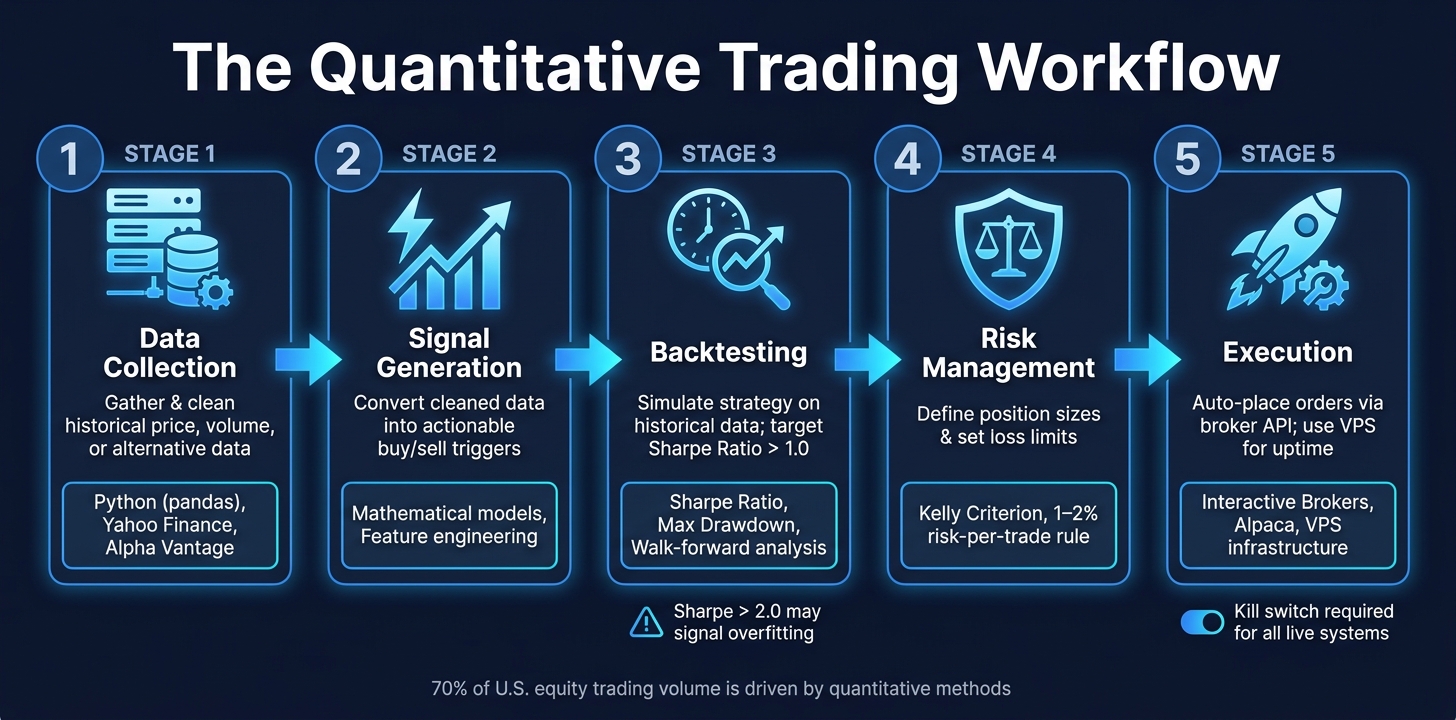
Here’s a breakdown of each stage, the actions involved, and the tools typically used:
| Stage | What Happens | Key Tools |
|---|---|---|
| Data Collection | Gathering and cleaning historical price, volume, or alternative data | Python (pandas), Yahoo Finance, Alpha Vantage |
| Signal Generation | Turning cleaned data into actionable buy/sell triggers | Mathematical models, feature engineering |
| Backtesting | Simulating the strategy using historical data | Sharpe Ratio, Max Drawdown, walk-forward analysis |
| Risk Management | Defining position sizes and setting loss limits | Kelly Criterion, 1–2% risk-per-trade rule |
| Execution | Automatically placing orders through a broker API | Interactive Brokers, Alpaca, VPS infrastructure |
Backtesting is a critical step. A Sharpe ratio over 1.0 is generally acceptable, but anything above 2.0 might signal overfitting. To avoid this, traders often use walk-forward validation, where parameters are optimized on one dataset segment and tested on another unseen segment without tweaking.
"A backtest is a simulation of how a trading strategy would have performed on historical data. It is not evidence that the strategy will perform in the future." - Om Arora
Data Sources: Market Data and Alternative Data
The success of any quant strategy depends heavily on the quality of the data used. Most traders begin with OHLCV data (Open, High, Low, Close, Volume), which is the foundation for many strategies like trend-following or breakout methods. More advanced strategies often incorporate other data types to uncover less obvious opportunities.
| Data Type | Description | Typical Use Case |
|---|---|---|
| OHLCV | Open, High, Low, Close, Volume per bar | Trend following and breakout strategies |
| Tick Data | Every individual trade or quote update | Scalping and market microstructure studies |
| Alternative Data | Social sentiment, news flow, satellite imagery | Identifying unique market catalysts or trends |
| Fundamental Data | Earnings, revenue, balance sheets | Long-term filters and stock selection |
Raw data often requires extensive cleaning to address missing timestamps, outliers, and corporate actions like stock splits or dividends. It’s also crucial to account for survivorship bias, which can skew results by excluding delisted or bankrupt companies, making strategies appear more successful than they actually are.
How Automation and Algorithms Execute Trades
Once a strategy is validated, automated execution takes over, connecting the system to a broker API like Interactive Brokers, Alpaca, or Binance. This setup allows trades to be executed automatically, with the system monitoring market conditions in real time and placing orders without manual intervention.
Run 24/7 while you sleep. Keep bots, platforms, and trade copiers online on a dedicated VPS.
Low-latency VPS hosting for your trading platform.
From $59.99/mo
For larger orders, execution algorithms help reduce market impact. For instance, TWAP (Time-Weighted Average Price) spreads an order evenly over a set time, while VWAP (Volume-Weighted Average Price) distributes it based on historical trading volume. These methods help minimize slippage - the gap between the expected price and the actual execution price. For U.S. equities, backtests typically factor in slippage costs of $0.005–$0.01 per share.
Reliable infrastructure is non-negotiable for live trading. Most traders rely on VPS solutions to ensure continuous uptime, avoiding risks like power outages or internet disruptions. For strategies that operate on daily or swing trading intervals, cloud-based VPS setups work well. High-frequency trading, however, demands co-location - placing servers directly inside the exchange’s data center to reduce latency to mere microseconds. Additionally, every automated system should include a kill switch, a feature that can immediately close all positions and cancel pending orders if something goes wrong.
Key Quantitative Trading Strategies
Quantitative trading strategies tap into specific market behaviors, each with its own assumptions and ideal conditions. While the approaches vary, most quant strategies fall into a few main categories, each designed to exploit different market dynamics.
Trend Following and Momentum Strategies
Trend following is one of the simplest and oldest quant strategies. The idea? If a market is heading in one direction, it’s likely to keep going. Traders often rely on tools like moving average crossovers - for instance, when a 20-day moving average crosses above a 50-day one - as signals to enter a trade.
These strategies typically have win rates between 40–50%. While they experience frequent small losses, the occasional big wins more than make up for it. The key to success is sticking to the plan, no matter how tempting it is to deviate.
"The algorithm does not feel fear during a losing streak or greed during a winning streak." - Quantum-Algo
But there’s a catch: sideways markets are a trend follower’s worst enemy. In these conditions, prices move back and forth without a clear direction, leading to a string of small, frustrating losses.
Mean Reversion and Statistical Arbitrage
Mean reversion strategies operate on a different assumption: when prices stray too far from their historical averages, they’ll eventually snap back. Indicators like Bollinger Bands, RSI, and Z-scores help identify when an asset is "overbought" or "oversold" and ready to reverse.
These strategies often boast win rates of 60–70%, making them ideal for range-bound markets. However, they struggle when markets trend strongly in one direction. Like all quant strategies, their success depends on rigorous data analysis.
Statistical arbitrage, or stat arb, takes mean reversion a step further. Instead of focusing on a single asset, it trades a portfolio of related assets - like two stocks with a strong correlation. The aim is to profit from temporary price differences between these assets while staying neutral to broader market movements.
| Feature | Trend Following | Mean Reversion |
|---|---|---|
| Best Market Condition | Strong directional trends | Range-bound, sideways markets |
| Typical Win Rate | 40–50% | 60–70% |
| Profit Profile | Large winners, many small losses | Small, frequent winners |
| Primary Risk | Choppy, directionless markets | Sharp breakouts or persistent trends |
Algorithmic Pattern Recognition
A newer category of quant strategies focuses on detecting structural patterns in price movements. For example, Smart Money Concepts (SMC) uses algorithms to identify institutional activity, such as Order Blocks, Fair Value Gaps (FVGs), and liquidity sweeps. These patterns reflect the footprints of large institutions, and spotting them early can signal the next big move.
However, pattern-based strategies face a major challenge: signal decay. As more traders catch on to a pattern, its effectiveness diminishes over time.
"A signal that worked brilliantly in 2015 might be flat by 2025. This is why quant teams need to continuously research new signals - the alpha treadmill never stops." - Quantt
Another advanced approach is sentiment analysis, which uses natural language processing (NLP) to analyze news, social media, and earnings call transcripts for market sentiment. Even a weak signal - like an Information Coefficient (IC) of just 0.02 - can become powerful when applied consistently across hundreds of stocks.
These advanced strategies highlight the constant evolution in quantitative trading, as traders adapt to stay ahead in the game.
Tools and Skills Needed for Quant Trading
Understanding how quantitative trading works is just the beginning. To successfully execute strategies, you need the right mix of skills and tools. Both play a critical role in building a solid foundation for quant trading success.
Core Skills: Finance, Programming, and Statistics
Quant trading brings together three essential areas: financial market expertise, programming, and statistical analysis. A solid grasp of each is necessary to spot and capitalize on market inefficiencies.
On the financial side, knowing how markets operate is key. Without understanding market structure, you risk creating strategies that might look promising in theory but fail in the real world.
Programming is another cornerstone, and Python is the go-to language for most retail quant traders. Its libraries - like NumPy, Pandas, and Scikit-learn - handle everything from research to backtesting. For high-frequency trading, where execution speed is critical, C++ is often preferred due to its performance capabilities.
Finally, statistics ties it all together. Concepts like probability distributions, correlation, and volatility estimation are crucial for distinguishing genuine opportunities from random market noise. Risk management is equally important; experienced quants typically limit risk to 1–2% of equity per trade and enforce strict drawdown limits across their portfolios.
"Your programming skills will be as important, if not more so, than your statistics and econometrics talents!" - QuantStart
Software and Tools for Quant Trading
The tools you choose depend on your target market and the complexity of your trading strategies. Here's a look at popular platforms used by quant traders:
| Platform | Primary Market | Language | Best For |
|---|---|---|---|
| MetaTrader 4/5 | Forex, CFDs | MQL5 | Retail Forex, automated EAs |
| NinjaTrader | Futures | NinjaScript (C#) | Tick-level backtesting, market replay |
| TradeStation | Stocks, Futures, Options | EasyLanguage | U.S. market trading ecosystem |
| QuantConnect | Multi-asset | Python, C# | Cloud-based research and backtesting |
| TradingView | All markets | Pine Script | Charting, visualization, strategy sharing |
For backtesting, Backtrader is an excellent open-source tool for local Python setups, while QuantConnect offers institutional-level cloud infrastructure and access to over 20 years of historical data. QuantConnect also boasts a thriving community of nearly 500,000 quants, processing over $45 billion in notional volume monthly.
Another often-overlooked tool is VPS hosting. Running algorithms on a home computer exposes you to risks like power outages and unstable internet connections. A VPS ensures your strategies run continuously and securely with minimal latency. For example, QuantVPS offers ultra-low latency (0–1ms) and a 100% uptime guarantee, making it ideal for platforms like NinjaTrader, MetaTrader, and TradeStation. Plans start at $41.99 per month (billed annually), offering a reliable solution without the hassle of managing your own server.
Books, Courses, and Communities for Learning Quant Trading
Once your technical setup is in place, expanding your knowledge with high-quality resources is the next step.
For books, start with Quantitative Trading: How to Build Your Own Algorithmic Trading Business by Ernest Chan. It’s a beginner-friendly guide that walks you through building strategies from scratch. As you advance, Advances in Financial Machine Learning by Marcos López de Prado is invaluable for applying machine learning techniques to financial data. For insights into market structure, Trading and Exchanges by Larry Harris is another must-read.
If you prefer structured courses, QuantInsti offers professional training tailored to aspiring quant traders. Platforms like QuantConnect double as both learning environments and live trading tools. For community-driven learning, the r/algotrading subreddit is a great starting point for beginners, while Elite Trader and Quantcademy cater to those with more experience.
A word of advice: before risking real money, forward test your strategies in a paper trading environment. Aim for at least 50 trades to evaluate execution accuracy and fill speeds. Most experts recommend paper trading for one to three months before going live.
Stay online and closer to execution. Choose a VPS location for CME futures, New York markets, London FX, API trading, and more.
Host your platform near the market route that matters.
From $59.99/mo
How to Start Learning Quantitative Trading
Kick off your journey into quantitative trading by understanding market basics, honing programming skills, and eventually deploying your strategies on a reliable VPS.
Step 1: Build Your Knowledge of Financial Markets
Before diving into coding, make sure you understand how markets work. Get familiar with concepts like the bid-ask spread, order book dynamics, and liquidity. These are especially important if you're aiming for high-frequency trading platforms, where small inefficiencies can have a big impact on profitability.
Next, learn the foundational types of trading signals:
- Momentum: Identifying trends that are likely to continue.
- Mean Reversion: Spotting when prices are likely to return to an average.
- Carry: Leveraging yield differences between assets.
You’ll also need to evaluate your strategies using metrics like the Sharpe Ratio and trailing drawdown, which help measure risk-adjusted returns.
And don’t overlook transaction costs - they’re a common pitfall for beginners. As QuantStart explains:
"Transaction costs can make the difference between an extremely profitable strategy with a good Sharpe ratio and an extremely unprofitable strategy with a terrible Sharpe ratio."
For instance, a trading signal with a 5% annual return might seem promising, but if it racks up 3% in transaction costs, it becomes unworkable. Understanding these costs from the start can save you from pursuing strategies that fail in real-world conditions.
Once you’ve got a solid grasp of market fundamentals, it’s time to dive into programming and backtesting.
Step 2: Learn Programming and Backtesting
Python is the go-to language for quantitative trading. Its libraries, like Pandas for data manipulation and NumPy for calculations, make it incredibly versatile. Beginners might start with Pine Script on TradingView for simpler tasks before graduating to Python for more advanced work.
When backtesting, ensure your process is thorough. Split your historical data into two parts: an in-sample period for developing your strategy and an out-of-sample period for testing it. This helps avoid overfitting - where your model performs well on past data but fails in live markets.
Pay special attention to costs. Slippage for liquid assets generally falls between 0.01% and 0.05%. Also, aim for at least 200 trades in your backtest. Anything less, like a backtest based on just 50 trades, won’t give you reliable results.
Don’t forget to include safeguards. For example, a circuit breaker that stops trading if your equity drops 5% in a day can prevent significant losses during unexpected market events.
These skills will help you turn theoretical strategies into practical, testable systems.
Step 3: Move to Live Trading with VPS Hosting
Once your strategy performs well in backtesting and paper trading, you’re ready to go live. Using a VPS (Virtual Private Server) ensures your algorithm runs continuously with low latency, which is crucial for getting the best trade execution. Relying on a home computer risks downtime, while a VPS offers stability and consistent performance.
QuantVPS is a popular choice for this step. It’s designed specifically for traders and provides ultra-low latency (0–1ms) along with a 100% uptime guarantee. It’s compatible with platforms like NinjaTrader, MetaTrader, and TradeStation, with plans starting at $41.99/month (billed annually). This makes it a practical option for transitioning from paper trading to live execution.
Once your algorithm is live, connect it to your brokerage via an API. Be sure to embed risk controls like stop-loss orders, position size limits, and exposure caps. These features help your strategy operate responsibly, even when it’s running unattended.
Conclusion: Key Takeaways
What to Remember About Quantitative Trading
Quantitative trading relies on four essential components: strategy identification, backtesting, execution, and risk management. These elements must work together seamlessly. If one is neglected, even a well-thought-out strategy can fall apart in live markets.
The standout benefit of quantitative trading is its disciplined approach. As Investopedia explains:
"Computers and mathematics do not possess emotions, so quantitative trading eliminates this problem."
This emotional detachment is a game-changer. It’s not just about speed or complexity - it’s about removing fear and greed from the equation. However, this doesn’t mean quant trading is a hands-off system that runs on autopilot. Market dynamics constantly shift, and trading signals lose their edge over time. To stay competitive, ongoing research and adaptation are non-negotiable.
Quant trading is a challenging field, requiring rigorous testing and robust infrastructure. These principles lay the groundwork for taking actionable steps toward becoming a successful quant trader.
Next Steps for New Quant Traders
Start with the basics. Focus on liquid markets like S&P 500 ETFs to minimize transaction costs. Learn Python, especially libraries like pandas and NumPy, to build and test rule-based strategies. Use around 80% of your historical data for development and reserve 20% for validation to ensure your strategy is sound.
When you’re ready to trade live, don’t overlook infrastructure. A low-latency VPS ensures your algorithm runs continuously without interruptions. For example, QuantVPS offers plans starting at $41.99/month (billed annually) for their Lite plan, with higher-tier options like a Dedicated Server at $209.99/month for more demanding workloads. Combine this with strict risk management - limit individual trades to 1–2% of your total capital and set clear drawdown limits - to establish a strong foundation for success.
FAQs
How much money do I need to start quant trading?
The amount of money you need to start quantitative trading depends on your strategy, goals, and the scale you’re aiming for. Many retail traders kick things off with $1,000 to $3,000. This range is typically enough to cover brokerage minimums, data fees, and basic tools. While having a larger capital base opens the door to more advanced strategies and better risk management, starting with a smaller amount is a practical way to learn and test retail-level approaches.
How do I know my backtest isn’t overfitted?
When developing a trading strategy, it’s essential to avoid overfitting - essentially designing a system that works perfectly on past data but fails in real-world scenarios. To mitigate this, focus on testing your strategy with unused data. Techniques like out-of-sample testing and walk-forward analysis help evaluate how your approach performs on data it hasn’t seen before.
Another key step? Start with clear hypotheses before diving into data analysis. This reduces the risk of introducing bias into your strategy. Finally, test your strategy across a variety of market conditions and time periods. By doing so, you can confirm that it’s adaptable and not overly reliant on specific historical trends.
What risk controls should every trading bot have?
Every trading bot needs solid risk controls to safeguard capital and maintain long-term viability. Some key strategies include using stop-loss orders to cap potential losses and setting maximum drawdown limits to prevent substantial account depletion. Managing position sizes is equally important to avoid overexposure in volatile markets.
On top of that, implementing take-profit levels secures gains, while real-time risk adjustments allow the bot to adapt to shifting market conditions. Together, these measures create a framework for navigating the often unpredictable world of trading.


