
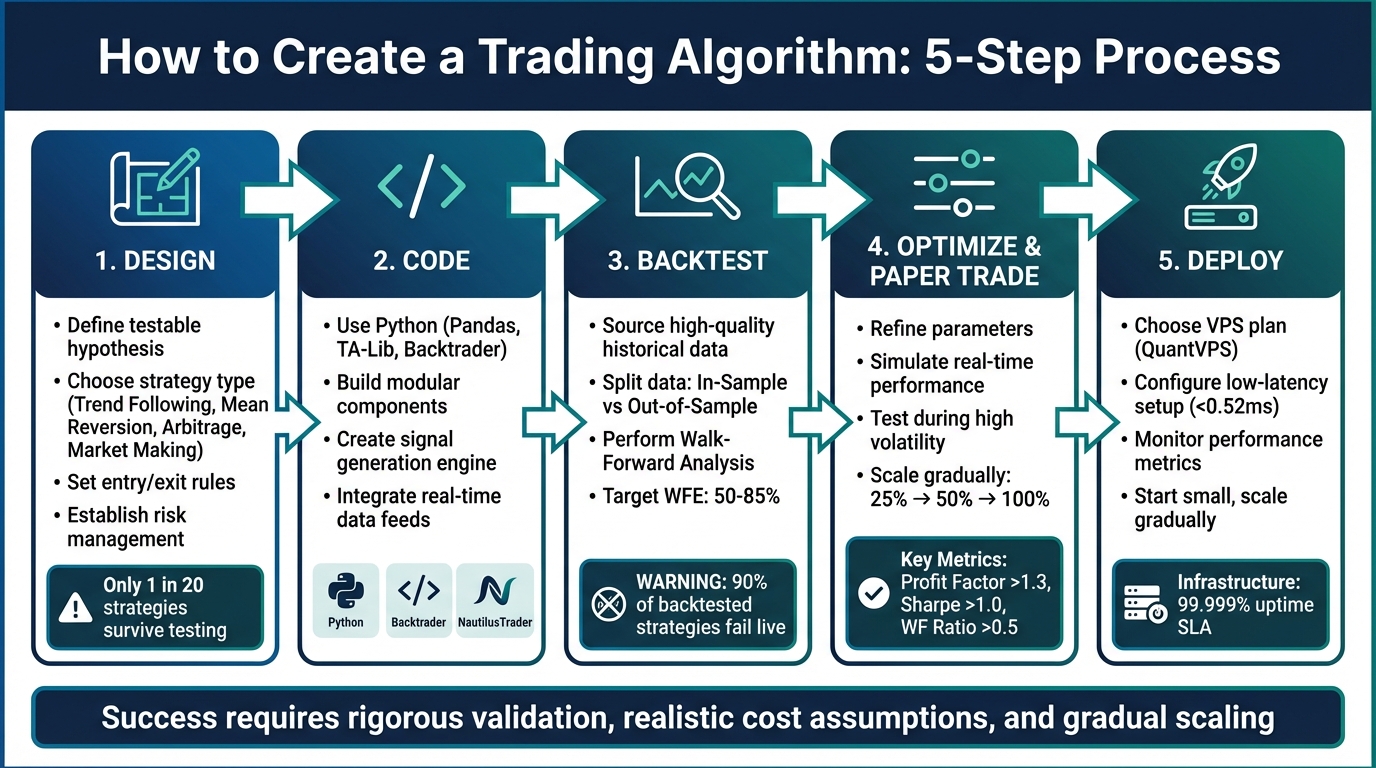
Creating a trading algorithm involves designing a strategy, coding it, testing its performance, and deploying it for live trading. Here's a quick breakdown:
- Design: Start with a clear, testable hypothesis. Choose a strategy type (e.g., trend following, mean reversion) and define entry, exit, and risk management rules.
- Code: Use Python and libraries like Pandas, TA-Lib, and Backtrader. Build modular components for data handling, signal generation, and execution.
- Backtest: Validate your strategy using high-quality historical data. Split data into in-sample and out-of-sample sets, and perform walk-forward analysis to avoid overfitting.
- Optimize: Refine parameters and test in real-time through paper trading. Ensure the strategy performs well under live conditions with realistic transaction costs.
- Deploy: Use one of the best VPS for algorithmic trading like QuantVPS for reliable execution. Start with small position sizes and scale gradually.
Over 90% of backtested strategies fail in live trading. Rigorous validation, realistic cost assumptions, and gradual scaling are key to success.
5-Step Trading Algorithm Development Process from Design to Deployment
Step 1: Design Your Trading Strategy
A well-defined, testable hypothesis is the cornerstone of any trading strategy. Broad ideas like "momentum works" won't hold up in real market conditions. Instead, get specific: identify the assets you're targeting, establish a lookback period, set an expected monthly outperformance (e.g., 0.5%), and explain the rationale behind the pattern. This level of detail eliminates uncertainty and helps you avoid mistaking random noise for meaningful signals.
Choose Your Strategy Type
Your strategy should align with market dynamics and the tools you have at your disposal. Here are some popular approaches:
- Trend Following: This strategy captures directional market moves during periods of strong momentum. It works best in trending markets and doesn't require extreme speed.
- Mean Reversion: This method assumes prices will eventually revert to a long-term average, making it effective in stable, range-bound markets with low volatility.
- Arbitrage: By exploiting price differences between related instruments, this approach is market-neutral and low-risk but demands ultra-fast execution and Direct Market Access.
- Market Making: This strategy profits from the bid-ask spread by providing liquidity. It requires high-frequency execution and advanced inventory management.
| Strategy Type | Best Market Condition | Primary Goal | Risk Level |
|---|---|---|---|
| Trend Following | Strong Momentum | Capture directional moves | Medium |
| Mean Reversion | Range-bound / Sideways | Profit from price corrections | Low to Medium |
| Arbitrage | Inefficient / Fragmented | Capture price gaps | Very Low |
| Market Making | High Liquidity / Low Vol | Earn bid-ask spread | Low (Inventory Risk) |
| News-Based | High Volatility Events | React to catalysts | High |
For beginners, it's smart to start with highly liquid markets, such as major Forex pairs (like EUR/USD) or large-cap equities, before venturing into more volatile assets like cryptocurrencies. Keep in mind that only about 1 in 20 strategies survives rigorous testing and makes it to live trading. Laying a solid foundation is critical.
Set Entry, Exit, and Risk Management Rules
Every strategy needs clear, machine-readable rules for entries, exits, and risk management. For example, you might define an entry condition like: "50-day EMA crosses above 200-day EMA and RSI is above 55". Use asymmetric thresholds to balance risk and reward - high-conviction entries might require a Z-score below -2.0, while exits could be triggered by smaller deviations like -0.5 to lock in profits quickly and reduce exposure.
Consider using volatility-based stops, such as exiting a trade if the price moves 3× ATR (Average True Range) against your position. This approach adjusts to market conditions rather than relying on fixed dollar amounts. Test your strategy's resilience by doubling your estimated transaction costs - if it fails this stress test, it's too fragile for live trading.
Establish clear shutdown rules before deployment. For instance, halt the algorithm if drawdowns exceed the 5th percentile of a Monte Carlo simulation or if the win rate drops 15% below historical averages.
Prototype Using Python
Once you have a strategy framework, start building a prototype in Python. Use tools like Pandas and NumPy for data manipulation, TA-Lib for technical indicators, and Numba to speed up operations like trailing stops. For quick hypothesis testing and parameter sweeps, leverage vectorized engines like VectorBT. Later, transition to event-driven simulators such as NautilusTrader for more accurate execution and microstructure validation.
A modular prototype is key. Separate components for data loading, strategy logic, execution, and performance analysis ensure flexibility and clarity. For momentum strategies, exclude the most recent 21 trading days to avoid contamination from short-term reversal noise. Normalize your signals using cross-sectional ranking or Z-scores to prevent high-volatility instruments from skewing results.
Before running simulations, thoroughly audit your data for issues like survivorship bias, look-ahead bias, and stale prices (e.g., prices that haven't changed for over five days). These checks are critical to ensure the reliability of your backtests.
Step 2: Code the Algorithm
Once your prototype is validated, it's time to turn it into a production-ready system. This system should handle signal generation, risk management, and automated execution automatically. A modular architecture is essential here - keep data handling, signal generation, execution logic, and portfolio tracking as separate components for better flexibility and maintenance.
Select Your Tools and Platforms
Python continues to dominate the algorithmic trading space in 2026, largely because of its rich library ecosystem. For backtesting and strategy development, Backtrader is a popular choice. It’s an open-source framework that simplifies the process by letting you focus on strategy creation instead of infrastructure building. Its "Cerebro" engine automates tasks like broker instantiation and data handling.
For those seeking high-performance solutions that work seamlessly for both backtesting and live trading, NautilusTrader is a strong option. It supports Python 3.12–3.14 and offers a smooth transition from simulations to real-world trading. If you're working in the cloud and need machine learning capabilities, the LEAN Engine is a great platform. It supports multi-asset modeling and integrates with popular libraries like Scikit-Learn, PyTorch, Tensorflow, and XGBoost. You can even use AI models such as FinBERT for financial sentiment analysis, thanks to Hugging Face integration.
When it comes to execution, your platform should connect to well-known brokerages like Interactive Brokers, Alpaca, or Tradier for stocks, or exchanges like Binance and Coinbase for cryptocurrencies. If you're using NautilusTrader, the High-Level API (featuring BacktestNode and TradingNode) is recommended for production trading, while the Low-Level API is better suited for library developers.
Build Signal Generation and Execution Engines
Your algorithm's structure should include an __init__ method for setting up indicators, a start method for initialization, and a next method for processing new data bars. Signal generation should use cross-sectional ranking to normalize signals into percentile ranks. This approach helps ensure that instruments with high variance don’t disproportionately influence your trades. For momentum-based strategies, compute 12-month returns while skipping the most recent 21 trading days to filter out short-term noise.
The execution engine is where signals are converted into orders - Market, Limit, Stop, or Bracket orders. Always include a notify_order method to handle status updates like Submitted, Accepted, Completed, or Rejected. This ensures your system effectively manages scenarios like margin calls or order rejections. Keep in mind that market orders typically execute at the opening price of the next bar, as this is the first available price after a signal is generated at the close of the current bar.
To automate position sizing, use a dynamic approach based on current portfolio equity rather than hardcoding fixed amounts. This makes your system adaptable to different portfolio sizes. Don’t forget to account for trading costs - use functions like cerebro.broker.setcommission(commission=0.001) to simulate realistic fees. Even a small 0.1% commission per trade can have a noticeable impact on your portfolio’s performance over time.
Integrate Real-Time Data Feeds and APIs
Securely connect to your data and execution platforms using OAuth or API keys. For instance, Interactive Brokers requires weekly two-factor authentication (2FA) re-authentication to prevent timeouts. If you’re using Alpaca, which offers commission-free trading for stocks, options, and ETFs, authentication is handled via OAuth login.
To improve system reliability, implement automatic restart settings to recover from temporary outages or API disconnections. Use a "Brokerage Model" in your code to handle asset-specific fees and slippage automatically, such as self.set_brokerage_model(BrokerageName.ALPACA). Sharing market data subscriptions between paper and live trading accounts ensures consistency when transitioning to live trading.
NEVER MISS A TRADE
Your algos run 24/7
even while you sleep.
99.999% uptime • Chicago, New York, London & more data centers • From $59.99/mo
Avoid placing manual orders on the same brokerage account where your algorithm is running. This can create race conditions and potentially cause the system to shut down for safety reasons. Platforms like Backtrader treat real-time data feeds as member variables (e.g., self.datas[0]), allowing your strategy to function seamlessly with both historical and live data.
With your algorithm coded and real-time data integrated, the next step is rigorous backtesting to refine and validate your system.
Step 3: Backtest the Algorithm
Once you've designed and coded your algorithm, the next step is to put it to the test. This isn't just about running a quick check - it’s about thoroughly validating whether your strategy has a real edge or if it’s just tailored to past market behavior. This phase is critical to ensure your algorithm can handle live trading conditions.
Source High-Quality Historical Data
The foundation of any reliable backtest is high-quality historical data. Platforms like QuantConnect provide over 100 terabytes of preformatted data for futures, forex, equities, and crypto. For futures, services like IQFeed and Nasdaq Data Link are excellent sources, while forex traders often turn to IQFeed or Oanda.
The type of data you need depends on your trading style:
- Tick data: Captures every price change, ideal for high-frequency strategies.
- Intraday data: Includes M1, M5, or H1 bars, suited for day and swing trading.
- End-of-Day (EOD) data: Works for long-term trend-following strategies.
To ensure realistic backtests, match your data to your broker’s feed. This helps account for actual spreads and minimize slippage. Also, watch out for survivorship bias in equity data - excluding delisted or bankrupt companies can inflate returns artificially. Clean your data thoroughly by addressing bad ticks, unexplained price gaps, and corporate actions like splits, dividends, and mergers. Free data sources, like Yahoo Finance, often require extra effort to ensure accuracy.
Perform Out-of-Sample Testing and Walk-Forward Analysis
Split your historical data into two parts: an In-Sample (IS) set for developing and fine-tuning your strategy, and an Out-of-Sample (OOS) set for testing its performance on unseen data. To simulate future conditions, reserve at least the last 12 months as your OOS holdout period.
Take this further with Walk-Forward Analysis (WFA), which divides your data into rolling segments. For example, optimize your strategy on Year 1 data, test it on the first three months of Year 2, then shift the window forward and repeat. This approach helps capture evolving market conditions.
To measure robustness, use the Walk-Forward Efficiency (WFE) ratio, which compares OOS profits to IS profits. A WFE between 50% and 85% signals a solid strategy, while anything below 35% suggests curve-fitting. Before live trading, aim for:
- A WFE above 50%
- At least 70% profitable OOS windows
- OOS drawdowns within 50% of IS levels
These benchmarks help ensure your strategy is ready for the next phase of testing.
Avoid Overfitting with Unseen Data Validation
Overfitting happens when your algorithm becomes too tailored to historical data, losing its ability to generalize. Be on the lookout for these red flags:
- Unrealistically high win rates (90%+)
- Extreme sensitivity to parameter changes
- Too many variables for the data size
Studies indicate that running more than 70 backtests or using over 20 parameters on a single strategy often leads to overfitting. To avoid this, limit your strategy to 3 or 4 parameters to reduce complexity. Replace fixed values, like static stop losses, with dynamic logic such as ATR-based stops to adapt to market volatility. You can also stress-test your strategy by adding random price "noise" to historical data - if profitability drops significantly, your strategy might be overfitted.
"Walk-Forward Analysis is the professional trader's solution to this heartbreak. It is the gold standard of validation, acting as a rigorous 'BS detector'." - FXNX
Finally, factor in realistic transaction costs and slippage. Run a 50% cost stress test - if doubling your estimated fees makes the strategy unprofitable, it’s too fragile for live trading. Use tools like cerebro.broker.setcommission(commission=0.001) to simulate the cumulative impact of fees, which can add up quickly over multiple trades. These steps ensure your backtest is a meaningful indicator of future performance, preparing your strategy for live deployment.
Step 4: Optimize and Paper Trade
Once backtesting confirms your strategy's historical potential, the next step is to refine its parameters and test it in real-time conditions - without putting your actual funds at risk. This phase is critical for identifying strategies that can handle the challenges of live markets.
Refine Parameters Based on Backtest Results
Start by focusing on the key variables that shape your strategy. These include factors like lookback periods (e.g., a 60-day range for stability), entry and exit criteria (such as z-scores), and indicator timeframes. The goal is to find parameter values that provide consistent results, avoiding overfitting to specific historical data.
Use a step-by-step optimization process. Adjust one parameter at a time while keeping others fixed at reasonable defaults. For example, when working with a moving average crossover strategy, you might first test the fast average period (e.g., 10 to 30 days in 5-day intervals) to identify a stable range. Once that's set, move on to the slow average period.
Incorporate sensitivity analysis by tweaking each parameter incrementally. A smooth performance curve suggests a robust system, while sharp peaks could indicate over-reliance on temporary market conditions. Apply filters progressively - start with broad market trends (e.g., trending vs. ranging), then consider seasonal factors like specific days or hours, and finally fine-tune strategy-specific settings.
Focus on risk management metrics rather than just maximizing returns. For instance, aim to reduce maximum drawdowns and shorten recovery times instead of simply chasing a high Sharpe ratio. Keep in mind that only about 1 in 20 strategy ideas typically survives the rigorous validation process to reach live trading. Once the parameters are optimized, move on to testing the strategy in real-time conditions through paper trading.
Simulate Real-Time Performance
With your refined parameters in hand, the next step is to simulate live market conditions through paper trading. This allows you to test your strategy in real-time without risking money. Be sure to account for broker fees and slippage in your simulation - use at least 1 tick for liquid markets or 2–3 ticks for less liquid ones. High-resolution data, such as minute or tick-level, is essential for accurate order timing, as daily data won't capture intraday price movements.
Define clear stop criteria before starting. For example, you might halt paper trading if the drawdown exceeds the worst 5% of simulated outcomes or if the win rate drops 15% below historical averages. Aim for a sufficient number of trades - 100 to 200 is a good benchmark for most strategies, though high-frequency systems may require even more, while swing trading should be tested across multiple market cycles.
Pay close attention to execution metrics like slippage, bid-ask spreads, and latency. These can eat into your profits and reveal whether your strategy is practical for live trading. Your average profit per trade should comfortably cover transaction costs; if higher costs significantly reduce profitability, your strategy may not be robust enough for real-world use.
STOP LOSING TO LATENCY
Execute faster than
your competition.
Sub-millisecond execution • Direct exchange connectivity • From $59.99/mo
| Metric | Target Threshold | Purpose |
|---|---|---|
| Profit Factor | > 1.3 to 1.5 | Ensures profits outweigh losses after accounting for costs |
| Sharpe Ratio | > 1.0 | Measures whether returns justify the associated risk |
| Walk Forward Ratio | > 0.5 | Compares out-of-sample returns to in-sample results to check for overfitting |
| Sample Size | 100–1,000+ trades | Ensures statistical reliability for the strategy's performance |
These metrics help confirm that your refinements not only improve performance but also enhance risk management.
To further test your strategy, paper trade during periods of high market volatility or major news events. This will reveal how it handles challenges like widening spreads and slippage. When you're ready to move to live trading, start small - use 25% of your target position size in the first month, increase to 50% in the second month, and only scale to full size once live results align with your backtests. This gradual approach protects your capital while ensuring your strategy performs as expected in real market conditions.
Step 5: Deploy the Algorithm on QuantVPS
Once you've achieved successful results in paper trading, it's time to deploy your algorithm on QuantVPS for continuous, live trading. Using a specialized trading VPS ensures your strategy operates 24/7 with minimal delays and high reliability - key factors for algorithmic trading success in 2026.
Choose the Right QuantVPS Plan
Your choice of QuantVPS plan should depend on the number of charts and strategies you plan to run. Here’s a breakdown of the available options:
- VPS Lite: $59.99/month, supports 1–2 charts, includes 4 cores, 8GB RAM, and 70GB NVMe storage.
- VPS Pro: $99.99/month, handles 3–5 charts, with 6 cores, 16GB RAM, and 150GB NVMe storage.
- VPS Ultra: $189.99/month, accommodates 5–7 charts, offering 24 cores, 64GB RAM, and 500GB NVMe storage.
- Dedicated Server: $299.99/month, for heavy workloads, provides 16+ dedicated cores, 128GB RAM, and 2TB+ NVMe storage.
For CME futures trading, location is just as important as hardware. Servers based in Chicago are ideal, as QuantVPS offers direct fiber-optic connections with latency under 0.52ms to the CME. This proximity significantly reduces execution delays, a critical advantage in live trading. Additionally, all plans feature NVMe storage for fast data access, and trading platforms in 2026 generally require CPU cores with speeds of 3.7+ GHz for optimal performance.
| Plan | Monthly Price | CPU Cores | RAM | Storage | Charts/Strategies | Backtesting | Latency (CME) |
|---|---|---|---|---|---|---|---|
| VPS Lite | $59.99 | 4x AMD EPYC | 8GB DDR4 | 70GB NVMe | 1–2 | Not supported | <0.52ms |
| VPS Pro | $99.99 | 6x AMD EPYC | 16GB DDR4 | 150GB NVMe | 3–5 | Simple | <0.52ms |
| VPS Ultra | $189.99 | 24x AMD EPYC | 64GB DDR4 | 500GB NVMe | 5–7 | Moderate | <0.52ms |
| Dedicated Server | $299.99 | 16+ dedicated cores | 128GB DDR4 | 2TB+ NVMe | 7+ | Extensive | <0.52ms |
All plans allow for resource upgrades on demand, enabling you to scale up during high market volatility without risking data loss or configuration issues.
Configure for Low-Latency Setup
To get started, retrieve your VPS credentials from the QuantVPS dashboard. Use Remote Desktop Protocol (RDP) to log in. The VPS comes preloaded with Windows Server 2022, which is highly compatible with trading platforms like NinjaTrader and Tradovate.
Once logged in, download your trading platform directly using the VPS browser to ensure secure operations. Install the platform using default paths to avoid script compatibility issues. After installation, log in with your broker or evaluation account credentials and load your trading strategy.
For uninterrupted operations, set the platform to auto-launch on startup. This ensures your algorithm resumes automatically after any system reboot or maintenance.
Ensure Performance and Reliability
After deployment, closely monitor your algorithm's performance during the initial weeks of live trading. Pay attention to metrics like slippage, fill rates, and actual latency to confirm they match your paper trading results. QuantVPS guarantees a 99.999% uptime SLA for its core network infrastructure and includes essential security features like DDoS protection, encrypted RDP access, and automatic backups.
If you face any configuration challenges, the QuantVPS support team is available through their ticket system to review and optimize your setup. To minimize risks, start with 25% of your intended position size and gradually scale up, just as you did during paper trading.
With your algorithm now live on QuantVPS, you're set for reliable and low-latency trading operations.
Conclusion
Building successful trading algorithms takes discipline at every stage, from design to live deployment. Only strategies that endure thorough testing deserve real capital allocation. This structured approach shields you from the sobering reality: over 90% of strategies that seem profitable in backtests fail when traded with actual money.
The cornerstone of success lies in rigorous validation. Incorporate realistic transaction costs from the outset, save out-of-sample data for final testing, and always prioritize paper trading. As Andreas Clenow, Quantitative Fund Manager, emphasizes:
"Paper trading is not optional, it's a requirement. If your strategy doesn't survive two weeks in demo, it won't survive in live trading".
When moving to live trading, scale up gradually. Jumping into full-scale deployment too quickly can turn a promising backtest into a costly mistake.
Beyond validation, ensure your strategy's live execution is just as solid. Infrastructure plays a critical role, as VPS latency impacts algorithmic trading performance significantly. QuantVPS, with its ultra-low latency and reliable uptime, ensures uninterrupted execution, minimizing slippage and delays that could eat into your profits.
Lastly, set clear stop criteria, track key performance metrics, and halt trading if results deviate unexpectedly. Keep in mind: recovering from a 50% loss requires a 100% gain. By combining these practices, you create a durable and effective trading system.
FAQs
How do I know my strategy isn’t overfitted?
To make sure your trading strategy holds up in real-world scenarios, think of backtesting as a way to test a hypothesis. Use strong validation methods to avoid molding your model to random noise in past data. Instead, concentrate on identifying patterns that can consistently apply across various market environments. Test your strategy in different conditions to confirm its reliability.
What data quality issues can ruin a backtest?
Poor data quality can throw a wrench into backtest results. Problems like inaccurate or incomplete price and volume data, missing data points, or timestamp errors can lead to misleading conclusions. This might give a false sense of confidence in a trading strategy's effectiveness. To get accurate backtesting results, it's crucial to work with clean and reliable data.
When is my algorithm ready to go live?
When your algorithm has successfully cleared all validation, robustness, and stress tests, and has been extensively backtested to verify its reliability under current market conditions, it's ready to go live. Completing these steps is essential to reduce risks and ensure it performs effectively in live trading scenarios.


