
NinjaTrader is the best DOM trading platform for futures traders who want speed and customization, and Bookmap is best for seeing liquidity and order flow as a heatmap. Quantower suits multi-asset traders, Sierra Chart starts at $26 a month, and Jigsaw daytradr and ATAS add tape and footprint tools.
- NinjaTrader: Known for its customizable SuperDOM, it offers fast order execution and real-time analytics. Ideal for futures traders, with ATM strategies and Order Flow+ tools.
- Bookmap: Offers a visual approach with heatmaps and volume bubbles, making it easy to monitor liquidity and order flow. Its paid plans start at $49/month with the Global package, which adds live futures and stock data connections (prices checked on 6 Nov 2026).
- Quantower: Combines a user-friendly DOM interface with fast order execution and multi-broker support. Offers flexible pricing and supports various markets.
- Sierra Chart: A low-cost platform with a Chart DOM and a Trade DOM, sold by monthly Service Package.
- Jigsaw daytradr: Built around the Jigsaw DOM, with tape reading and trade management tools for futures scalpers.
- ATAS: A Smart DOM with click trading, alongside footprint and heatmap tools.
Each platform has unique strengths, whether you value speed, visualization, or flexibility. Below is a quick comparison to help you choose:
| Platform | Key Features | Starting Price (checked on 6 Nov 2026) | Best For |
|---|---|---|---|
| NinjaTrader | Customizable SuperDOM, ATM strategies, Order Flow+ | Free plan; $99/month or $1,499 lifetime | Futures traders |
| Bookmap | Heatmaps, historical liquidity | Free (Digital); paid from $49/month | Visualizing order flow |
| Quantower | User-friendly DOM, multi-market support | Free (basic) | Multi-asset traders |
| Sierra Chart | Chart DOM and Trade DOM, pulling and stacking columns | $26/month | Low monthly cost |
| Jigsaw daytradr | Jigsaw DOM, reconstructed tape, trade management | $579 one time | Futures DOM scalpers |
| ATAS | Smart DOM, footprint, heatmap | Free (Start plan) | Footprint and DOM in one platform |
Choose the one that fits your trading needs and style.
Keep NinjaTrader running near CME while you're away.






1. NinjaTrader
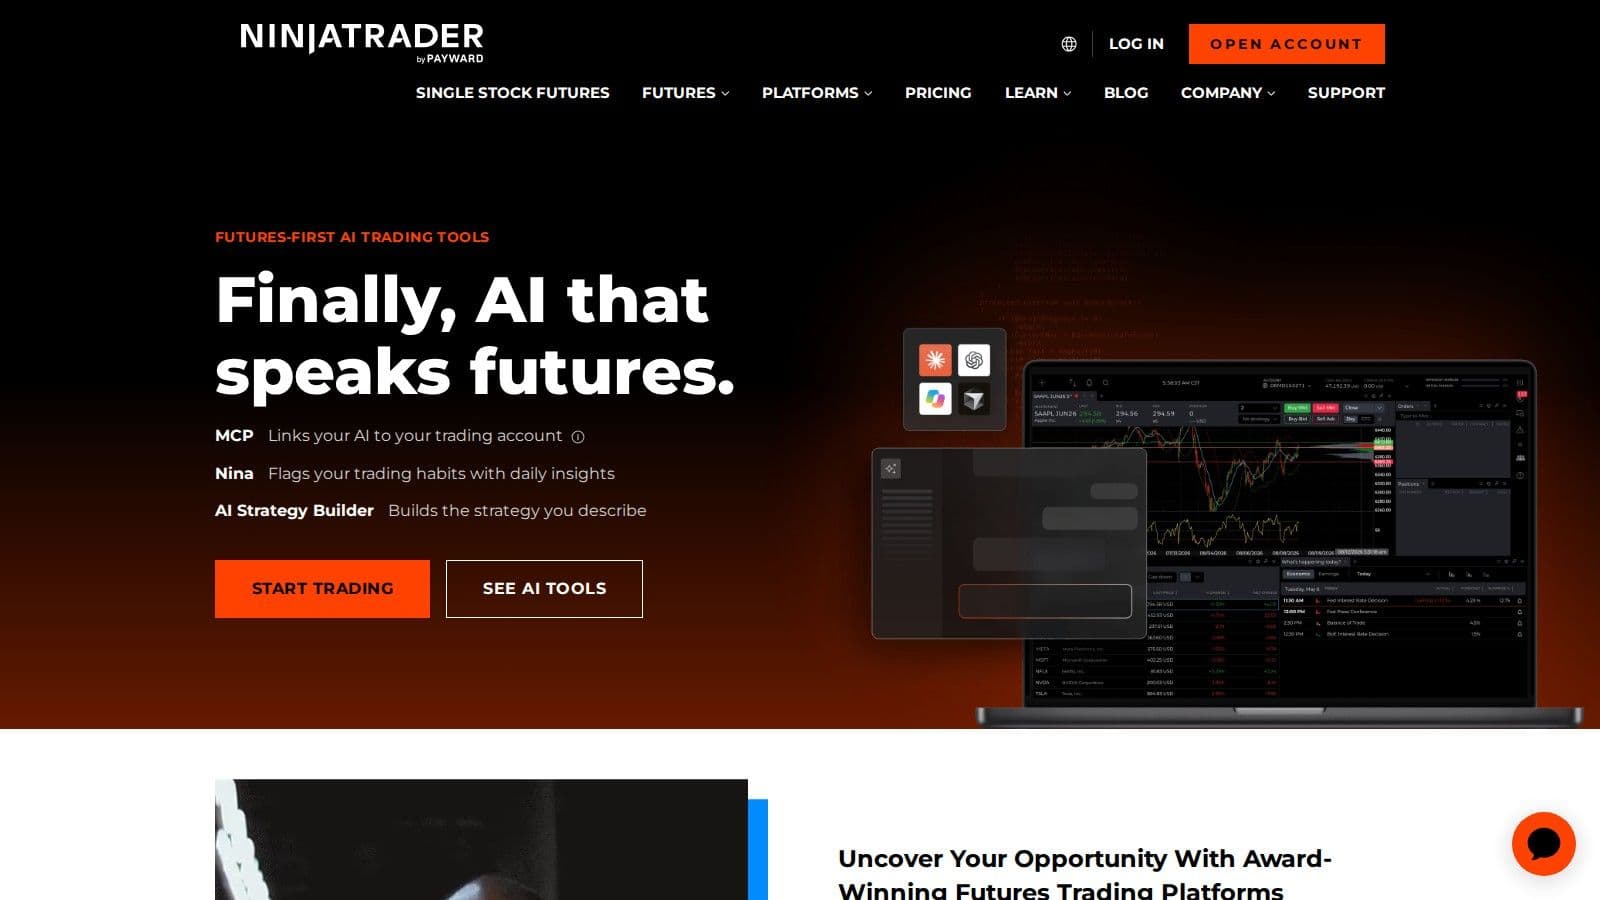
NinjaTrader is a futures platform built around the SuperDOM, a price ladder for placing, moving and cancelling orders with a click. You can trade through a NinjaTrader Brokerage account, cleared by NinjaTrader Clearing (NFA ID 0309379), or connect another supported provider.
This video walks through NinjaTrader workspaces, trading tools and risk controls.
SuperDOM Columns and Order Entry
The SuperDOM shows bid and ask depth around the inside market and lets you submit, modify and cancel orders from the ladder. It comes in Static and Dynamic versions and ships with 4 system columns: APQ (Approximate Position in Queue), Notes, PnL and Volume.
APQ estimates how many contracts sit ahead of your limit order, based on the size shown when you placed it. The Volume column can split session volume into buys at the ask and sells at the bid, which needs historical bid/ask tick data from your data provider.
ATM Strategies
ATM (Advanced Trade Management) strategies attach stop loss and profit target brackets to an entry automatically. Select a saved ATM template in the SuperDOM before you click, and the brackets are placed when the entry fills. If you add to the position, the active strategy can resize the existing brackets instead of creating new ones.
Order Flow+ Tools
Order Flow+ adds order flow studies to NinjaTrader charts: Volumetric Bars, Cumulative Delta, Delta Bars, Market Depth Map, Trade Detector, Volume Profile and VWAP. NinjaTrader says Order Flow+ is included for all Lifetime license users ($1,499 one time), and its pricing page lists it among the plan benefits that unlock once a live account is funded (checked on 6 Nov 2026).
Connections
NinjaTrader's connection guides list NinjaTrader Brokerage accounts, Rithmic and Tradovate evaluation services for prop firm accounts, Interactive Brokers, Kinetick, IQFeed, Coinbase, FXCM and Barchart (checked on 10 Oct 2026). To connect a provider alongside your NinjaTrader account, turn on Multi-provider mode.
Traders who run several accounts usually do it from a single NinjaTrader VPS, so every connection shares one low-latency link to the exchange.
2. Bookmap
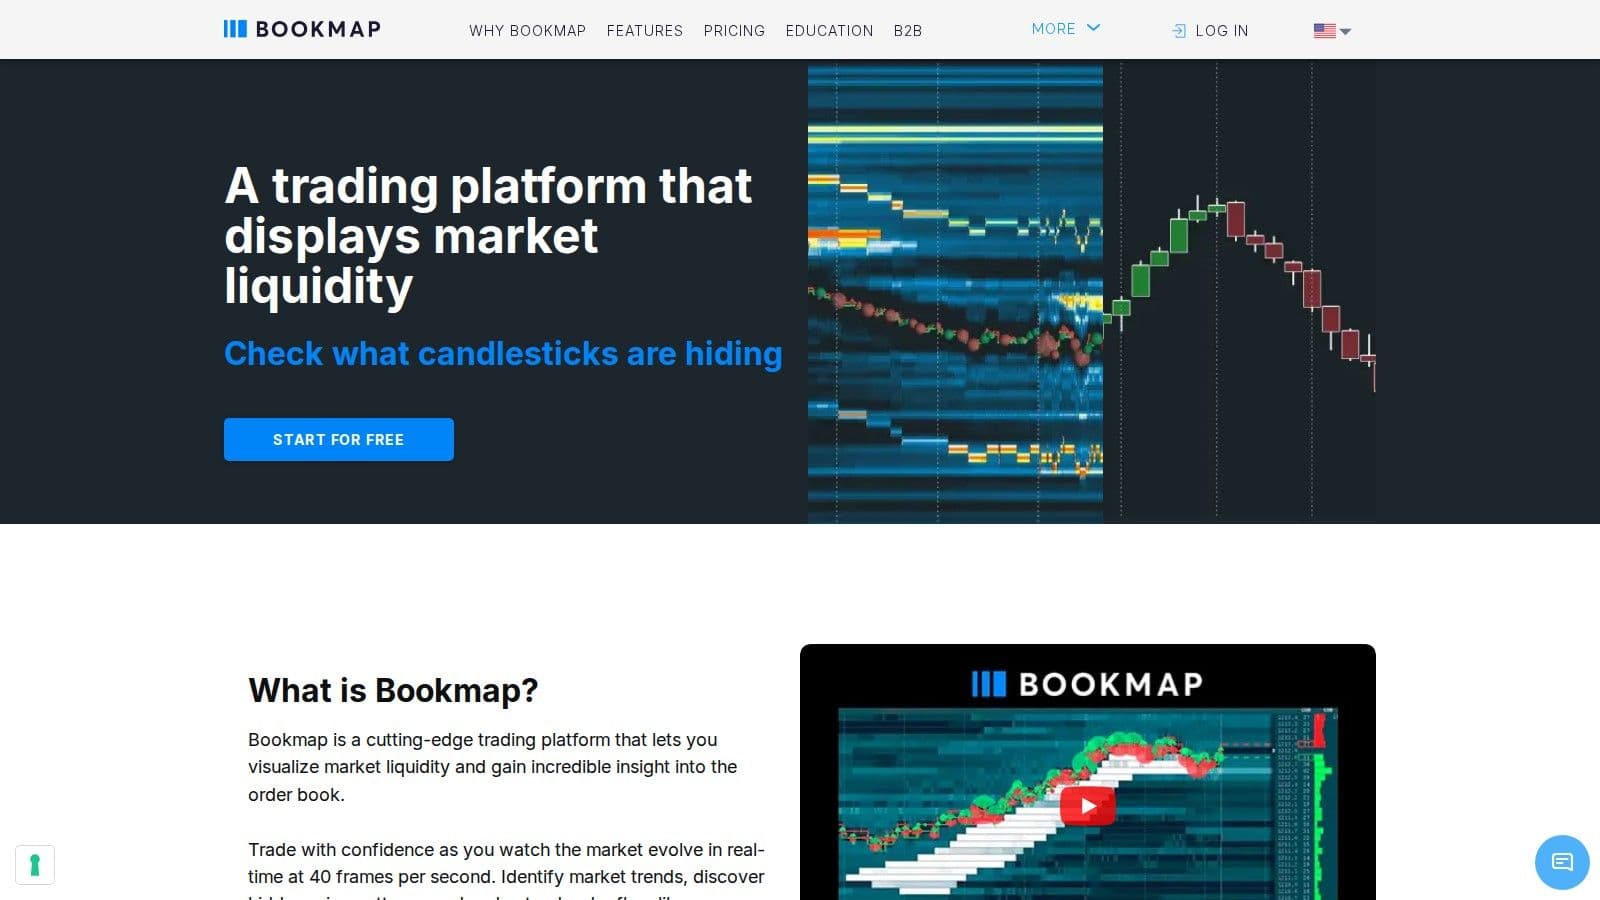
Bookmap takes a different approach from platforms that rely on traditional numeric DOM displays. It turns order book data into visual heatmaps and volume bubbles, offering traders a more dynamic view of market activity. Instead of static numbers, Bookmap lets you watch liquidity and order flow patterns evolve over time through color-coded visuals.
Visualization Tools
One of Bookmap's standout features is its heatmap visualization, which uses color blocks to show historical liquidity data. Large institutional orders are easy to spot as bright, concentrated areas, making it clear where significant volume clusters are happening. Meanwhile, volume bubbles provide a real-time look at aggressive buying and selling. These bubbles expand or contract based on the intensity of market participation, making sudden shifts in sentiment instantly visible.
By combining elements of traditional DOM, Footprint charts, and Volume Profile into a single interface, Bookmap offers a clear and fast way to analyze executed trades and liquidity dynamics. This streamlined view is particularly useful for traders who rely on DOM trading strategies.
Market/Broker Compatibility
Bookmap works with both futures and stock markets. However, real-time market data requires an additional fee, which is separate from the software subscription. This allows traders to tailor their data feeds to the specific markets they trade, avoiding unnecessary costs for data they don’t need.
For advanced tools, the Global+ package adds DOM Pro, Execution Pro, Footprint, Multibook Customizer and the Absorption and Sweep indicators, which are designed to help traders better understand institutional order flow.
Pricing
Bookmap has four packages (checked on 6 Nov 2026). Digital is free. Global costs $49/month or $39/month billed yearly ($990 lifetime), Global+ costs $99/month or $79/month billed yearly ($1,990 lifetime), and Global Premium costs $199/month or $158/month billed yearly ($3,990 lifetime). Live futures and stock data are not included in any package and are paid separately.
| Package | Billed Monthly | Billed Yearly | Lifetime | Key DOM Features |
|---|---|---|---|---|
| Digital | Free | Free | Free | Delayed US stocks and futures, real-time crypto |
| Global | $49/month | $39/month | $990 | Live futures and stock data connections (BookmapData, dxFeed, Rithmic), multiple broker support |
| Global+ | $99/month | $79/month | $1,990 | DOM Pro, Execution Pro, Footprint, Multibook Customizer |
| Global Premium | $199/month | $158/month | $3,990 | Everything in Global+, plus the MBO Bundle and Options Strike |
One feature that gets consistent praise from users is the market replay mode. This tool allows traders to revisit past market sessions tick-by-tick, giving them the chance to analyze liquidity patterns as they developed. It’s an excellent way to practice and refine trading skills without putting real money on the line.
3. Quantower
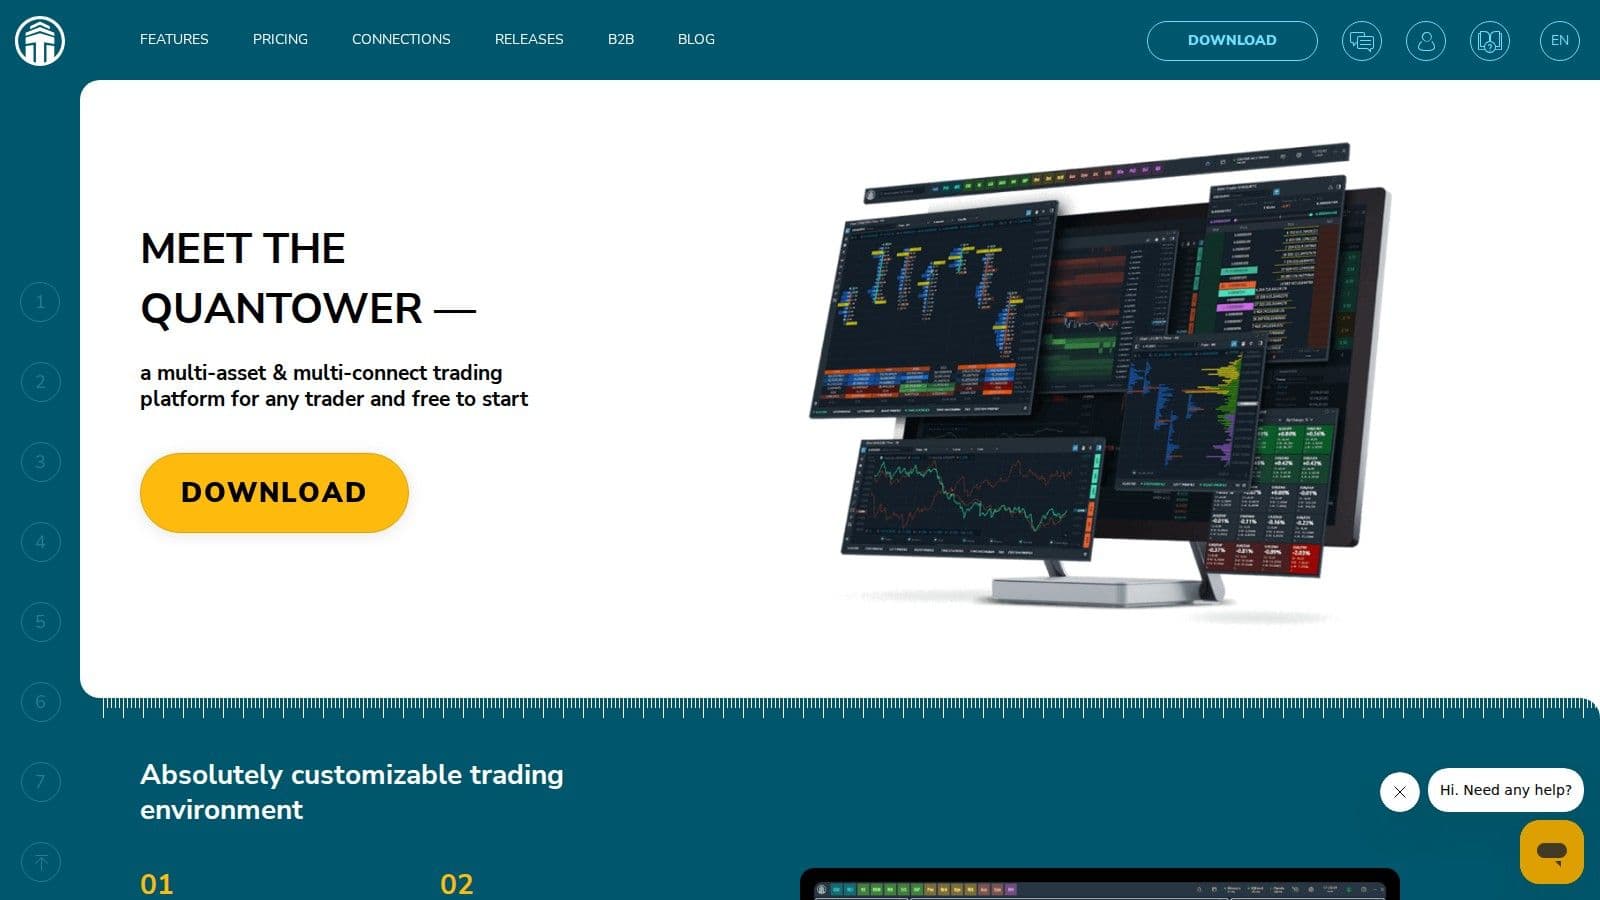
Quantower provides a DOM interface with clear visuals and tools for managing orders. Many traders run it on a Quantower VPS to keep the DOM connected through the session. Its DOM Trader panel simplifies the complexities of the order book, enabling traders to spot opportunities and execute trades with precision. If you trade a funded account, check our list of prop firms compatible with Quantower.
Visualization Tools
Quantower’s DOM Trader panel presents buy and sell orders at various price levels in a way that’s easy to understand. This clear, graphical display helps traders quickly identify clusters of large orders, which often act as short-term support or resistance levels.
One of its strengths is the ability to visually track volume patterns. For instance:
- Large bid volumes at a certain price level can signal strong buying interest and potential support.
- High ask volumes may indicate selling pressure and possible resistance.
The platform also shows the depth of the order book. A "fat" order book suggests good liquidity, while a "light" order book might point to higher volatility. These insights help traders adjust their position sizes and manage risk effectively. For added flexibility, users can customize their display through features like "View Settings" and "DOM Trader Columns", tailoring the interface to suit their trading style.
For example, an E-mini S&P 500 (ES) trader may see a large group of bids resting a few ticks below the market in the DOM Trader. While that size stays, it can act as short-term support. If the bids are pulled before price reaches them, the level may not hold.
These visualization tools work with the platform’s advanced execution features, making it a reliable choice for active traders.
Order Entry with Mouse Trading
Quantower’s Mouse Trading mode speeds up the process of placing and managing orders. A left-click in the left column instantly places a Buy Limit order, while a left-click in the right column does the same for a Sell Limit order. For stop orders, holding the Shift key and clicking at the desired price level allows for quick placement. Need to adjust or cancel an order? The drag-and-drop functionality on the DOM interface makes it easy to modify or remove orders in seconds.
Market/Broker Compatibility
Beyond its visual and execution capabilities, Quantower supports a wide range of markets and connects to multiple brokers and data providers. This broad compatibility ensures traders have the flexibility they need to operate effectively across different markets.
4. Sierra Chart
Sierra Chart offers two DOM layouts: a Chart DOM, which is a price ladder on the side of a chart, and a traditional Trade DOM window, opened with File >> Open Trading DOM for Chart. Both let you enter, move and cancel orders from the ladder.
DOM columns can show bid and ask size, recent bid and ask volume, cumulative last size, and market depth pulling and stacking, which tracks size added to or pulled from each price. You set them up under Customize Chart/Trade DOM Columns.
Sierra Chart is sold by monthly Service Package (checked on 6 Nov 2026). Base packages cost $26 or $36 a month and only use Sierra Chart's own data services. To connect external services such as Rithmic or CQG, you need an Integrated package at $36, $46 or $56 a month.
Uptime
99.999% uptime. Built for 24/7 trading reliability.
Your VPS runs in Tier IV datacenters with redundant power and network, monitored 24/7 on site.
See the uptime SLAFrom $29.99/mo · Windows or Linux
5. Jigsaw daytradr
Jigsaw daytradr is built around the Jigsaw DOM, with order flow tools such as Depth & Sales, Reconstructed Tape, Power Meters and Auction Vista, which highlights trading that is heavy compared with recent activity. It also has footprints, Market Profile, Volume Profile and Cumulative Delta charts.
Its trade management process places automated exit strategies on entry and cleans up working exit orders when you close. daytradr connects to Rithmic and Tradovate prop firm accounts as well as other platforms and data feeds; futures work on most connections, and stocks need IQFeed or Interactive Brokers.
Pricing (checked on 6 Nov 2026): daytradr Foundation is a $579 one time payment and daytradr Institutional is $1,879 one time. Live trading needs the Active Trader Package at $50 a month, and Jigsaw offers a 14-day software guarantee on the $579 purchase.
6. ATAS
ATAS has a Smart DOM module that shows limit buy and sell orders, profiles, your open orders and trades, and executed trades. You place limit orders by clicking the Bid and Ask columns and market orders with the MKT buttons, and the top panel holds account, size and exit strategy settings.
ATAS plans on monthly billing (checked on 6 Nov 2026): Start is free, Plus is €24.95 a month, Pro is €69.95 and Ultra is €89.95. Start and Plus show futures with a 15-minute delay, so real-time futures data needs Pro or Ultra. ATAS offers a refund within 14 days of your first purchase.
Platform Advantages and Drawbacks
Each DOM trading platform has its own set of strengths and limitations, making the choice highly dependent on your trading needs. Let’s take a closer look at how these platforms compare in terms of features and execution.
NinjaTrader's SuperDOM is a standout for its point-and-click order entry and extensive customization options. It offers a real-time market depth display, allowing traders to tailor their interface to their preferences. However, the platform's focus on current liquidity means it doesn’t provide historical context, which could be a limitation for traders seeking a broader market view.
Bookmap, on the other hand, takes a unique approach to DOM analysis with its heatmap visualization. This feature records and displays historical liquidity changes, offering insights that extend beyond the immediate market snapshot. Additionally, Bookmap integrates executed volume through volume bubbles and split volume profiles directly on the ladder, giving traders an edge in understanding market dynamics.
Gary Norden, a seasoned market maker and hedge fund strategist with over 35 years of experience, praises Bookmap DOM Pro for its "accuracy" and "low latency." According to Norden, the platform allows traders to "see the path of price, not just the endpoint", highlighting its reliability and depth.
The differences between these platforms become especially evident during volatile market conditions. Bookmap DOM Pro shines in these scenarios with its high refresh rates and smooth updates, capturing both market behavior and aggressive trades in real time. In contrast, traditional DOM platforms like NinjaTrader may struggle with slower updates or inconsistent performance during high-volatility periods.
Here’s a quick comparison of all six platforms (prices checked on 6 Nov 2026):
| Platform | Order Execution | Visualization Strength | Market Compatibility | Starting Price |
|---|---|---|---|---|
| NinjaTrader | Point-and-click; highly customizable; ATM strategies | Real-time market depth; focuses on current liquidity | Futures and forex | Free plan; $99/month or $1,499 lifetime |
| Bookmap | High-frequency updates; smooth execution | Historical liquidity heatmaps; volume integration | Crypto (free real-time), stocks/futures | Free (Digital); paid from $49/month |
| Quantower | Mouse Trading on the DOM Trader; drag to modify orders | DOM Trader with custom columns; cluster charts with Volume Analysis | Futures, stocks and crypto through multiple brokers | Free version; paid licences |
| Sierra Chart | Chart DOM and Trade DOM | Recent bid/ask volume and pulling/stacking columns | Futures and stocks (external feeds need an Integrated package) | $26/month; external feeds from $36/month |
| Jigsaw daytradr | Jigsaw DOM with automated exit strategies | Reconstructed tape, Auction Vista, footprints | Futures; stocks with IQFeed or Interactive Brokers | $579 one time; $50/month for live trading |
| ATAS | Smart DOM with click trading | Heatmap, footprint, Smart Tape | Futures, stocks and crypto | Free Start plan; real-time futures from €69.95/month |
Bookmap’s pricing starts with a free tier. Paid plans start with the Global package at $49 a month, or $39 a month billed yearly, which adds live futures and stock data connections.
What sets Bookmap apart is its ability to combine executed trade data with detailed liquidity dynamics, offering a comprehensive market view. This level of insight goes beyond what traditional DOMs or even Footprint charts can provide, making it a powerful tool for traders.
What Is the Best Platform for DOM Trading?
No single DOM platform is best for everyone: the right choice depends on your trading style and priorities. For traders prioritizing speed and customization, NinjaTrader's SuperDOM offers point-and-click order entry and real-time analytics. Its Order Flow+ tools, included with the Lifetime license, add volumetric bars and cumulative delta to the charts.
If visualization is your focus, Bookmap offers advanced heatmap display, offering a unique way to view market liquidity and order flow. This approach uncovers insights that traditional DOM interfaces might miss.
For those mindful of costs, Quantower offers flexible pricing and multi-asset support, making it an appealing option. Sierra Chart keeps monthly costs low, Jigsaw daytradr is built around its DOM and trade management, and ATAS pairs its Smart DOM with footprint and heatmap tools. However, choosing the right platform is just the beginning.
To translate platform features into trading success, reliable backend support is critical. Even the most advanced platform can falter without infrastructure.
Pairing platforms with high-performance data engines like Rithmic and stable VPS hosting such as QuantVPS creates an environment where every millisecond counts. When leveraging automated strategies or executing manual trades, combining the right platform with dependable infrastructure lays the groundwork for successful DOM trading.
FAQs
How do NinjaTrader, Bookmap, and Quantower differ in terms of order execution and market visualization?
NinjaTrader is well-regarded for its speed and accuracy in order execution, making it an excellent option for traders focused on scalping or high-frequency strategies. It also includes advanced tools to analyze order flow, allowing traders to make quick, informed decisions as markets move.
Bookmap is known for its heatmap visualization, which provides a detailed, real-time look at market depth and liquidity. This tool is especially valuable for traders who depend on visual data to predict market trends and movements.
Quantower shines with its support for multiple connections and highly customizable trading strategies. This flexibility allows traders to configure the platform to suit their specific needs, making it a great fit for those trading across different markets or requiring personalized setups.
What advantages does Bookmap's heatmap visualization offer for analyzing market liquidity and order flow?
Bookmap's heatmap visualization gives traders a real-time snapshot of market liquidity and order flow, making complex data easier to interpret. It uses color-coded areas to represent limit orders in the order book - red indicates high liquidity zones, while darker shades signal areas with lower liquidity. This visual approach helps pinpoint large order clusters and critical price levels at a glance.
This tool isn't just about aesthetics; it provides actionable insights. By highlighting liquidity zones and revealing market behavior, traders can better anticipate price movements. Unlike traditional charts, the heatmap delivers a clearer view of market depth, offering a practical advantage for making informed decisions.
Why is Quantower a strong choice for traders focused on DOM trading, especially in terms of market access and pricing?
Quantower is a standout choice for DOM trading, thanks to its broad market connectivity. With support for over 60 brokers, exchanges, and data feeds, it opens the door to a diverse range of markets, including futures, stocks, and cryptocurrencies. Its broker-neutral setup means you can connect to multiple brokers simultaneously, giving you the kind of flexibility and convenience that traders appreciate.
For pricing, Quantower keeps things simple. It offers an all-inclusive package that provides access to all features without the need for extra subscriptions. This no-nonsense pricing model makes it an appealing option for active traders who want advanced tools without worrying about hidden fees. With its combination of versatility, ease of use, and straightforward pricing, Quantower delivers great value and high performance for traders.


