
Quantitative trading uses math, statistics, and programming to create automated trading strategies. Unlike manual trading, it relies on data-driven rules to ensure consistency, avoid emotional decisions, and manage risks effectively. By analyzing patterns in price, volume, and market data, traders can develop and test strategies before deploying them. Tools like Python, backtesting frameworks, and statistical tests help ensure these strategies are reliable and efficient.
Key takeaways:
- Speed & Scale: Algorithms monitor and trade multiple markets in milliseconds.
- Risk Control: Predefined rules for entry, exit, and position sizing minimize losses.
- Backtesting: Simulating strategies on historical data helps validate profitability.
- Optimization: Fine-tune strategies without overfitting to historical noise.
- Live Execution: Use broker APIs to automate trades, with safeguards for errors and market changes.
Quantitative trading combines rigorous testing, coding, and real-time monitoring to build strategies that can handle market complexities. However, success requires careful validation, cost management, and ongoing adjustments to maintain performance.
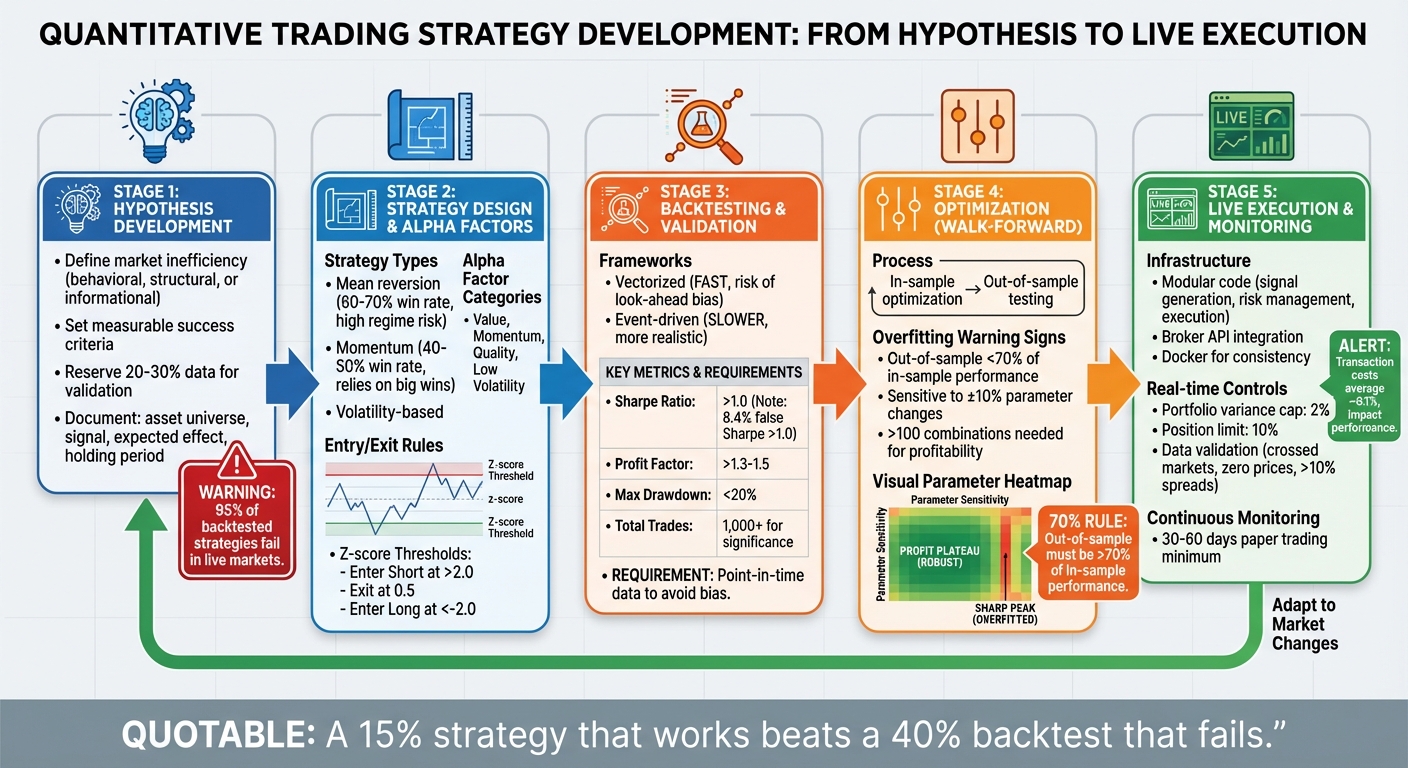
Quantitative Trading Strategy Development: From Hypothesis to Live Execution
Core Components of a Quantitative Trading System
Mathematical Models and Data Analysis
At the heart of any quantitative trading system are mathematical models. These models analyze variables like price, volume, and other market metrics to predict future movements. Coupled with data analysis, they help identify patterns, trends, and anomalies in massive datasets, revealing potential trading opportunities.
The process begins with a hypothesis that is not only testable but also grounded in economic logic. This ensures the model captures a genuine market inefficiency rather than random noise. Feature engineering plays a critical role here, transforming raw data into actionable insights. For instance, by using a z-score, which normalizes a price spread relative to its rolling mean and standard deviation, traders can pinpoint statistically significant deviations. A z-score threshold of 2.0 is often used to initiate trades, as under normal distribution, only about 5% of data points fall beyond two standard deviations.
Before deploying a model, statistical validation is crucial. Tools like the Augmented Dickey-Fuller (ADF) test verify properties such as stationarity or cointegration, ensuring the strategy holds up in live markets. Without this step, strategies might look profitable in backtests but fail when applied in real-world trading. Additionally, using point-in-time databases - which preserve historical data exactly as it existed, including information on delisted securities - helps avoid survivorship bias. This bias can falsely inflate returns by ignoring securities that no longer exist, potentially skewing results by several percentage points annually.
Once the models are validated, the next step is turning insights into actionable strategies through coding and automation.
Automation and Coding
Coding is the backbone of quantitative trading, and Python stands as the go-to language for this purpose. It offers a wealth of libraries tailored for data analysis, backtesting, and execution. For example:
- NumPy: Ideal for high-performance array operations and matrix calculations.
- Pandas: Perfect for time-series analysis, managing OHLC (Open, High, Low, Close) data, and cleaning market data.
- TA-Lib: Provides over 150 technical indicators like RSI, MACD, and Bollinger Bands.
- QuantLib: Supports advanced derivative pricing and risk management models.
- Scikit-learn: Enables machine learning models to generate predictive signals.
Backtesting is another critical step, and frameworks fall into two categories: vectorized and event-driven. Vectorized backtesting uses array operations for speed, making it suitable for initial research. However, it can be prone to look-ahead bias if not carefully managed. On the other hand, event-driven backtesting processes one event at a time, simulating live trading for more realistic outcomes. Popular libraries include:
- backtrader: Flexible for local testing.
- Zipline: A production-ready, event-driven system.
- PyAlgoTrade: Focused on intraday strategies.
- QSTrader: Designed for institutional-grade analysis.
When using vectorized backtests, it’s essential to apply a shift() operation to ensure decisions are based only on prior-period data. These tools empower traders to bring their quantitative insights to life efficiently and effectively.
Risk Management Frameworks
Even the most advanced models need robust risk management to navigate market uncertainties. Position sizing is a key component, determining how much capital to allocate per trade. Approaches like the Kelly Criterion provide a mathematical framework for this. Additionally, stop-loss rules - often based on statistical thresholds, such as z-scores above 3.5 - automatically exit trades when a spread moves excessively, protecting against faulty assumptions.
At the portfolio level, tools like Value at Risk (VaR) help cap overall exposure, ensuring no single position jeopardizes the entire system. Another effective strategy is using asymmetric exit thresholds. For example, exiting at 0.5 standard deviations instead of waiting for full mean reversion can minimize the time capital is exposed to risk. This approach is particularly useful since the final stages of price reversion are often slow and less predictable.
It’s also critical to account for transaction costs, including commissions, slippage, bid–ask spreads, and market impact. Automated trading typically incurs a commission of around 0.1% per trade. Ignoring these costs can turn a seemingly profitable strategy into a losing one. For instance, a simulation of 1,000 random strategies with no predictive power found that 8.4% achieved a Sharpe ratio above 1.0 purely by chance. Proper risk management ensures the trading system remains resilient, safeguarding gains while mitigating unforeseen risks.
Designing Quantitative Trading Strategies
Run 24/7 while you sleep. Keep bots, platforms, and trade copiers online on a dedicated VPS.
Low-latency VPS hosting for your trading platform.
From $59.99/mo
This section delves into how to transform mathematical models and risk frameworks into actionable trading strategies.
Developing a Testable Hypothesis
Every effective quantitative strategy starts with a clear, testable hypothesis. The goal is to pinpoint a real market inefficiency and understand why it exists. These inefficiencies could arise from behavioral biases (like panic selling by retail investors), structural factors (such as hedging flows by market makers), or informational delays (when earnings surprises take time to reflect in prices).
A strong hypothesis is both specific and measurable. Define the exact asset universe, the signal or factor you're analyzing (e.g., the "12‑1 momentum", which measures 12‑month returns excluding the most recent month), the expected effect, and the holding period. Establish success criteria upfront, such as "the top decile outperforms the bottom decile by 0.5% per month", to avoid justifying poor results retroactively.
"If you can't explain WHY the edge exists, it probably doesn't." – Signal Pilot Education
Before diving into coding, apply the "Market Inefficiency Test." Ask yourself if the edge stems from behavioral, structural, or informational advantages. If you can't provide a solid explanation, move on. Avoid overfitting strategies with arbitrary "magic numbers" like "RSI < 23.7." Instead, focus on robust strategies that perform across a reasonable range of parameters (e.g., RSI between 25 and 35). Document your hypothesis in detail, including its name, description, universe, signal definition, expected effect, and the rationale behind it. This approach keeps your process rooted in logic instead of data-mined noise.
Take, for example, Sarah Chen, who invested $180,000 in an RSI mean-reversion strategy on QQQ. Her backtest promised 28.4% annual returns, but she failed to reserve out-of-sample data for validation. When the strategy went live, it faced a new market regime and wiped out 79.3% of her capital. The takeaway? Always set aside 20% to 30% of your historical data for validation and avoid using it during hypothesis development or optimization.
Once you've built a solid hypothesis, the next step is selecting strategy types and identifying alpha factors.
Strategy Types and Alpha Factors
With a robust hypothesis in hand, the focus shifts to choosing a strategy type and identifying alpha factors - quantitative signals that give your strategy its edge. Common strategy types include:
- Trend-following: Capitalizing on momentum.
- Mean reversion: Betting on prices returning to their average.
- Volatility-based trading: Exploiting shifts in market uncertainty.
Each has its trade-offs. Mean-reversion strategies often boast higher win rates (60% to 70%) but are susceptible to large losses during regime changes. Momentum strategies, by contrast, usually have lower win rates (40% to 50%) but rely on occasional big wins for profitability.
Alpha factors can be grouped into categories:
- Value factors: Metrics like price-to-earnings ratios, which highlight undervalued assets.
- Momentum factors: Signals like the "12‑1 momentum rule", which isolates medium-term trends from short-term noise.
- Quality factors: Indicators such as return on equity, favoring financially stable companies that perform well over time.
- Low volatility factors: Exploiting the tendency for risk-averse investors to overprice high-beta stocks.
When combining multiple factors, use cross-sectional ranking to avoid one signal dominating the results. Test for robustness by tweaking parameters - if small changes (e.g., adjusting an RSI threshold from 30 to 28) cause significant performance drops, the strategy might be overfitted. Ideally, you want a "plateau" where a broad range of parameter combinations delivers consistent results.
Once your alpha factors are defined, you’ll need clear trading rules to implement the strategy effectively.
Rules for Entry, Exit, and Execution
Objective, well-defined rules for entering and exiting trades are crucial to maintaining discipline and avoiding emotional decisions. Entry rules should be tied directly to your quantitative signals, such as using a validated z‑score threshold to trigger trades.
Exit rules deserve equal attention. For mean-reversion strategies, consider asymmetric thresholds: enter at a higher z‑score (e.g., 2.0) for high conviction, but exit at a lower z‑score (e.g., 0.5) to lock in gains quickly while limiting risk. For trend-following strategies, volatility-based exits, like multiples of the Average True Range (ATR), can adapt dynamically to market conditions instead of relying on fixed targets.
Stop-loss rules are essential for guarding against structural breaks when assumptions fail. For example, in pairs trading, a z‑score above 3.5 might signal that the statistical relationship has broken down, requiring an immediate exit. When coding these rules, account for execution costs - commissions, slippage, bid‑ask spreads, and market impact - as these can turn a seemingly profitable strategy into a losing one.
To avoid look-ahead bias, ensure temporal integrity by using only point-in-time data available at the moment of decision. In vectorized backtests, applying a .shift() operation ensures today's trades rely solely on yesterday's data. Simpler rules often outperform complex ones because they’re easier to execute consistently and less prone to overfitting.
"A well-executed process on a simple idea will always outperform a sloppy process on a clever one." – Michael Brenndoerfer
Backtesting and Optimization
Once you've outlined your trading rules, it's time to test their effectiveness through backtesting and optimization. Backtesting allows you to simulate how your strategy would have performed in the past, while optimization fine-tunes its parameters for better results. The challenge is to use rigorous methods that avoid pitfalls like curve-fitting, which can make strategies unreliable in real-world trading.
Backtesting Methodology
A solid backtest begins with point-in-time data - data that reflects exactly what was available at any given moment in the past. This includes delisted securities and original, non-restated fundamental data. Ignoring these can lead to survivorship bias, which could artificially inflate returns by a few percentage points annually.
The framework you use for backtesting also plays a critical role:
- Vectorized backtesting: This method uses array operations for speed, making it suitable for simple strategies. However, it can be prone to look-ahead bias if data indexing isn't handled carefully.
- Event-driven backtesting: This simulates live trading by processing data one event at a time. While slower, it mirrors real trading conditions more accurately and avoids look-ahead bias by maintaining clear state.
To bridge the gap between theoretical and real-world performance, execution modeling is essential. It factors in transaction costs like commissions, slippage (e.g., 1–3 ticks for illiquid markets), and market impact. Overlooking these can drastically reduce returns. For instance, one case showed how ignoring these costs led to significant losses.
Key Metrics for Evaluation
Focusing on raw profits alone can be misleading. Instead, use risk-adjusted metrics to assess whether your returns justify the risks involved. Here are some key metrics to track:
- Sharpe Ratio: A ratio above 1.0 indicates you're earning enough return for the volatility you're taking on.
- Profit Factor: This should be greater than 1.3 to 1.5, showing that your gross profits sufficiently outweigh your losses.
- Maximum Drawdown (MDD): This measures the largest decline in account equity from a peak. Many traders prioritize MDD over net profit, as it highlights both capital preservation and psychological stress. Define your acceptable threshold upfront (e.g., less than 20%).
- Stagnation Periods: Track how long your strategy stays underwater before hitting a new equity high.
| Metric | Recommended Threshold | Purpose |
|---|---|---|
| Sharpe Ratio | > 1.0 | Gauges return relative to volatility |
| Profit Factor | > 1.3 to 1.5 | Assesses profit versus loss efficiency |
| Max Drawdown | User-defined (< 20%) | Sets limits for financial and emotional risk |
| Total Trades | 1,000+ | Ensures statistical reliability |
For meaningful results, aim for at least 100–200 trades, though 1,000+ trades is ideal for statistical significance. Small sample sizes can lead to false confidence. For example, a simulation of 1,000 random strategies found that about 84 of them (8.4%) showed a Sharpe ratio above 1.0 purely by chance.
Once you've evaluated these metrics, the next step is refining your strategy while avoiding overfitting.
Optimization Without Overfitting
Optimization should improve your strategy without falling into the trap of overfitting, where parameters are tailored so closely to historical data that they lose predictive power. A real-world example: Marcus tested over 10,000 parameter combinations for a mean-reversion strategy on SPY in March 2023. His backtest showed 32% annual returns, but he lost $18,400 (24.5%) in just three months of live trading because his parameters were overly tuned to historical noise.
Signs of overfitting include:
Stay online and closer to execution. Choose a VPS location for CME futures, New York markets, London FX, API trading, and more.
Host your platform near the market route that matters.
From $59.99/mo
- Out-of-sample performance dropping below 70% of in-sample results.
- Sensitivity to small parameter changes (e.g., ±10%).
- Requiring more than 100 parameter combinations to find profitability.
- Performance that only works in one specific market regime.
Sarah Chen learned this the hard way in January 2023. She optimized an RSI strategy on data from 2015–2022 without reserving out-of-sample data. After deploying $180,000, she lost $142,800 (79.3%) in eight months when the market regime shifted.
Walk-Forward Optimization (WFO) is one of the best defenses against overfitting. This method involves optimizing parameters on an "in-sample" window, then testing them on an "out-of-sample" window that remains untouched during development . To ensure unbiased results, reserve 20–30% of your historical data for validation and avoid using it during hypothesis development .
Tools like parameter heatmaps can help visualize results. Look for a "profit plateau" - a range of parameters that perform well - rather than a single sharp peak, which often indicates noise .
"A 15% strategy that works beats a 40% backtest that fails. The key isn't finding the perfect parameters - it's building something robust enough to survive real markets." – Marcus, Algorithmic Trader
To further stress-test your strategy:
- Double your cost estimates. If your strategy becomes unprofitable, it's too sensitive to real-world conditions.
- Run Monte Carlo simulations by randomizing trade order 10,000 times to confirm that drawdown statistics aren't just a fluke.
- Apply the 70% Rule: Only deploy strategies where out-of-sample Sharpe ratios reach at least 70% of in-sample results.
Keep in mind, over 90% of strategies that seem profitable in backtests fail when applied to live trading. Building a strategy that can withstand the unpredictable nature of real markets is far more important than chasing perfect backtest results.
Implementing and Monitoring Quantitative Strategies
Once backtesting is complete, it’s time to bring your strategy to life in the markets. This requires solid infrastructure, real-time tracking, and the ability to adjust as needed.
Broker API Integration and Execution
To move your strategy from a Jupyter Notebook into production, transform your code into standalone Python modules, such as decide_trade() or create_trading_universe(), so they can run independently.
A modular setup is key here. By separating components like signal generation, risk management, order execution, and state tracking, you minimize the risk of one issue - like an order routing error - causing a chain reaction that disrupts your entire strategy.
When connecting to brokers, you’ve got three main options:
- Direct exchange feeds: These offer the lowest latency but require co-location and custom data parsing.
- Consolidated feeds: These aggregate data from multiple exchanges, such as the US Securities Information Processor.
- Vendor APIs: Easier to implement options like Interactive Brokers or Bloomberg APIs, though they introduce more latency and are better suited for intraday or end-of-day strategies.
Using Docker can help maintain a consistent environment between backtesting and live execution. It ensures that dependencies and environment variables remain secure and aligned. Keep trade history stored in dedicated objects rather than global variables to avoid unexpected behavior during system restarts.
Before going live, implement safeguards. For instance, pause trading if your data feed fails or risk calculations stop functioning, especially when data becomes stale. Validate market data in real time by flagging anomalies like crossed markets (where the bid price equals or exceeds the ask price), zero or negative prices, or spreads that exceed 10%. Always conduct a paper trading phase to uncover potential issues like API latency or errors in execution that backtesting might not reveal.
Real-Time Monitoring and Risk Controls
Once your system is live, continuous monitoring and risk management become the focus. Event-driven notifications are invaluable for staying updated on order statuses, trade completions, and changes in portfolio or account balances. Use methods such as notify_store or notify_data to track data feed health and broker connectivity, ensuring everything stays in sync.
A real-time risk manager is essential. It should enforce strict limits, like a maximum portfolio variance of 2% or a cap of 10% per individual position. These measures help prevent significant losses during unexpected market swings.
Performance attribution is another critical tool. It helps distinguish whether returns come from your strategy’s edge (alpha) or broader market factors. Regularly calculate factor loadings to identify whether underperformance stems from a fading edge or temporary shifts in market conditions. Keep a close eye on both direct costs (like commissions and exchange fees) and indirect costs (such as bid-ask spreads and market impact), as overlooking these can cause strategies to fail in live markets.
For large orders, use an execution engine to break them into smaller child orders. This minimizes market impact, especially if the order exceeds 10% of the Average Daily Volume (ADV). Routine health checks - like those conducted 15 minutes after the market opens - can help ensure your strategy is performing as expected during critical periods.
Adapting to Market Changes
Markets evolve, and so must your strategy. Any adjustments should be based on sound economic reasoning rather than purely statistical patterns. Clearly define the asset universe, expected effect size, and conditions under which your signal should either strengthen or weaken.
Walk-forward analysis is a helpful tool to confirm that your strategy works in future market conditions. When tweaking parameters, strike a balance: shorter lookback windows (like 63 days) respond quickly to market changes but can be noisy, while longer windows (such as 252 days) offer more stability.
To make your strategy resilient to outliers, normalize signals by converting them into cross-sectional percentile ranks. This prevents signals with extreme values from dominating your optimizer. Before rolling out any changes, automate data checks to catch issues like missing values, extreme outliers, or stale prices. Use point-in-time databases that include delisted securities and original economic indicators to avoid survivorship bias and look-ahead bias.
Finally, rigorous out-of-sample validation is essential. Testing your strategy on data it hasn’t seen before helps separate genuine predictive power from mere historical coincidences.
Conclusion
Quantitative trading replaces gut instincts with data-driven precision, but success hinges on sticking to a structured approach. A disciplined research process - starting with hypothesis creation and moving through backtesting, validation, and deployment - acts as a safeguard, ensuring only well-vetted strategies are put into action. Without this framework, traders risk falling for "beautiful but meaningless" equity curves shaped by pitfalls like look-ahead bias, survivorship bias, and overfitting.
The numbers paint a stark picture: about 95% of backtested strategies fail in live markets. For example, one simulation of 1,000 random strategies without any real edge showed the "top performer" achieving a Sharpe ratio of 2.367 purely by chance. This highlights how easily statistical noise can be mistaken for genuine alpha. That’s why techniques like out-of-sample testing, walk-forward optimization, and realistic cost modeling are non-negotiable - they separate strategies that can thrive in live markets from those that crumble under real-world conditions.
"A 15% strategy that works beats a 40% backtest that fails. The key isn't finding the perfect parameters - it's building something robust enough to survive real markets." - Marcus, Algorithmic Trader
The essence of quantitative trading lies in creating features grounded in economic logic, validating them rigorously, and executing with a sharp focus on costs and risk. A simple idea, executed with a solid process, will always outperform a clever idea handled poorly. Before committing real capital, every strategy should clear critical hurdles: out-of-sample testing, realistic cost modeling, multi-instrument testing, and at least 30–60 days of paper trading.
Markets are always changing, and your strategies must evolve with them. Continuous monitoring, real-time risk controls, and periodic re-optimization are essential to maintaining your edge. The traders who succeed over the long haul aren’t those chasing perfect backtests - they're the ones building resilient systems grounded in sound economic principles and executed with disciplined risk management.
FAQs
How do I know my trading “edge” is real?
To ensure your trading "edge" is legitimate, it's crucial to validate your strategy through thorough testing methods. Techniques like out-of-sample testing, walk-forward analysis, and comparing results against baseline strategies can help gauge its effectiveness. Be cautious of overfitting by dividing your data into separate training and testing sets, re-optimizing your strategy periodically, and factoring in transaction costs. A real edge isn't just about backtest success - it must demonstrate consistent performance in live markets under realistic trading conditions.
What’s the best way to avoid overfitting in optimization?
To prevent overfitting during optimization, it's crucial to use methods like cross-validation. This ensures your models can handle unseen data effectively, rather than just excelling with the data they were trained on. Think of each backtest as a hypothesis test - this mindset helps you avoid mistaking random noise for meaningful patterns.
Moreover, applying robustness checks is key. For example, using a "Vs. Random" test can help verify that your strategy's performance isn't just a stroke of luck. These practices are essential for building trading models that are both dependable and effective in real-world scenarios.
How should I model slippage and trading costs in backtests?
To make backtests more realistic, account for market impact, bid-ask spread, and transaction fees. Slippage should be modeled as a function of variables like market volatility, trading volume, and spreads, reflecting how these factors influence execution prices. Additionally, factor in transaction costs, such as commissions or fees, either as fixed amounts or percentages tied to trade size. These adjustments help create a more accurate simulation of actual trading conditions.


