
If MarketSmith's $149.95/month price tag feels steep, you're not alone. Many traders are exploring other platforms that offer strong stock screening tools at lower costs. Here's a quick rundown of the best alternatives, tailored to different trading styles:
- FINVIZ: Great for U.S. market traders who value visual tools like heat maps and automated chart pattern recognition. Free and Elite plans available (starting at $39.50/month).
- Stock Rover: Ideal for long-term investors with over 700 metrics and advanced portfolio tracking. Plans start at $79.99/year.
- TradingView: Perfect for global traders needing interactive charts and international market access. Free and paid plans start at $14.95/month.
- Trade Ideas: Designed for day traders with AI-powered tools like Holly AI for real-time alerts. Pricing starts at $127/month.
- StockFetcher: A free platform for technical traders who want precise, text-based filters.
- GuruFocus: Best for value investors with deep fundamental analysis tools and institutional tracking, starting at $549/year.
- Barchart Premier: Combines technical screening and options analytics, starting at $19.95/month.
- EarningSpike: Focused on CANSLIM investors tracking earnings acceleration and institutional sponsorship. Free access to key data.
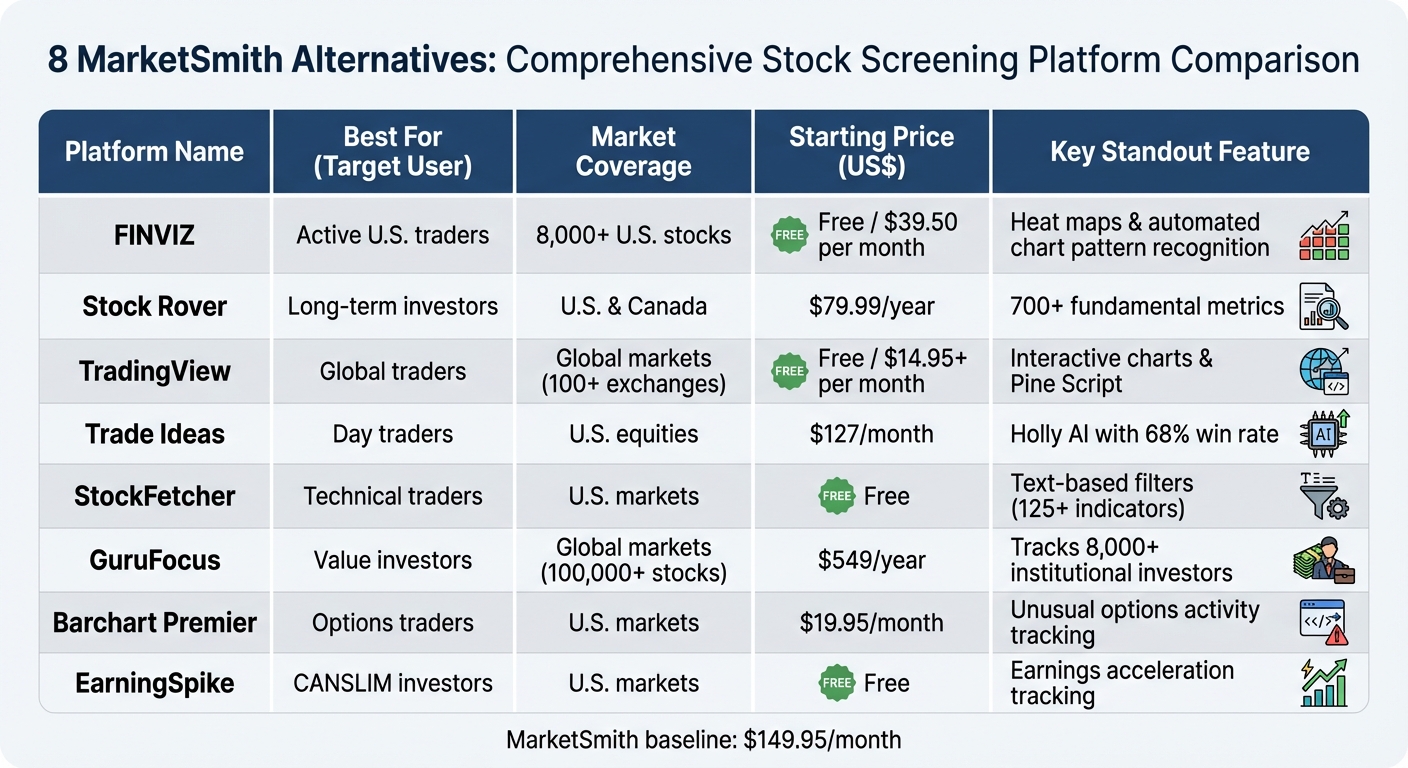
Quick Comparison
| Platform | Best For | Coverage | Key Features | Price (US$) |
|---|---|---|---|---|
| FINVIZ | Active U.S. traders | 8,000+ U.S. stocks | Heat maps, real-time data (Elite) | Free/$39.50 per month |
| Stock Rover | Long-term investors | U.S. & Canada | 700+ metrics, ranked screening | $79.99–$279.99 per year |
| TradingView | Global traders | Global markets | Interactive charts, Pine Script | Free/$14.95+ per month |
| Trade Ideas | Day traders | U.S. equities | AI alerts, backtesting, auto-trading | $127–$254 per month |
| StockFetcher | Technical traders | U.S. markets | Text-based filters, candlestick patterns | Free |
| GuruFocus | Value investors | Global markets | DCF models, guru tracking | $549–$2,448 per year |
| Barchart | Options traders | U.S. markets | Options flow, custom screeners | $19.95–$29.95 per month |
| EarningSpike | CANSLIM investors | U.S. markets | Earnings acceleration, free data | Free |
Each platform offers unique tools and pricing, making it easier to find one that fits your budget and trading style, or explore stocks prop firm coupon codes to save on trading challenges.
MarketSmith Alternatives Comparison: Features, Pricing, and Best Use Cases
1. FINVIZ
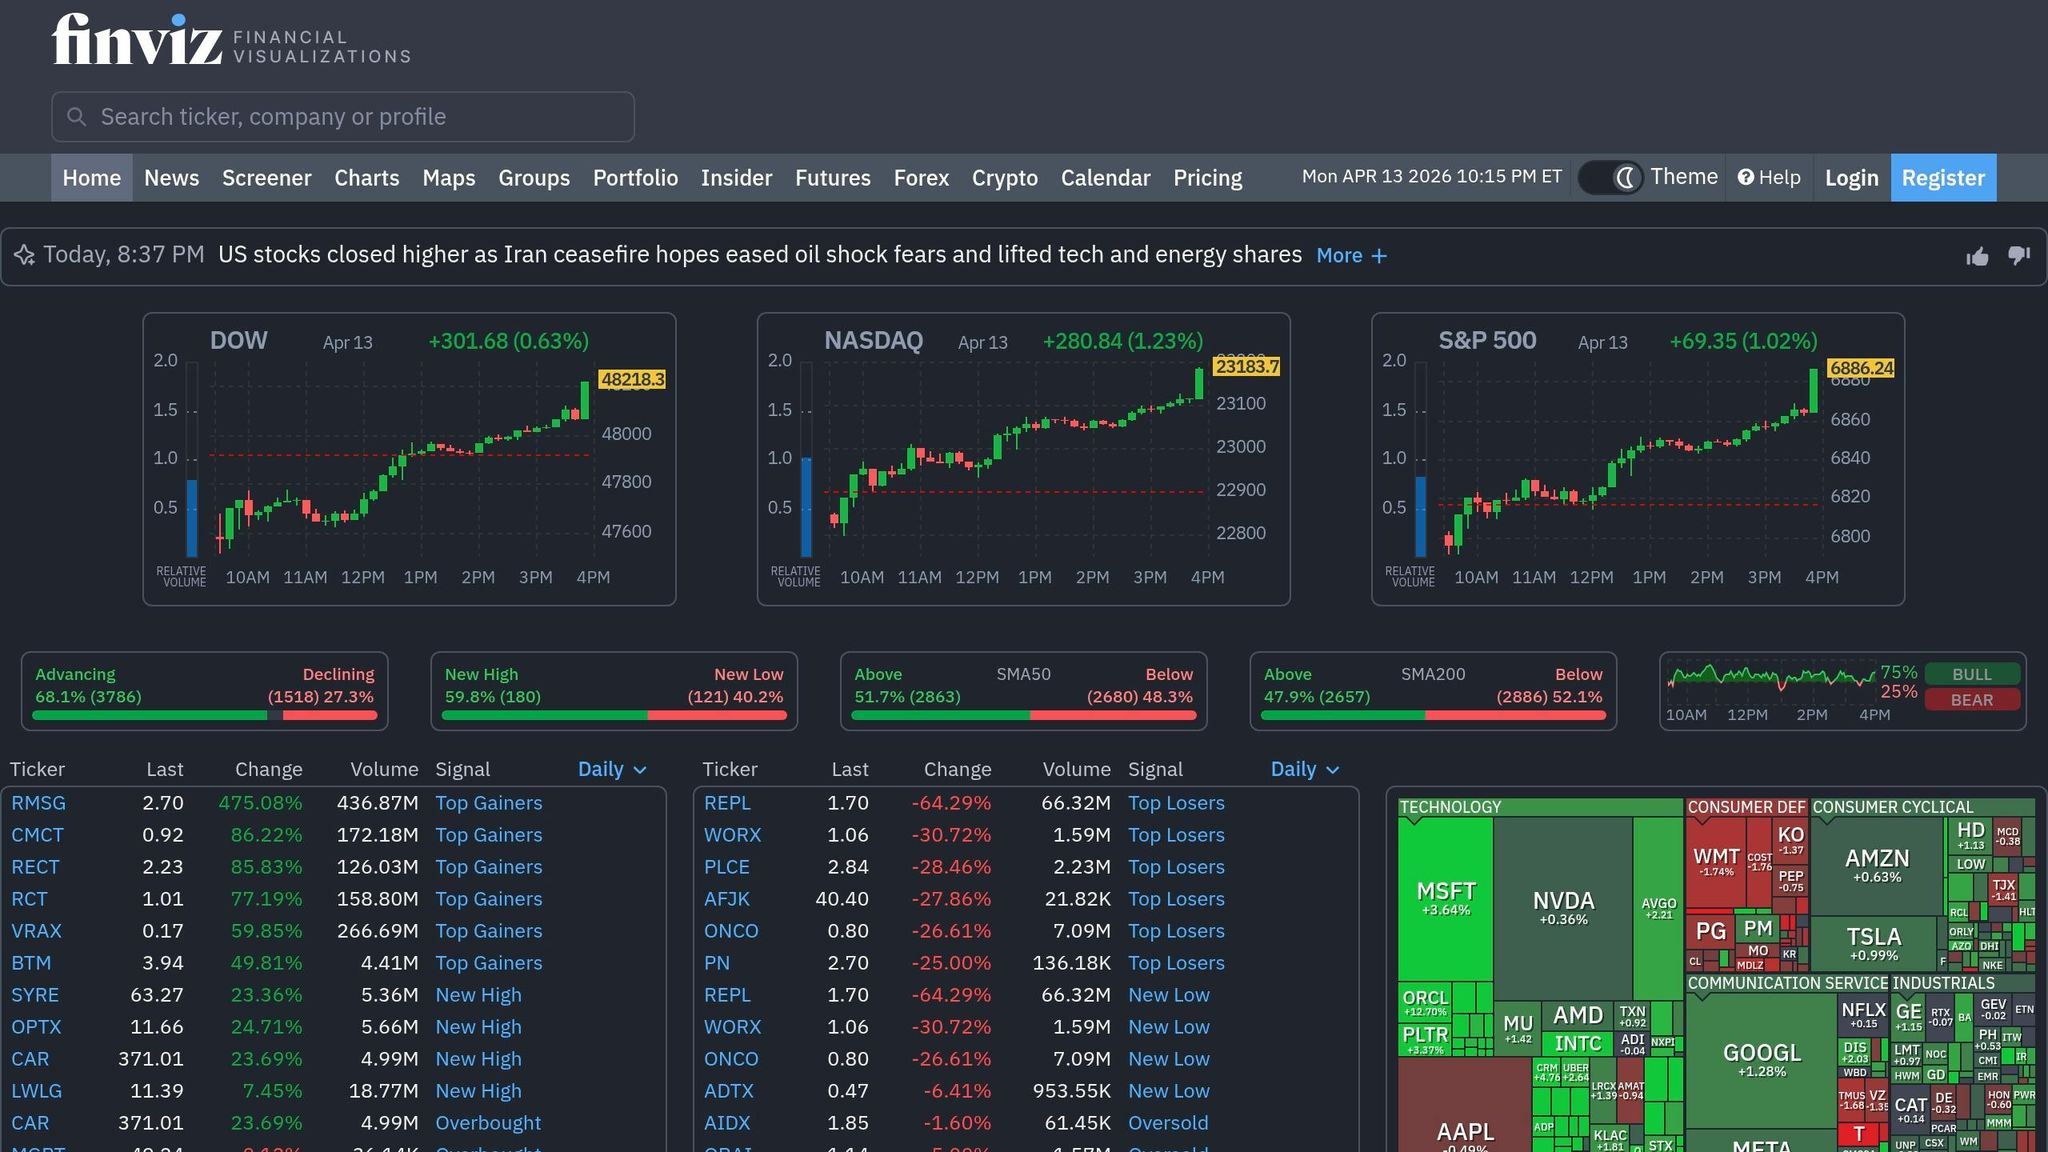
FINVIZ takes the complexity of market data and turns it into easy-to-read, color-coded heat maps that provide a quick overview of sector performance. The platform monitors over 8,000 U.S. stocks and offers more than 70 filters, covering everything from descriptive details like market cap and sector to fundamental metrics like P/E ratios and ROE, as well as technical signals such as RSI and moving averages. Additionally, it automatically spots chart patterns like wedges, triangles, and head-and-shoulders formations, saving users from the hassle of manual analysis.
Features
Each stock's page is packed with information, including fundamental data, technical indicators, analyst ratings, and the latest news headlines. Hover-over thumbnails make accessing charts effortless. For those who opt for the Elite subscription, extra perks include real-time insider trading data and the ability to backtest trading strategies using up to 20 years of historical data.
"The Finviz stock screener is one of the most effective screeners I've ever used in the way it balances the number of possible screeners while maintaining ease-of-use." – David Rodeck, Financial Writer, StockBrokers.com
Pricing (US$)
FINVIZ offers a free version that includes all 70+ filters, but it comes with a 15–20 minute data delay and ads. The Elite plan, priced at $39.50 per month or $299.50 annually, removes these limitations. Elite users enjoy real-time quotes, extended market hours (4 AM–8 PM), unlimited email alerts, and access to 8 years of financial statement history (compared to 3 years on the free plan). The subscription also allows tracking of up to 100 portfolios with 500 tickers each. Plus, there's a 30-day money-back guarantee for Elite subscribers.
Screening Capabilities
FINVIZ is particularly strong in momentum and technical screening. For example, in February 2026, traders used its heat maps to navigate a sector rotation where Energy gained 19.1%, Materials rose 13.6%, and Technology dropped 2.0%. Standout performances included Southwest Airlines (LUV) at +31%, Old Dominion Freight Line (ODFL) at +29%, and FedEx (FDX) at +28%. The platform's preset screens, like "Top Gainers", "New High", and "Unusual Volume", make it easy for traders to identify momentum opportunities quickly. This efficiency makes FINVIZ a go-to tool for active traders.
Best Use Case
FINVIZ is best suited for active and swing traders who focus on U.S. markets and need fast, intuitive tools to identify trading setups. StockBrokers.com gave it a 4.5/5 rating, calling it "Best for Day Trading Scanners" due to its quick filtering and visual heat maps. Investopedia also named it "Best for Swing Traders" for its ability to highlight market trends and turning points. However, since it only covers U.S. equities (NYSE, NASDAQ, AMEX), it may not meet the needs of those looking for international market access.
2. Stock Rover
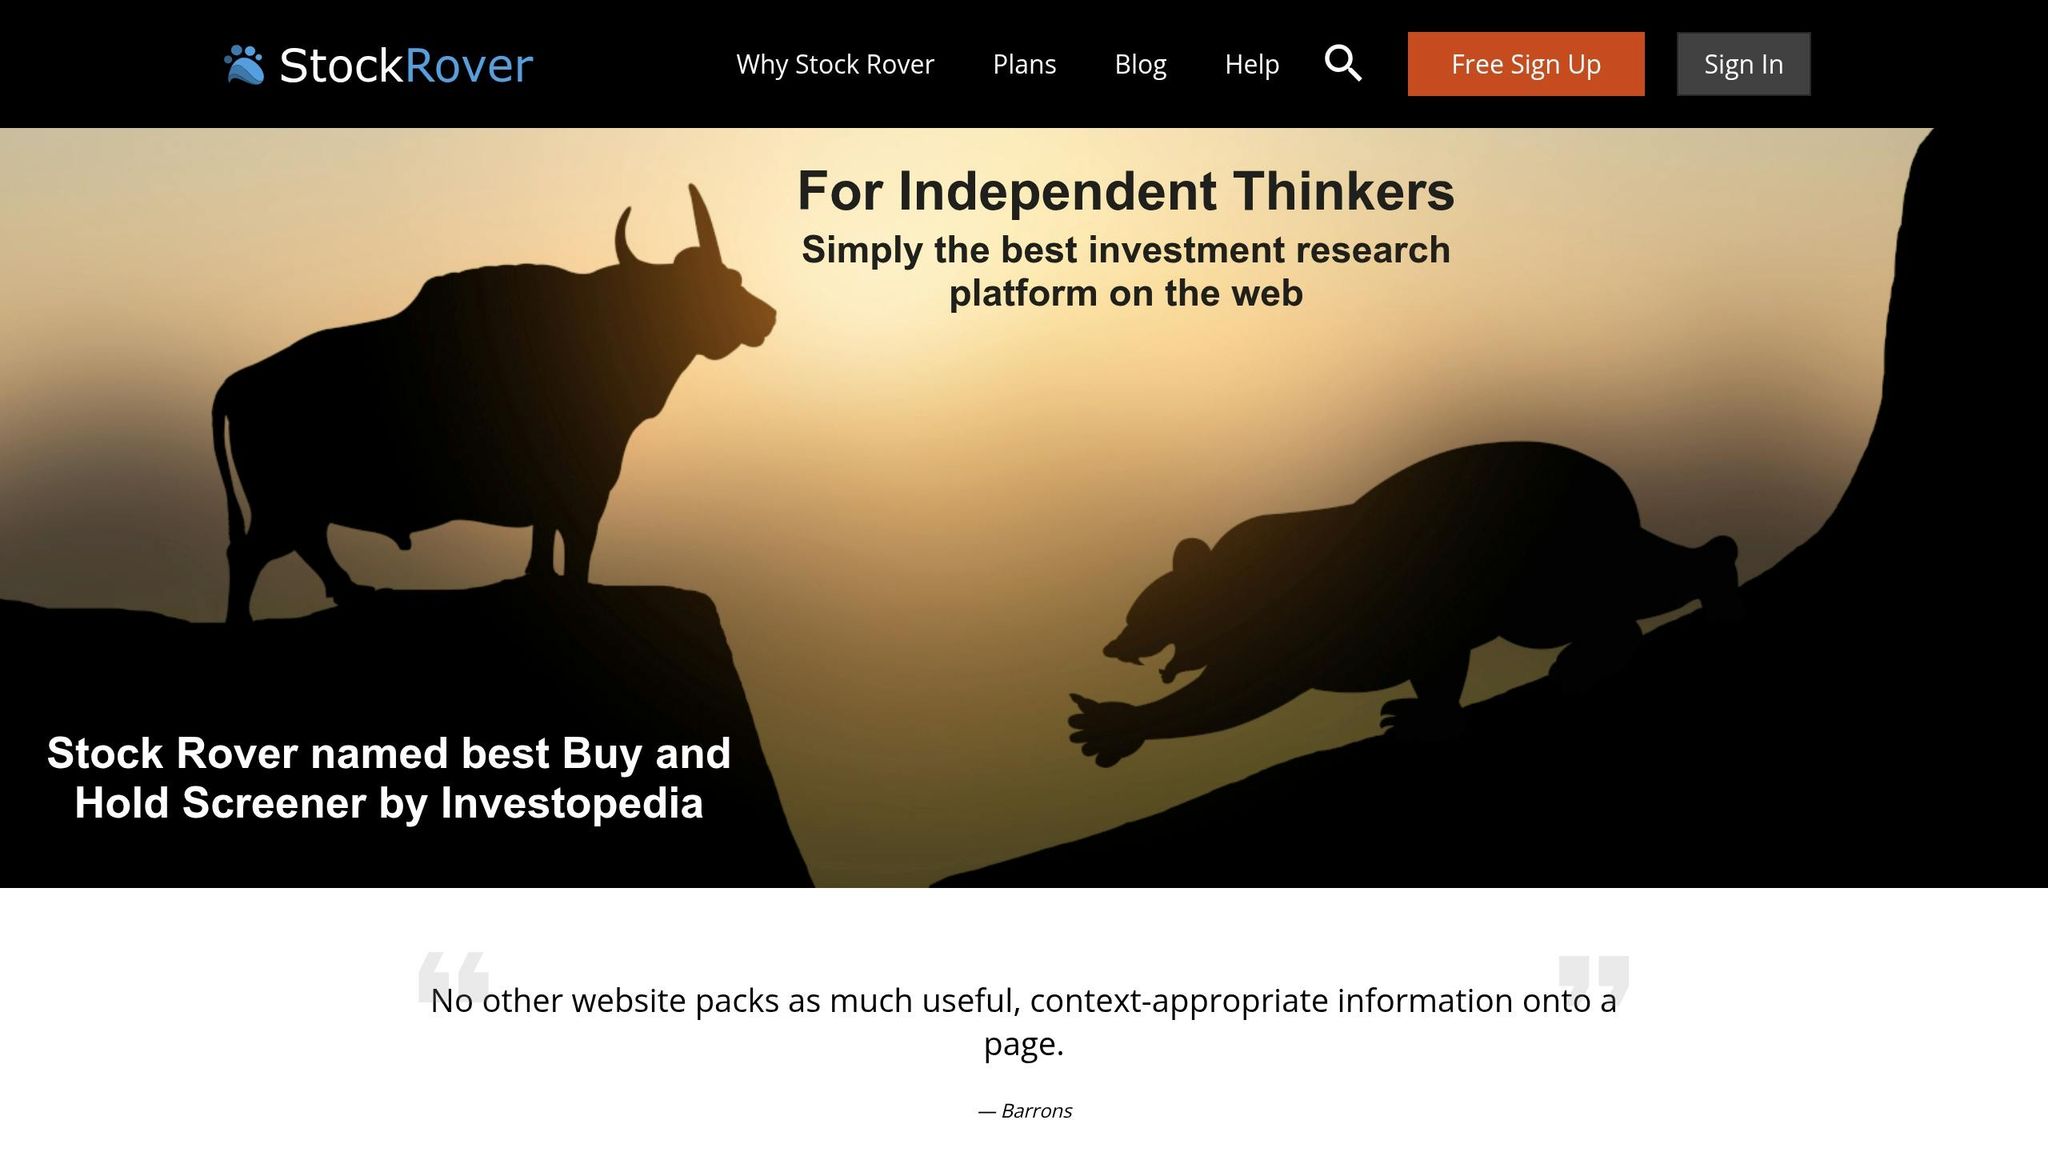
Stock Rover offers a powerful, cost-effective platform for investors, delivering institutional-level screening tools with over 700 metrics. Its standout feature is the ability to create equation-based screens using custom mathematical expressions, such as "ROE > 5-year average ROE + 3%." This allows for more precise filtering compared to standard pass/fail methods. Covering about 8,500 North American stocks, 4,000 ETFs, and 40,000 mutual funds, the platform also provides up to 10 years of historical data for backtesting and trend analysis.
Features
Stock Rover’s ranked screening system prioritizes results based on weighted criteria, ensuring the most relevant matches appear at the top [18,19]. The Insight Panel consolidates key information like analyst ratings, financial data, peer comparisons, and news into a single, user-friendly view. For portfolio management, it connects to over 1,000 financial institutions, including Fidelity, Schwab, and Robinhood, enabling real-time tracking of investment performance. Advanced tools like Monte Carlo simulations and correlation matrices further enhance its analytics capabilities.
"Stock Rover stands out for offering over 700 different metrics, enabling investors to dive far deeper in sorting trade opportunities, all at a competitive price."
– David Rodeck, Financial Writer, StockBrokers.com
These features are complemented by a flexible pricing model, making it accessible for a range of investor needs.
Pricing (US$)
| Plan | Annual Price | Key Features |
|---|---|---|
| Free | $0 | Basic metrics, market news, limited charting, ad-supported |
| Essentials | $79.99 | 275+ metrics, 5-year history, ad-free, basic screening |
| Premium | $179.99 | 375+ metrics, 10-year history, ranked screening, portfolio analytics |
| Premium Plus | $279.99 | 700+ metrics, custom equations, fair value estimates, priority support |
For most serious investors, the Premium plan at $179.99 per year is highly recommended. It unlocks ranked screening and provides access to 10 years of historical data - features that meet the needs of roughly 90% of users. A 14-day free trial is also available, requiring no credit card.
Screening Capabilities
With over 140 pre-built screeners based on popular strategies like value investing and dividend growth, Stock Rover caters to a variety of investment approaches. Users can also build custom screens or, for Premium Plus subscribers, write freeform equations to filter for specific conditions, such as "Current EPS > EPS 1 year ago." Additionally, the platform includes built-in metrics for guru strategies like the Piotroski F-Score, Benjamin Graham’s Graham Number, and Joel Greenblatt’s Magic Formula.
Best Use Case
Named the "Best Buy and Hold Screener" by Investopedia and rated 4.0/5 by StockBrokers.com [20,21], Stock Rover is perfect for self-directed investors focused on fundamental analysis, dividend growth, or long-term portfolio management. It’s ideal for those who prefer conducting their own research instead of relying on automated stock picks. However, the platform is limited to North American exchanges (NYSE, NASDAQ, TSX) and does not have a dedicated mobile app - though its mobile-responsive website helps bridge this gap. While beginners might face a learning curve, the Investor’s Library and on-screen help icons make the transition smoother [18,23].
Run 24/7 while you sleep. Keep bots, platforms, and trade copiers online on a dedicated VPS.
Low-latency VPS hosting for your trading platform.
From $59.99/mo
3. TradingView
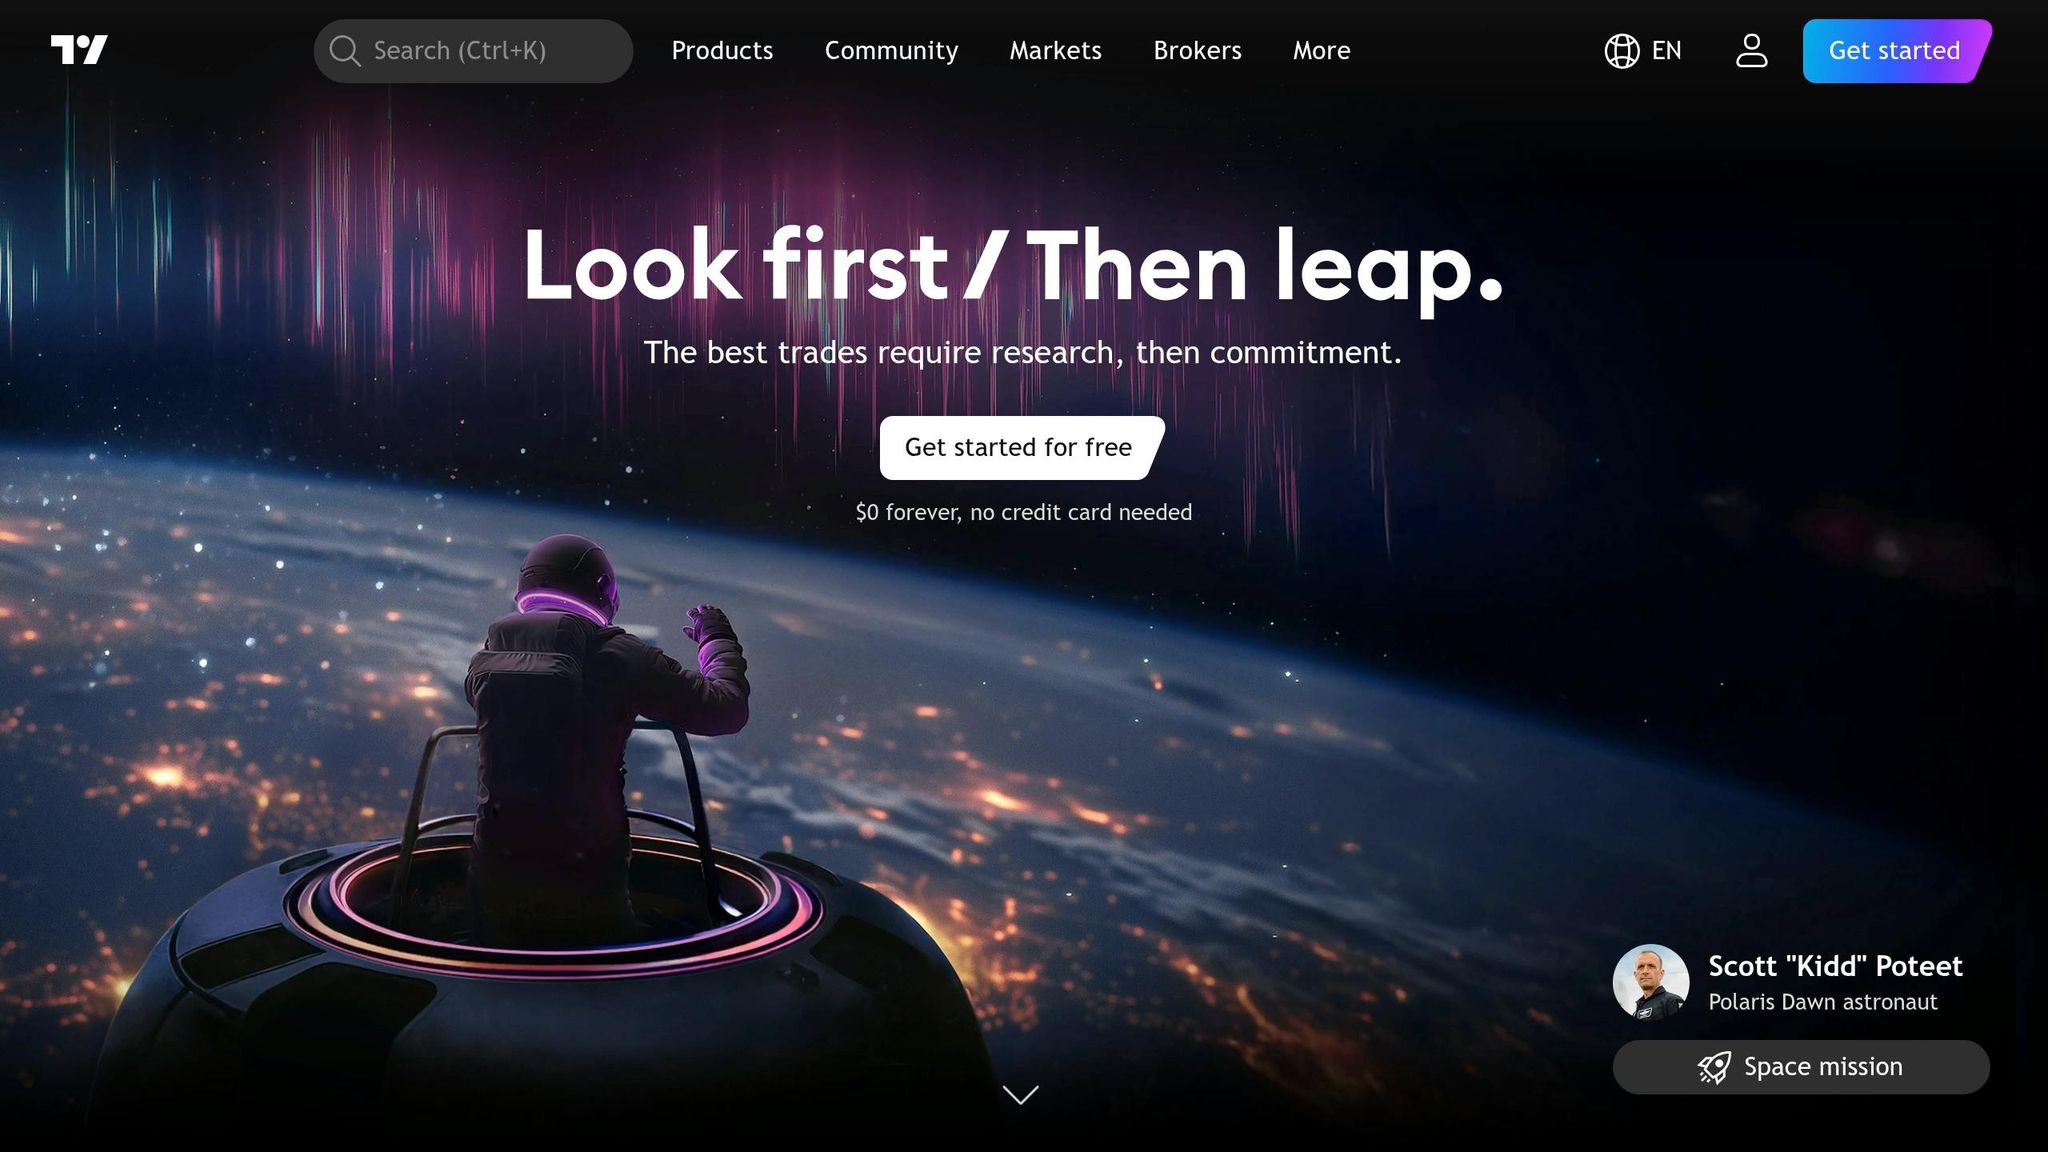
TradingView has built a strong reputation as a top stock screener by offering a practical free tier, seamless charting tools, and extensive global market coverage. With a community of 100 million traders and investors, it eliminates the hassle of switching between separate screening and charting platforms. When you select a screening result, you’re instantly presented with a fully interactive chart featuring over 100 technical indicators.
The platform is tailored for traders who need integrated tools and access to markets worldwide for efficient stock analysis.
Features
TradingView provides coverage for NYSE, Nasdaq, AMEX, and select European and Asian markets - all without requiring extra subscriptions. Beyond stocks, it also includes screeners for ETFs, bonds, and cryptocurrencies, spanning both centralized and decentralized exchanges. Its proprietary Pine Script language allows users to create custom indicators, backtests, and strategies, while the Pine Screener lets traders scan assets using personalized logic [29,31]. For quicker visual analysis, the "chart view" feature displays screening results as a grid of live charts.
"TradingView ranked highly in our overall research, and stands out for its broad screening access, covering all major exchanges, global currency pairs, worldwide indexes, crypto exchanges, and more." – Investopedia
Additionally, the platform offers a range of key metrics, including P/E ratio, EPS growth, revenue growth, RSI, MACD, moving averages, and volume surge detection, catering to diverse trading and investment strategies.
Pricing (US$)
| Plan | Monthly Price | Key Features |
|---|---|---|
| Free | $0 | Basic screening, 1 indicator per chart, global market access, ads |
| Essential | $14.95 | More indicators, ad-free experience, basic alerts |
| Plus | $29.95 | Advanced alerts, multiple chart layouts |
| Premium | $59.95 | Maximum indicators, priority support, extended hours data |
Real-time data often requires an additional subscription, typically around $14.99 per month for specific exchanges. The free tier is robust enough for most swing traders and long-term investors, while the paid plans are better suited for active day traders.
Screening Capabilities
TradingView offers over 100 fundamental and technical filters, covering timeframes from 1 minute to 1 month. For instance, filtering for stocks with relative volume above 2× the average can help identify opportunities tied to earnings surprises or breaking news. Using three to five filters is recommended to keep results actionable.
Best Use Case
With impressive ratings of 4.9/5 on the App Store (nearly 300,000 reviews) and 4.7/5 on Google Play (over 718,000 reviews), TradingView is ideal for swing traders, long-term investors, and those trading internationally. While the mobile app lacks a built-in screener and requires a browser, its seamless chart integration makes it a great choice for traders seeking an all-in-one solution.
4. Trade Ideas
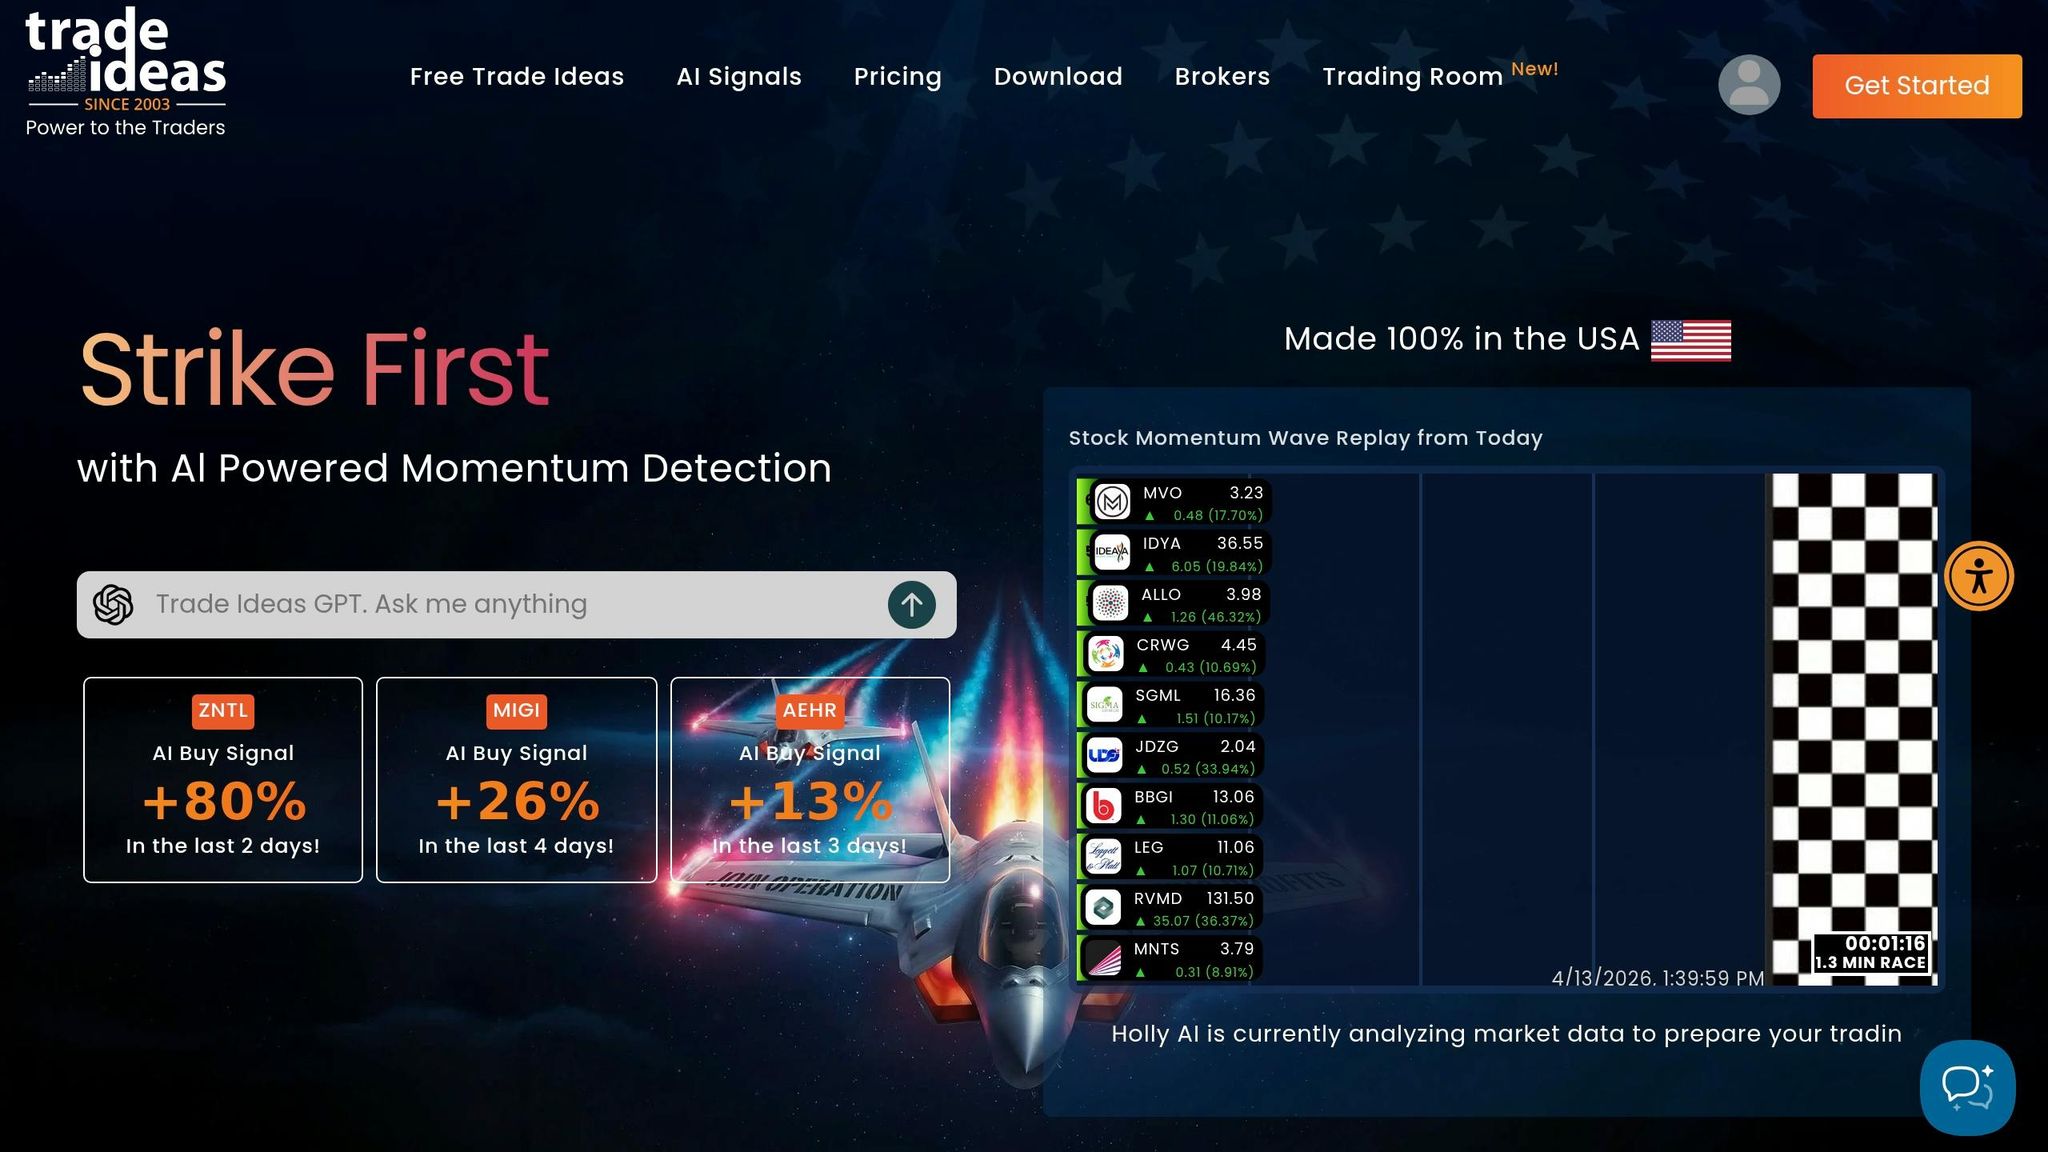
Trade Ideas is a powerful real-time scanning tool designed with active day traders in mind. It provides instant alerts and AI-driven signals, eliminating the need for manual refreshing. For instance, traders are notified immediately when a stock crosses VWAP or breaks resistance. Since its launch in 2003, Trade Ideas has received recognition, including "Best for Day Trading" and "Best for Live Trading Ideas" by Investopedia.
One of its standout features is Holly AI, a virtual trade assistant that analyzes technical patterns in under a second. Holly delivers precise entry and exit signals based on 50 different strategies. What makes it even more effective is its ability to optimize itself nightly, processing millions of scenarios and adjusting parameters based on the previous day’s market behavior. This AI-driven approach sets Trade Ideas apart from traditional screeners.
Features
Trade Ideas monitors over 8,000 U.S. stocks simultaneously using more than 500 filters and alert types. A few of its key features include:
- Stock Race: A real-time, visual tool for comparing stocks to identify momentum.
- Brokerage Plus: Allows one-click or automated trade execution with brokers like Interactive Brokers, E*TRADE, and TradeStation.
"Trade Ideas is the best screener for day traders because its AI-based algorithm allows hundreds of criteria to be analyzed at exceptional speed." – Investopedia
The platform also includes the OddMaker tool, which lets traders backtest and evaluate their scanning criteria and entry signals. Additionally, it offers a live trading room, open from 8:00 a.m. to 3:30 p.m. ET, where experts share strategies and insights.
Pricing (US$)
Trade Ideas offers a tiered pricing structure to match its comprehensive features:
| Plan | Monthly Price | Annual Price (Effective Monthly) | Key Features |
|---|---|---|---|
| Par Plan | $0 | $0 | Delayed data, Stock Racing, PiP Charts, predefined alerts |
| TI Basic | $127 | $89 | Real-time data, 10 charts per screen, Brokerage Plus, access to a demo account |
| TI Premium | $254 | $178 | Holly AI, Money Machine, backtesting, 20 charts, auto-trading |
Subscriptions include all U.S. exchange market data fees, saving users $40–$60 per month compared to platforms that charge separately. Optional add-ons like AVWAP ($49/month) and Weekly Swing Picks ($17/month) are also available.
Screening Capabilities
Trade Ideas provides advanced screening tools like:
- Top List Windows: Dynamically rank stocks by factors such as unusual options activity, largest gaps, or widest ranges.
- Compare Count Windows: Contrast bullish versus bearish trends (e.g., new highs versus new lows) to gauge market sentiment.
Backtesting Holly AI signals has shown a 68% win rate, outperforming manual pattern recognition, which typically achieves 52–58%.
"What sets Trade Ideas apart is its use of machine learning to optimize strategies at the end of each trading day. It analyzes new market data, updates its backtesting, and adjusts parameters to adapt to changing conditions." – Steven Hatzakis, Global Director of Online Broker Research, StockBrokers.com
However, the platform focuses exclusively on U.S. equities (Nasdaq, NYSE, OTC) and does not support international markets, cryptocurrencies, or futures.
Best Use Case
Trade Ideas is particularly suited for high-volume day traders executing 10 or more trades per week. Its real-time scanning and AI-driven signals provide actionable insights that cater to fast-paced trading environments. The most advanced features, such as Holly AI, backtesting, and the Money Machine, are available only on the desktop version. Windows users can fully access the desktop platform, while Mac users need virtualization solutions like Parallels or AWS.
Although the desktop interface may feel slightly dated and come with a learning curve, its speed and AI optimization justify the investment. Beginners can explore the free Par Plan to familiarize themselves with Stock Race visualizations and pre-built templates before upgrading to a paid plan.
5. StockFetcher
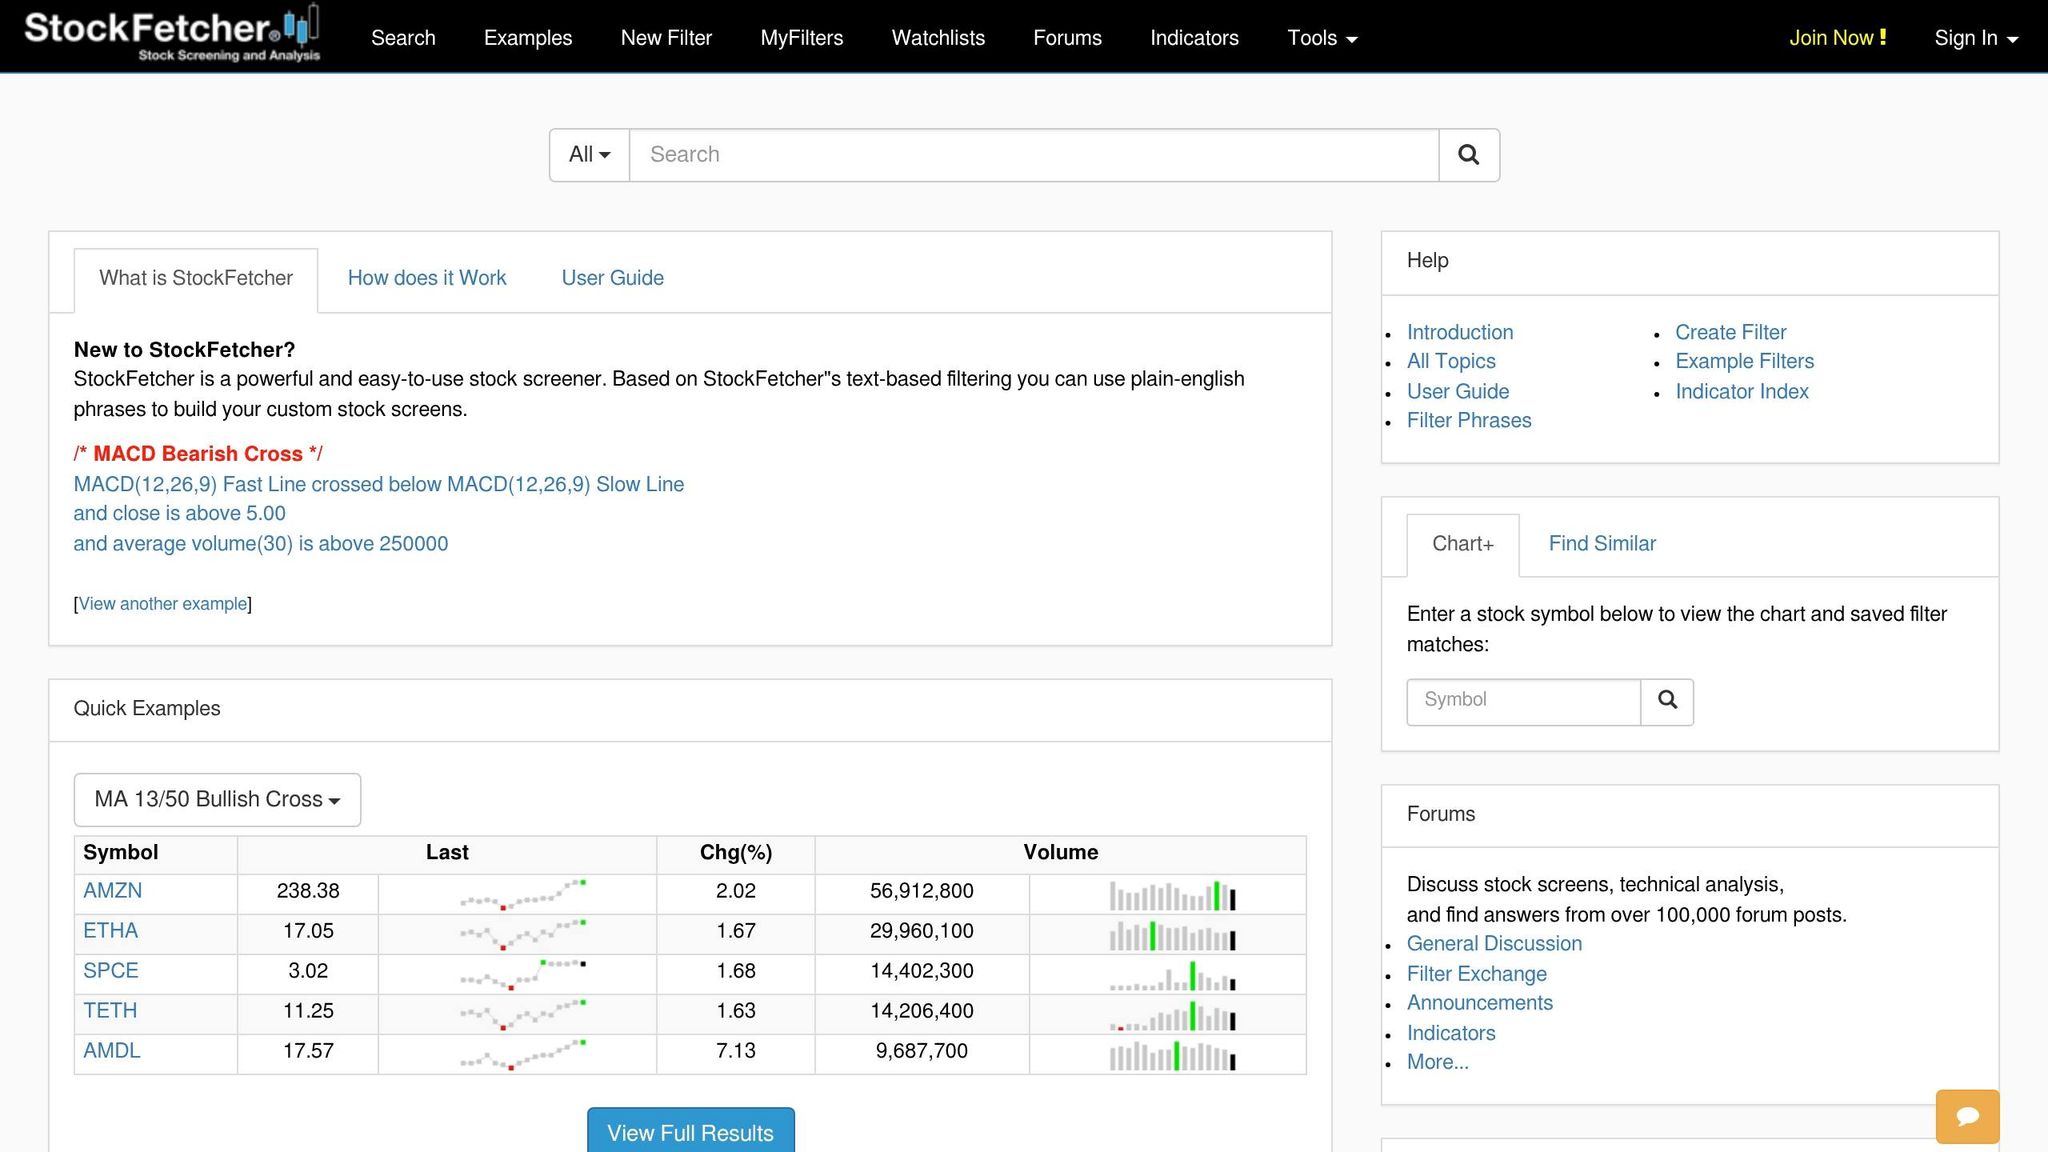
StockFetcher stands out with its text-based filtering system, allowing users to type commands in plain English to create custom stock screens. Instead of relying on drop-down menus like many other platforms, this approach gives advanced traders more precise control. For example, users can input commands like "Show stocks where RSI crossed above 30" or "MACD is above 0" to define their technical criteria. This makes the platform particularly appealing to traders who prefer crafting tailored screening commands.
The platform supports over 125 technical indicators, including popular ones like MACD, Bollinger Bands, and RSI. It also recognizes candlestick patterns such as Hammer, Doji, and Engulfing. With commands like "crossed above", "near", or "increasing for the last 5 days", users can create highly specific filters. For instance, traders can search for setups like the Golden Cross (when the 50-day moving average crosses above the 200-day moving average) or identify stocks with volume spikes of up to 500% [46,48]. These features are further complemented by a range of user-friendly tools.
Features
StockFetcher offers a variety of tools to enhance the user experience:
- "Find Similar" Tool: This feature identifies stocks with price patterns similar to a given symbol.
- Community Forum: With over 100,000 posts, the forum provides a space for traders to share insights and strategies.
- Comprehensive User Guide: Available in PDF and ZIP formats, this guide helps users master the platform's screening language.
- Pre-Built Templates: Templates such as "Quick Picks" and "Popular Examples" cover setups like 52-week highs, Death Crosses, and candlestick patterns.
- Filter Exchange: Experienced traders can share custom screens, making it easier for others to explore advanced setups.
- Sector and Industry Filters: Users can refine their searches by sector and industry or filter for optionable versus non-optionable stocks.
- Time-Specific Commands: Commands like "Days Since" allow users to find stocks that met certain criteria at specific times.
Pricing (US$)
StockFetcher is widely regarded as one of the top free stock screeners available as of 2026. Its powerful screening tools come at no cost, making it accessible to traders at all levels.
Screening Capabilities
StockFetcher delivers an impressive range of screening tools that can compete with premium platforms. It allows users to perform comparative relative strength analysis, identifying stocks that outperform or underperform benchmarks like the S&P 500. The platform also supports momentum indicators, enabling traders to screen for consecutive up or down days, price gaps, and volume trends.
For those who need more complex filters, StockFetcher accommodates multi-parameter searches by combining criteria - such as price, volume, and technical setups - using "and" constructs. It covers stocks, sectors, and industries while offering pattern recognition for formations like Cup and Handle, Double Bottom, and various triangle patterns. Additionally, traders can identify new 52-week highs and lows, percentage price changes, and correlations with major indices [46,48].
Best Use Case
StockFetcher is an excellent choice for technical traders who want fine-tuned control over their filters. Unlike platforms that rely heavily on automated pattern recognition, StockFetcher appeals to those who prefer to manually define their technical criteria. Its minimalist interface and extensive library of indicators make it a go-to tool for traders seeking precision [45,46,47].
6. GuruFocus
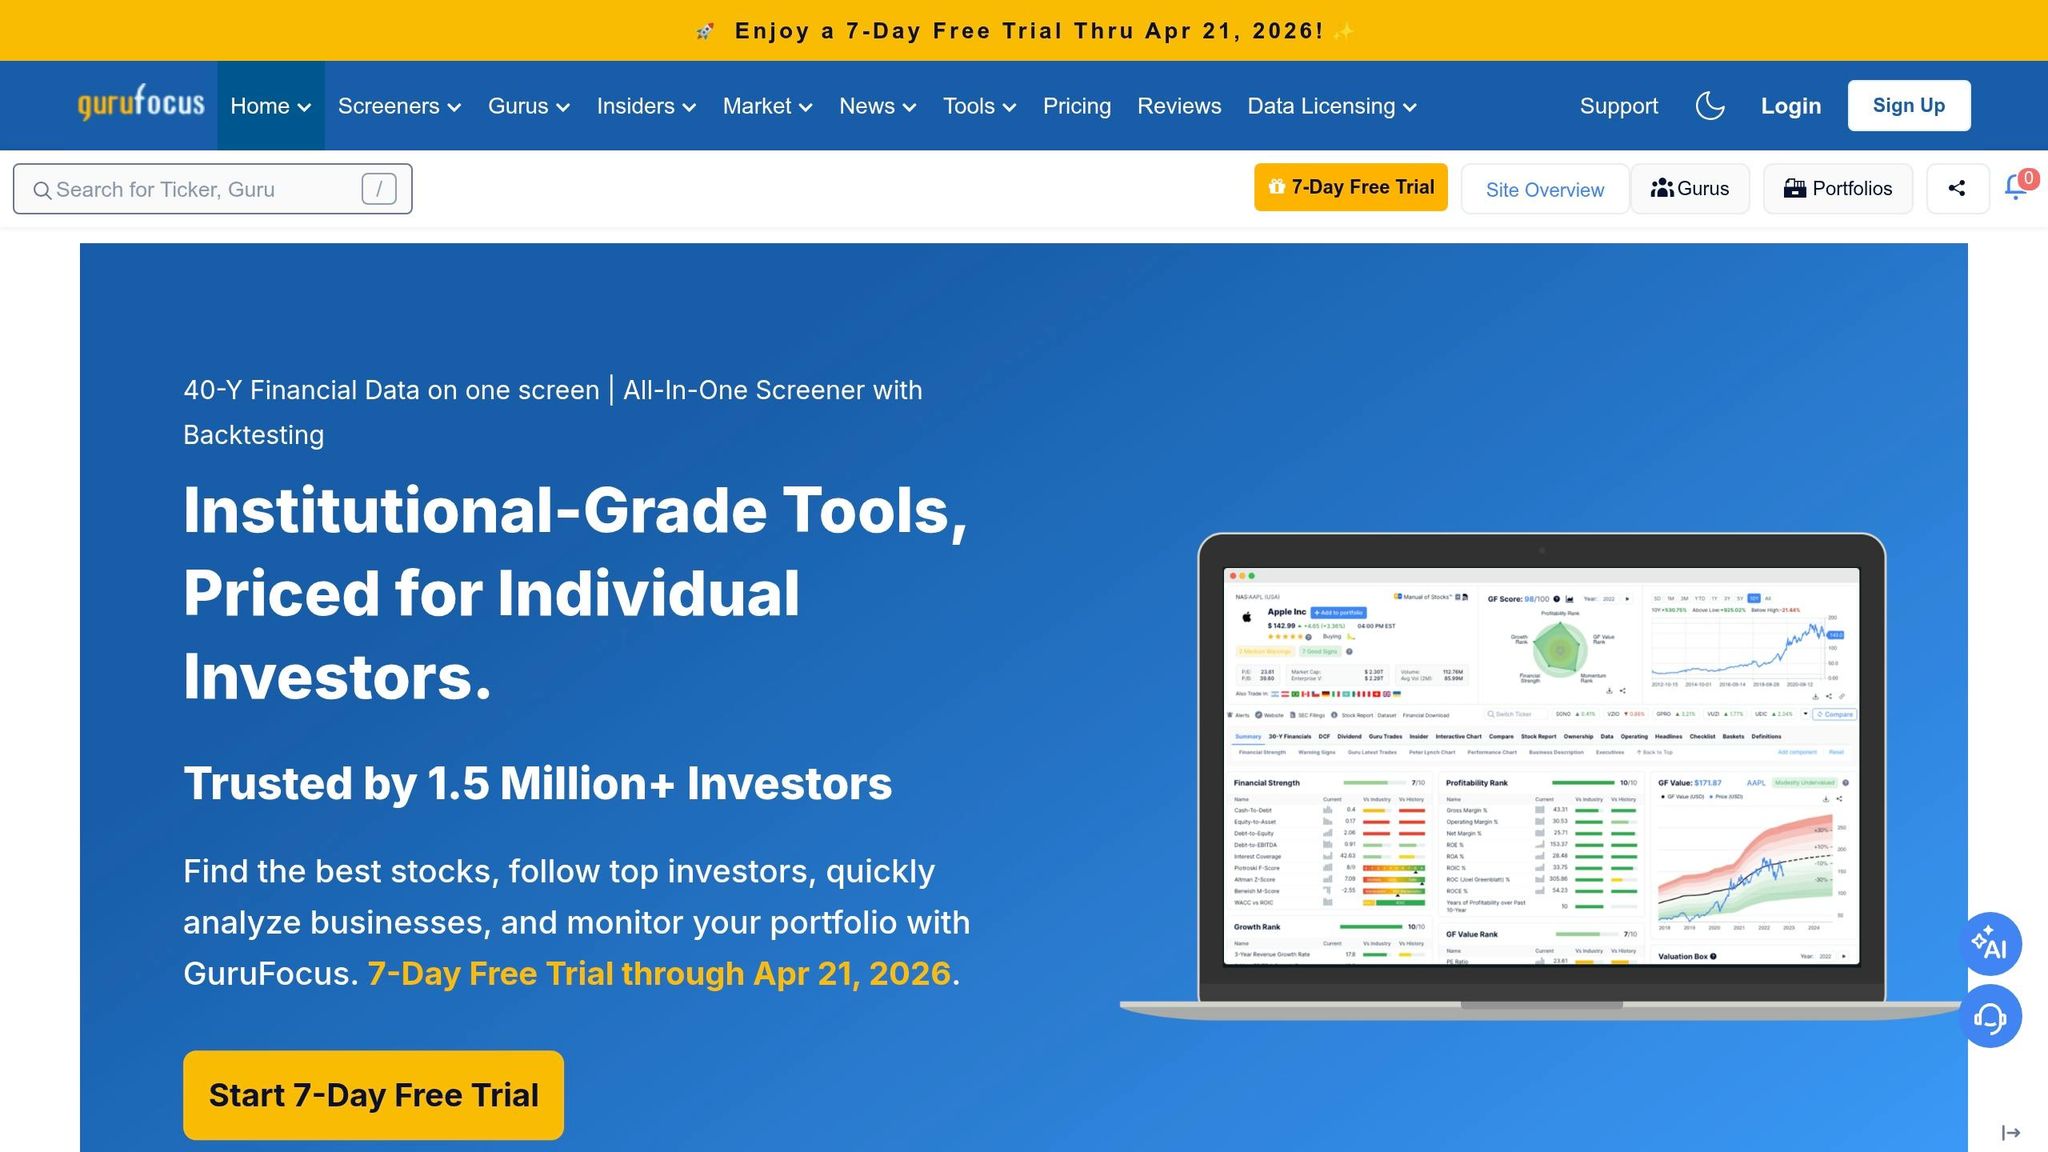
GuruFocus focuses on fundamental analysis and value investing. One of its standout features is tracking over 8,000 institutional investors and 15,000 mutual funds. This allows users to monitor portfolios and review 13F filings, making it possible to replicate the strategies of successful investors. The platform offers up to 30 years of historical financial data and covers more than 100,000 stocks across nearly 100 global markets [49, 50]. This emphasis on in-depth fundamentals sets it apart from platforms that lean more heavily on technical analysis.
Features
GuruFocus provides a range of tools tailored for serious investors. These include DCF (Discounted Cash Flow) and Reverse DCF calculators, as well as Peter Lynch Charts for valuation insights. Unique filters like "Double Buys" (stocks bought by both gurus and insiders) and "Triple Buys" (guru purchases, insider buys, and company buybacks) help uncover promising investment opportunities. The platform also features an advanced Historical Data Screener, which supports multi-year consistency analysis - for example, identifying companies that have grown operating margins by at least 5% annually over the past five years.
For those who prefer custom analyses, GuruFocus offers Excel and Google Sheets add-ins. Higher-tier plans even provide unlimited data queries [50, 52]. These tools make it easier for investors to dive deep into data and refine their strategies using no-code automation.
Stay online and closer to execution. Choose a VPS location for CME futures, New York markets, London FX, API trading, and more.
Host your platform near the market route that matters.
From $59.99/mo
Pricing (US$)
GuruFocus has three annual subscription tiers:
- Premium: $549/year – Includes 30 years of data, 5-year screener backtesting, and tracking for over 140 Premium Gurus.
- Premium Plus: $1,398/year – Adds unlimited Excel queries, backtesting dating back to 2006, and tracking for more than 8,000 institutional investors.
- Professional: $2,448/year – Offers access to delisted stocks and includes a dedicated account manager.
The platform also provides a 7-day free trial and a 30-day money-back guarantee. Adding global regions costs an extra $100 per region annually [49, 52].
Screening Capabilities
The All-in-One Screener is a powerhouse, offering over 500 filters that cover fundamentals, valuation ratios, profitability, and insider activity. Premium Plus members can backtest strategies as far back as 2006. Additionally, the platform automatically evaluates 32 metrics to highlight potential concerns, such as financial distress or earnings manipulation.
GuruFocus serves over 40,000 daily users and has earned a 4.6/5 rating on Trustpilot, along with an A+ rating from the Better Business Bureau. However, some users describe its interface as "dated", "cluttered", and challenging for beginners [50, 51]. Despite this, its advanced screening tools make it a go-to resource for thorough fundamental analysis.
Best Use Case
GuruFocus is ideal for value investors, financial advisors, and professional analysts who prioritize deep fundamental research over technical trends [50, 51]. As Donald Yacktman, President of Yacktman Asset Management Co., put it:
"GuruFocus has done a great service by providing a central location to gather the opinions of so many successful investment managers."
With its extensive historical data and tracking of institutional activities, GuruFocus offers a wealth of resources for professionals looking to refine their investment strategies.
7. Barchart Premier
Barchart Premier combines technical screening with options analytics, catering to traders who need both functionalities. With over a million members and 14,000+ paid subscribers, this platform has established its presence over two decades. A standout feature is its automated screening results delivery - users can save unlimited custom screeners and receive results via email up to four times daily, complete with .csv attachments for offline analysis.
Features
Barchart Premier provides over 150 screening filters, covering technical indicators, fundamentals, and proprietary ratings. Its Barchart Opinion feature consolidates 13 technical indicators to offer Buy/Sell/Hold signals, while the Trend Seeker rating identifies upward momentum. Both tools include five years of historical backtesting, showing hypothetical profit/loss and average trade duration.
For options traders, Barchart tracks unusual options activity and options flow, offering insights into "smart money" movements - features that Barchart claims are typically expensive on other platforms. Premier members also gain access to over 100 technical indicators, customizable grid charts, and specialized chart types like Kagi and Point & Figure. Users can run screeners directly against their watchlists or portfolios rather than scanning the entire market, making it a practical tool for targeted analysis. Additionally, the platform offers up to 250 daily downloads and historical data dating back to January 1, 2000.
Pricing (US$)
Barchart Premier has three pricing tiers: $29.95/month for monthly billing, $239.95/year (equivalent to $19.95/month), or $419.95 for two years (averaging $17.49/month). It also offers a 30-day free trial for new users, supported by a 100% satisfaction guarantee. These plans unlock advanced features like unlimited screeners, full watchlist access, and the complete suite of options tools, setting Premier apart from the more basic Plus tier at $9.99/month.
Screening Capabilities
With over 150 filters, Barchart Premier allows users to screen by various metrics, including price and proprietary ratings. Pre-built templates like "Golden Cross", "J-Pattern", and "RSI Overbought/Oversold" make it easier to set up automated alerts. Premier members can view all results for any screener, unlike free users who are limited to the first 20 results. The "Screen on Watchlists" feature is particularly handy, enabling users to monitor large lists and receive alerts only when specific technical conditions are met. These tools make Barchart Premier a strong choice for traders needing detailed, real-time insights.
Best Use Case
Barchart Premier is ideal for professional traders and advanced users who require in-depth technical screening, real-time alerts, and automated data delivery. It’s particularly beneficial for options traders looking to track unusual activity signals. The platform positions itself as a comprehensive tool for managing investments, news, and data at a competitive price. However, beginners may find the advanced tools challenging to navigate, and some users have reported occasional technical issues.
8. EarningSpike
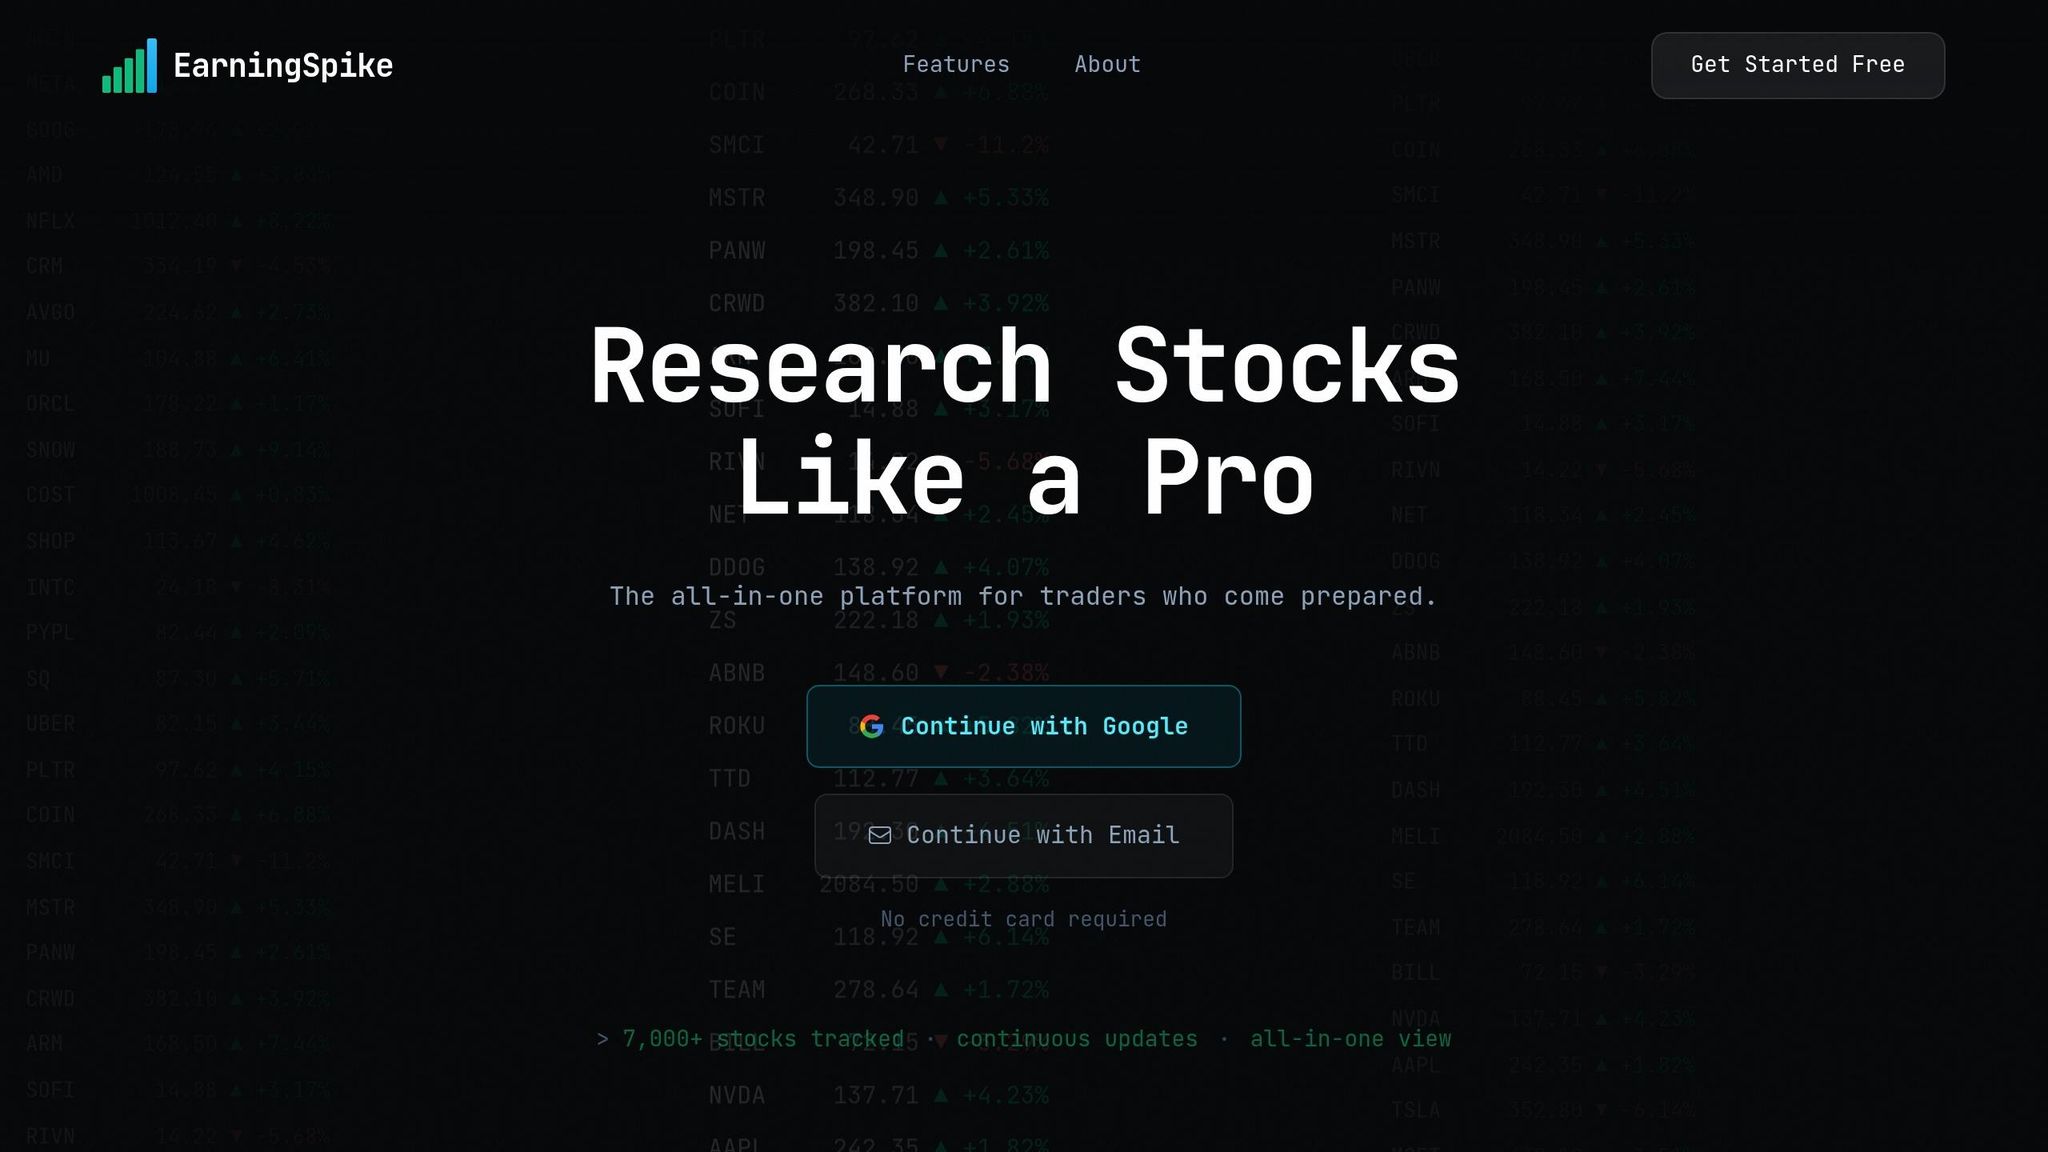
EarningSpike is designed for investors who follow the CANSLIM method, focusing on automating the search for earnings acceleration and institutional sponsorship. The platform zeroes in on two key CANSLIM criteria: Current Quarterly Earnings ("C") and Annual Earnings Growth ("A"). These are essential for identifying top-performing growth stocks. According to research, 75% of winning stocks showed at least a 70% boost in quarterly EPS before their significant price increases.
Features
EarningSpike offers an intuitive earnings table displaying eight quarters of EPS data along with year-over-year percentage changes. Positive trends are highlighted, making it easier to spot acceleration - for instance, quarterly EPS growth climbing from 15% to 30%, then to 50%. Beyond earnings metrics, the platform tracks institutional ownership, showing the number of institutional holders and whether they are adding or reducing positions. Insider trades are also monitored, offering insights into management's confidence in the company. This combination of tools makes EarningSpike a powerful option for growth-focused investors.
Pricing (US$)
EarningSpike provides free access to institutional ownership and insider trading data, making it a cost-effective alternative to platforms like MarketSurge, which charges $150 per month [32, 61].
Screening Capabilities
The platform screens for stocks with at least 25% quarterly EPS growth, a core CANSLIM requirement. Investors can confirm if this growth is supported by at least 25% revenue growth or accelerating sales over the last three quarters. Additionally, it checks for annual earnings growth, often requiring a return on equity of at least 17%. As EarningSpike puts it:
"Value investors buy cheap; CANSLIM investors buy strong".
Best Use Case
EarningSpike is ideal for growth investors using the CANSLIM strategy who want to identify earnings acceleration without investing in costly charting tools. It’s particularly effective for tracking institutional sponsorship trends, a critical factor since around 37% of a stock's price movement is tied to its industry group’s performance. The platform reinforces this with its core message:
"CANSLIM's core principles - buying stocks with strong earnings growth, institutional sponsorship, and market leadership - remain effective."
Strengths and Weaknesses
Each platform brings its own set of advantages and drawbacks. Here's a closer look at what makes each stand out and where they fall short.
FINVIZ is well-regarded for its visual heat maps and automated chart pattern recognition, which make it easier to analyze trends. However, its focus on U.S. markets and the absence of a dedicated mobile app may be a drawback for traders who need flexibility on the go.
Stock Rover shines with its advanced analytics, offering over 700 fundamental metrics at a competitive price. That said, its utilitarian interface and lack of real-time data might not appeal to day traders who need immediate updates.
TradingView is a leader in interactive charting and offers access to over 100 international exchanges. Backed by nearly 300,000 App Store reviews with an average rating of 4.9/5, it’s a favorite among traders. However, it has limited depth in fundamental analysis, and its mobile app does not include the screener function.
Trade Ideas provides AI-driven real-time scanning with its "Holly" feature, making it an excellent choice for professional day traders. On the downside, its premium pricing and advanced tools may deter casual investors.
StockFetcher offers robust text-based filtering with over 125 technical indicators and is free to use. Still, its minimalist, command-line-style interface can be challenging for those used to more visual tools.
GuruFocus specializes in tracking institutional "Guru" portfolios and includes transparent DCF models. However, its annual subscription cost, ranging from $549 to $2,448, might be a barrier for some.
Barchart Premier covers a wide range of markets - including futures, forex, options, and stocks - at a monthly cost of $19.95 to $29.95. Yet, its dated interface and lack of AI features may leave some users wanting more.
EarningSpike provides free data on institutional ownership and insider trading. While useful, its narrow focus on CANSLIM earnings criteria limits its versatility compared to broader platforms.
These comparisons highlight how each platform caters to specific trading needs, helping users find the tool that best fits their strategy.
Conclusion
When it comes to stock screening tools, the best platform for you hinges on your trading style and budget. Many of these alternatives provide powerful tools and features at a fraction of MarketSmith's $149.95/month price, making advanced stock analysis more accessible.
Day traders might find Trade Ideas ($127/month) especially appealing. Its AI-driven "Holly" algorithm delivers real-time scanning, instant alerts, and precise entry signals based on 50 strategies, making it a solid choice for fast-paced trading.
Swing traders often benefit from platforms that focus on visual analysis and backtesting. FINVIZ Elite, at $39.50/month, stands out with automated chart pattern detection and heat maps, while TradingView's Pro plan, starting at $14.95/month, offers access to more than 100 international exchanges - perfect for those trading in global markets.
Long-term investors will appreciate platforms with robust fundamental data. Stock Rover Premium Plus, for example, provides over 700 fundamental metrics and 10 years of historical data. As Investopedia highlighted in April 2026, Stock Rover is "the best choice for long-term investors who need to screen for opportunities based on a massive number of fundamental criteria".
Each platform has its own strengths tailored to specific trading strategies. If you're budget-conscious, starting with free tiers from FINVIZ or StockFetcher can be a smart move before committing to a paid plan. Ultimately, the key is aligning your trading goals with the features that best support your approach.
FAQs
Which screener is best for my trading style?
The best stock screener depends on what kind of trader you are and what you’re looking for. If you’re into fundamental analysis, Koyfin is a go-to choice. It offers over 500 metrics and access to global financial data, making it perfect for digging deep into a company’s financials. On the other hand, if technical analysis is your priority, Finviz Elite is a strong contender. Its features include heat maps, pattern recognition, and backtesting, all designed to make technical screening fast and visually straightforward.
In short, Koyfin is great for balanced, research-heavy analysis, while Finviz Elite shines for traders who need quick, technical-focused insights.
Do I need real-time data for my strategy?
Whether you need real-time data largely depends on your trading or investing strategy. If you're an active trader - like a day trader or swing trader - real-time data is crucial. It allows you to react instantly to market shifts and make quick decisions. On the other hand, long-term investors or those focusing on fundamental analysis might be fine with delayed or end-of-day data since their strategies aren't tied to rapid market fluctuations.
What should I test on a free plan first?
When trying out a free stock screening tool, focus on its basic features first. Look at whether it provides essential fundamental metrics like the P/E ratio or dividend yield, and technical indicators such as RSI (Relative Strength Index) or moving averages. Also, assess if the platform offers real-time data, is easy to navigate, and allows you to filter stocks effectively. These are the key elements to judge if the tool aligns with your needs before exploring any advanced features or paid upgrades.


