
Automated futures trading relies on pre-programmed rules to execute trades without human involvement. Here's the process in a nutshell:
- Build: Convert your trading idea into code using platforms like NinjaTrader or MultiCharts. Define clear, testable rules such as entry/exit signals, position sizing, and risk limits.
- Backtest: Test your strategy on historical data to analyze performance, accounting for costs like slippage and commissions. Tools like walk-forward optimization and Monte Carlo simulations help avoid overfitting.
- Scale: Once proven, deploy your strategy on a reliable VPS for low-latency execution. Use tools like ATR-based stops and position sizing to manage risk as you increase trade sizes or add strategies.
Key factors include choosing the right strategy type (trend-following, mean-reversion, breakout, or AI-driven), rigorous testing, and robust risk management. A VPS ensures uninterrupted performance and faster execution, critical for live trading. Start small with micro contracts and scale up as your system proves reliable.
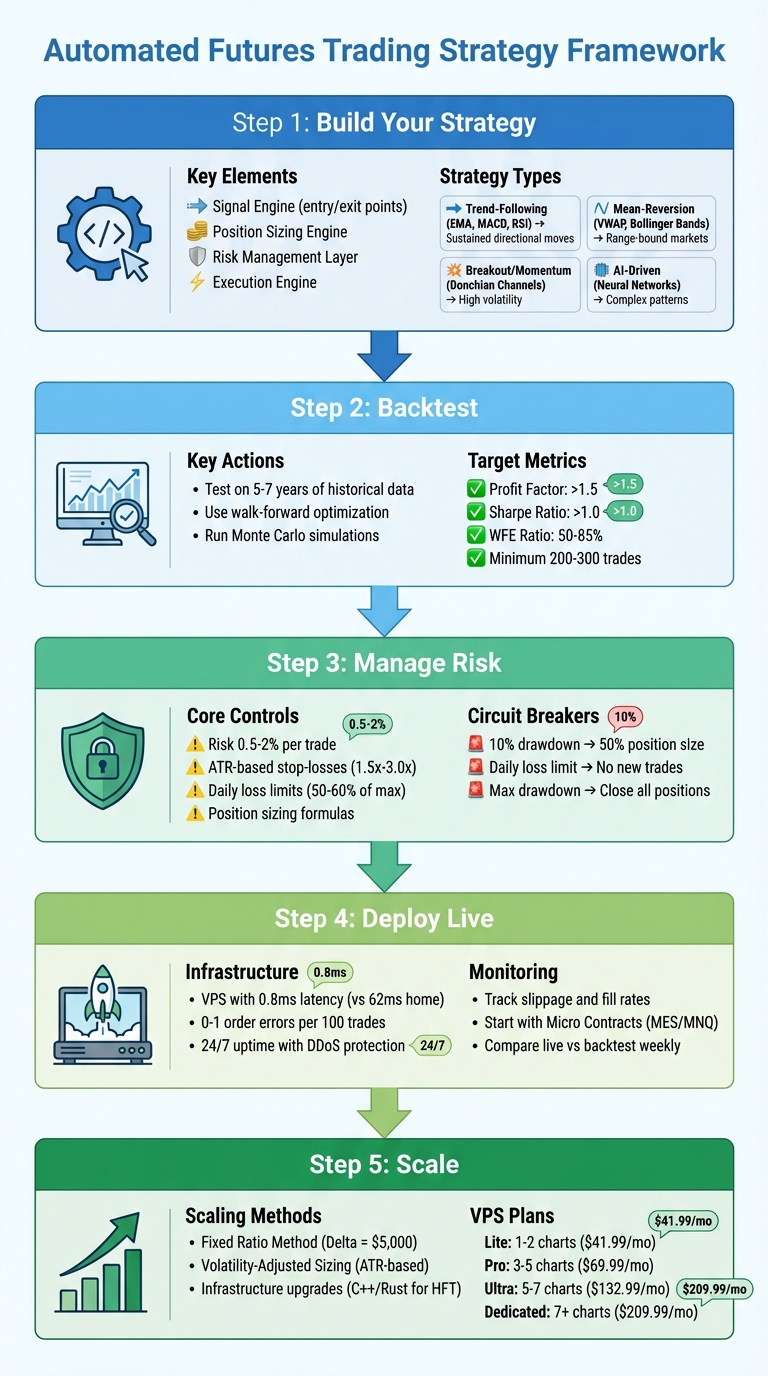
5-Step Automated Futures Trading Strategy Framework: Build, Backtest, and Scale
Step 1: Building Your Futures Trading Strategy
Creating an automated futures trading strategy starts with setting clear, measurable rules. Computers need precise instructions they can execute without interpretation - vague phrases like "the market looks strong" don't cut it. Instead, use specific, programmable conditions like: "Buy when the price closes above the 50-period EMA and RSI exceeds 55". A solid strategy includes four key elements: a signal engine for entry and exit points, a position sizing engine to manage contract quantities based on risk, a risk management layer with predefined limits, and an execution engine to handle interactions with your broker's API. Once you've got these components, it's time to choose a strategy type that aligns with your market goals.
Your strategy should fit the market's behavior. For example, trending markets call for different approaches than range-bound ones. Additionally, your technical setup - like latency requirements - can determine whether certain strategies are feasible. Below are some common strategies tailored to different market scenarios.
Trend-Following Strategies
Trend-following strategies aim to ride sustained price movements in one direction until the momentum fades. These systems often rely on moving average crossovers, such as a 20-period EMA crossing above a 50-period EMA, paired with momentum indicators like MACD or RSI for confirmation. For instance, a backtest of a "Fast Trend Following" strategy on S&P 500 E-mini and 10-year Treasury futures delivered a 0.294 Sharpe ratio, outperforming a buy-and-hold approach, which had a -0.335 Sharpe ratio. While this approach thrives during strong directional trends - whether upward or downward - it struggles in choppy, sideways markets, where frequent reversals can lead to losses. To avoid entering during low-volatility periods, many traders use Average True Range (ATR) filters.
Mean-Reversion Strategies
Mean-reversion strategies operate on the assumption that prices eventually return to their historical average after significant deviations. These systems look for overextended price levels using tools like Bollinger Bands, VWAP, or Z-scores and then take positions expecting a snapback to the mean. Such strategies work well in range-bound or sideways markets, where prices tend to oscillate within set boundaries. For example, if the price touches the upper Bollinger Band and RSI is above 70, a mean-reversion system might short the market, anticipating a pullback. The tricky part is differentiating between a temporary deviation and the start of a breakout. To address this, traders often use volume profile or market depth analysis to confirm whether the move is overextended or the beginning of a new trend.
Breakout and Momentum Strategies
Breakout strategies focus on price movements that breach established support or resistance levels, often accompanied by increased volatility or volume. These systems capitalize on sudden price surges during high market activity, such as economic announcements or market openings. Donchian Channels, which track the highest high and lowest low over a set period, are commonly used to identify breakout points. For instance, the "BAG Indicator", a momentum-based tool for NQ futures, boasts a 74% win rate with a 1:2 risk-reward ratio. However, these strategies require caution to avoid false breakouts, where the price briefly breaks a level before reversing. Volume profile analysis can help distinguish genuine breakouts from fake-outs. Since these strategies often involve rapid execution during volatile conditions, a low-latency setup can make a big difference.
AI-Driven Strategies
AI-driven strategies take a different approach, using machine learning and neural networks to uncover patterns that traditional indicators might miss. Instead of relying on fixed rules, these systems adapt by analyzing massive datasets to identify subtle correlations, sentiment trends, or even manipulative behaviors like spoofing. High-frequency trading systems often use AI to fine-tune entry points, minimize slippage, and adjust stop-losses dynamically based on current volatility. These strategies are particularly effective in complex, data-heavy environments where traditional methods fall short. For example, an AI model could simultaneously analyze order flow, news sentiment, and historical price data to predict short-term price movements. However, the complexity of AI strategies comes with challenges: they require programming skills, significant computational power, and rigorous testing to avoid overfitting. Additionally, ultra-low latency is crucial, so deploying these strategies often involves using a VPS located near exchange data centers.
These strategy types lay the groundwork for further backtesting, risk management, and live trading deployment.
| Strategy Type | Primary Indicators/Tools | Ideal Market Condition |
|---|---|---|
| Trend-Following | EMA Crossovers, MACD, RSI, ATR | Sustained directional moves |
| Mean-Reversion | VWAP, Bollinger Bands, Z-Score, RSI | Range-bound or sideways markets |
| Breakout/Momentum | Donchian Channels, ATR, Volume Profile | High activity/volatility expansion |
| AI-Driven | Neural Networks, Predictive ML Models | High-frequency or complex patterns |
Step 2: Backtesting Your Strategy
Backtesting helps you see how your trading strategy would perform under different market conditions before you risk any real money. It uncovers weaknesses in various scenarios, like trending markets, range-bound periods, or high-volatility events. Skipping this step means trading without a clear plan, which is a recipe for trouble. A solid backtest ensures your strategy can handle diverse conditions and accounts for costs like commissions and slippage. This groundwork lays the foundation for effective risk management and smoother live trading.
Setting Up Backtesting in NinjaTrader or MultiCharts
To get started, you’ll need clean, reliable historical data. For futures trading, use continuous contracts to avoid price gaps caused by contract rollovers. In NinjaTrader, go to Tools > Historical Data to download data (tick, 1-minute, or daily) from sources like Kinetick or CQG. Once your data is ready, head to the Strategy Analyzer. This is where you’ll run your backtests. Pick your strategy, choose the trading instrument (like ES or NQ futures), set the timeframe, and adjust parameters such as commissions and slippage. Including these costs in your backtest ensures your profit estimates are realistic.
Run 24/7 while you sleep. Keep bots, platforms, and trade copiers online on a dedicated VPS.
Low-latency VPS hosting for your trading platform.
From $59.99/mo
Prefer manual testing? NinjaTrader’s Playback Connection lets you replay historical market data in real time, though it updates every second instead of tick-by-tick. Keep in mind, market replay data typically covers only the past 90 days, making it ideal for short-term strategies. MultiCharts offers similar features and is popular for its flexibility with EasyLanguage and C#, plus its strong portfolio-level testing tools. Whichever platform you choose, aim to backtest over at least 5 to 7 years to capture a variety of market conditions.
Avoiding Overfitting with Walk-Forward Optimization
After setting up your backtesting framework, it’s time to test your strategy’s resilience with walk-forward optimization. This technique is a trusted way to validate trading strategies. Here’s how it works: divide your historical data into segments, optimizing your strategy on an In-Sample period (e.g., 3 years) and testing it on an Out-of-Sample period (e.g., 6 months). Then, roll the window forward and repeat. This process mimics real-world conditions by periodically re-optimizing. If your strategy performs well during in-sample testing but struggles out-of-sample, it may be overfit - designed too specifically for past data rather than reflecting real market behavior.
"If the system is going to work in real trading, it must first pass a walk-forward test." - AmiBroker
The Walk-Forward Efficiency (WFE) Ratio measures how well your strategy’s Out-of-Sample performance compares to its In-Sample results. It’s calculated as (Annualized OOS Profit / Annualized IS Profit) × 100. A WFE ratio between 50% and 85% indicates a reliable strategy, while anything below 35% suggests overfitting.
To stress-test further, use Monte Carlo simulations. These shuffle trade orders, vary slippage, and simulate missed trades to see how your strategy holds up under worst-case scenarios. Keeping your strategy simple also helps - limit yourself to three or four variables, as adding more increases the risk of overfitting. Instead of fixed stop-loss values, try dynamic, volatility-based methods like ATR stops. When optimizing in NinjaTrader’s Strategy Analyzer, group parameters logically and look for plateaus - areas where performance stays stable over a range of settings - rather than isolated performance spikes.
Comparing Backtesting Results Across Strategies
Once you’ve backtested multiple strategies, compare the results using key metrics to pick the most reliable one. These metrics help you refine risk management and prepare for live trading. For instance:
- Profit Factor: Gross profit divided by gross loss. Aim for a value above 1.5; anything over 2.0 is excellent.
- Sharpe Ratio: Measures risk-adjusted returns. A ratio above 1.0 is solid, while 1.5 to 2.0 indicates strong performance.
- Maximum Drawdown: The largest equity drop from peak to trough. This shows how much loss you might face and whether it’s manageable.
- Expectancy: The average profit per trade, calculated as (Win % × Average Win Size) - (Loss % × Average Loss Size). This number must be positive after accounting for costs like commissions and slippage.
| Metric | Definition | Target/Benchmark |
|---|---|---|
| Profit Factor | Gross Profit / Gross Loss | Greater than 1.5 |
| Sharpe Ratio | Risk-adjusted return | Greater than 1.0 |
| Max Drawdown | Largest drawdown in equity | Within risk tolerance |
| Expectancy | Average profit per trade | Must be positive |
For reliable results, your backtest should include at least 200–300 trades. Many professional traders also adjust their backtest results to reflect real-world conditions. This might mean reducing net profit by 5–15% and increasing Maximum Drawdown by 20–30% to account for slippage, fees, and other factors.
If you’re running resource-heavy tasks like walk-forward tests or Monte Carlo simulations, a high-performance VPS can save you time and hassle. Services like QuantVPS ensure reliable uptime and stability, so you can focus on improving your strategy without worrying about local internet or power issues.
Step 3: Managing Risk in Automated Trading
When it comes to automated trading, risk management is what separates systems that thrive from those that fail. Without the right controls, one bad trade - or a streak of losses - can wipe out your account. Think about this: if your account suffers a 50% drawdown, you’d need a 100% gain just to break even. A 75% drawdown? That requires nearly a 300% recovery [26]. Smart risk management doesn’t just protect your capital; it ensures your strategy holds up when it moves from testing to live trading. Most professional traders stick to risking only 0.5% to 2% of their account on any single trade [26]. This approach allows them to weather 10 to 20 losses in a row without catastrophic consequences.
Automated Stop-Loss and Take-Profit Rules
The first line of defense in risk management is setting up effective stop-loss rules. Many traders rely on the Average True Range (ATR) as a dynamic tool for this purpose [28]. Unlike fixed stop-losses, which don’t adapt to market conditions, ATR-based stops expand during volatile periods and contract when the market is calm. This reduces the chances of being stopped out by random market noise. Common ATR multiples include:
- 1.5x ATR for scalping
- 2.0x ATR for day and swing trades
- 3.0x ATR for trend-following strategies [28]
"A trading algorithm is only as robust as its exit logic." - QuantStrategy.io Team
Take-profit rules are just as important. Fixed Reward-to-Risk (R:R) ratios, such as targeting 2R (aiming to gain twice what you risk), work well for systematic strategies. For more flexibility, dynamic R:R ratios based on support and resistance levels can adjust to market conditions. Another option is profit scaling - taking partial profits at 1R while letting the remainder run [26]. Time-based stops are also useful, closing trades after a set period if the profit target isn’t reached. This prevents your capital from getting tied up in stagnant positions [26].
Once your exit rules are in place, the next step is to fine-tune trade sizes and assess portfolio correlations.
Position Sizing and Correlation Checks
Position sizing is key to managing risk. Here’s a simple formula:
Contracts = Risk Amount / (Tick Value × Stop Distance in Ticks) [29][31].
For example, if you’re risking $500 on an ES trade with a 20-tick stop, and each tick is worth $12.50, you’d trade 2 contracts ($500 / ($12.50 × 20) = 2).
Using volatility-adjusted sizing can further refine your approach. This method scales your position size inversely to market volatility - smaller positions during high volatility and larger ones during calm periods. This ensures your dollar risk remains consistent [29][26][30]. For a more mathematical approach, the Kelly Criterion helps maximize long-term growth. However, many professionals use a "Fractional Kelly" approach, typically applying 25% to 50% of the calculated value to reduce the risk of large drawdowns [29][26][28].
| Sizing Method | Pros | Cons | Best For |
|---|---|---|---|
| Fixed Fractional | Simple; limits catastrophic loss | Ignores volatility and correlation | Most retail strategies |
| Volatility-Adjusted | Adapts to market noise; maintains consistent risk | Requires reliable volatility estimates | Trend-following |
| Kelly Criterion | Maximizes long-term growth mathematically | Highly sensitive; can lead to large drawdowns | Strategies with known win rates |
Another critical factor is correlation. If you’re running multiple strategies, make sure they aren’t trading highly correlated assets. For instance, BTC and ETH often show a correlation of 0.85 or higher [26]. A single market event could trigger losses across all correlated positions, blowing past your risk limits. Reviewing correlation matrices before deploying multiple bots can help you diversify effectively [26][30].
Beyond individual trades, portfolio-level protections like daily loss limits and adjustments for market volatility can safeguard your overall strategy.
Daily Loss Limits and Volatility Adjustments
Daily loss limits act like circuit breakers, preventing emotional or revenge trading. A common approach is to set your limit at 50% to 60% of the maximum daily loss allowed by your broker [32]. This buffer is crucial, especially since 95% of proprietary trading failures stem from poor risk management, with 60% involving revenge trading after an initial loss [32].
Tiered circuit breakers can take this a step further:
- Reduce position sizes by 50% after a 10% drawdown
- Stop entering new trades once your daily loss limit is hit
- Close all positions if your maximum drawdown is breached
- Pause trading after three consecutive losses [26][32]
| Risk Level | Trigger Condition | Action Taken |
|---|---|---|
| NORMAL | Equity at/near peak | 100% position allocation |
| REDUCED | Drawdown > 10% | 50% position sizing |
| PAUSED | Daily loss limit hit | No new positions allowed |
| HALTED | Maximum drawdown breached | Close all positions |
When volatility spikes, ATR-based stops automatically adjust to the increased noise, while reducing position sizes ensures your risk stays consistent [26][29]. Adding a slippage buffer - typically 0.5x ATR - to your stop-loss calculations can also account for execution delays in fast-moving markets [29].
"Automation doesn't mean 'set it and forget it.' ... strategy automation requires active monitoring because of unforeseen things that can (and will) go wrong." - NinjaTrader Team
These risk management practices are the backbone of any automated trading system. They ensure your strategy can endure the real-world challenges of live trading, giving it the chance to perform as intended.
Step 4: Deploying and Monitoring Live Trading
Stay online and closer to execution. Choose a VPS location for CME futures, New York markets, London FX, API trading, and more.
Host your platform near the market route that matters.
From $59.99/mo
Once you've thoroughly tested your strategy and set up risk controls, it's time for the real challenge: live trading. This is where your preparation meets the unpredictable nature of the market. Deploying your system requires careful attention, especially when actual money is at stake.
Setting Up a VPS for Low-Latency Trading
Proximity matters. If you're trading CME futures, it's best to have your server in Chicago, where the exchange servers are located [33]. For instance, a professional VPS in NY4 can reduce ping to just 0.8ms, compared to 62ms on a typical home fiber connection [33]. This difference isn't just about speed - it directly impacts performance. Tests show that a well-placed VPS cuts order errors down to 0–1 per 100 trades, while home fiber connections average 11 errors per 100 [33].
| Connection Type | Ping to Broker | Order Errors (per 100) | Slippage (EURUSD) |
|---|---|---|---|
| NY4 Forex VPS | 0.8 ms | 0–1 | 0.1 pip |
After choosing a VPS location, ensure your trading platform is correctly configured. For NinjaTrader users, confirm that the Control Center's "Strategy Position" aligns with your actual account position before activating live trades. Also, secure your server by avoiding open RDP ports. Use tools like Cloudflare Access to implement Zero-Trust security [33].
"Reliability comes from a well-placed VPS, clean data, robust automation, and constant observability."
- Thomas Vasilyev, EA Developer [33]
With a reliable, low-latency VPS in place, the next step is to monitor your trades in real time.
Monitoring Execution and Performance Metrics
Deploying your strategy is just the starting point. Real-time monitoring is essential for staying ahead of potential issues. Open a price chart and observe your automated strategy in action to ensure it behaves as expected, based on your backtesting. Use your platform’s Executions tab to review trades daily, paying close attention to slippage (the gap between expected and actual fill prices), fill rates, and any error codes that surface during execution .
For those running strategies on servers, commands like nohup can keep your trading process running even after logging out [34]. And remember, never manually alter positions while your strategy is active - this can disrupt the synchronization between your platform and your account.
QuantVPS offers 100% uptime, DDoS protection, automatic backups, and system monitoring to ensure uninterrupted trading. Whether you choose the VPS Pro plan ($99.99/month or $69.99/month billed annually) for handling 3–5 charts or the VPS Ultra plan ($189.99/month or $132.99/month billed annually) for 5–7 charts, you’ll benefit from unmetered bandwidth and high-speed NVMe storage. These setups are optimized for platforms like NinjaTrader and MultiCharts, so you can focus on refining your strategy without worrying about server reliability.
Compare your live trading performance to your backtesting results on a weekly basis. If metrics like slippage or fill rates consistently fall short of your expectations, it's a warning sign. Before scaling up, consider testing with Micro Contracts (such as MES or MNQ futures) to assess your execution pipeline under actual market conditions. This trial phase can uncover issues like latency spikes or trouble handling volatile markets - problems that paper trading often overlooks. By diligently monitoring performance, you set the stage for scaling your strategy with confidence.
Step 5: Scaling Strategies for Larger Accounts
Once you've established a solid strategy and implemented risk management, scaling your account requires careful attention to position sizing and the infrastructure supporting your trading operations.
Position Sizing and Frequency Adjustments
As your account grows, simply adding more contracts won't cut it - you need a structured approach to avoid over-leverage. The Fixed Ratio Method is a popular solution. This method adjusts position sizes based on capital growth, using a "Delta" value (a specific profit amount required to add one more contract). For instance, if your Delta is $5,000, you’d only add another contract after earning that amount in profit. This approach creates a geometric growth path, ensuring your risk remains manageable as your account expands [28].
Another key factor is accounting for market volatility. Volatility-Adjusted Sizing, which uses ATR (Average True Range), is critical here. When market volatility spikes, your stop-loss distance increases, which means you need to reduce the number of contracts to maintain consistent dollar risk. By applying ATR multiples, you can adjust your positions dynamically, keeping your risk level steady across varying market conditions [28].
For traders operating at higher frequencies, infrastructure becomes a game-changer. While Python works well for early-stage prototyping, more demanding setups require compiled languages like C++ or Rust to achieve sub-millisecond execution speeds. This eliminates bottlenecks like Python's Global Interpreter Lock (GIL) [37]. Advanced setups might even involve FPGA or GPU hardware accelerators for real-time model inference and processing high-frequency tick data.
"In futures, where tight margins are common, minimizing the time between signal generation and order placement is paramount."
- QuantStrategy.io Team
Before scaling up to full E-mini contracts, test with Micro E-mini futures (MES, MNQ). This helps you gauge execution friction, slippage, and commission costs in live market conditions. Additionally, using an Order Management System (OMS) with built-in retry mechanisms ensures reliability for larger orders, handling issues like network timeouts or margin errors efficiently. For AI-driven strategies, monitor for "feature drift" in real-time to ensure your model's accuracy remains intact as your account size increases [37].
Optimizing Performance with QuantVPS Plans
As your trading operations grow, you’ll need infrastructure that can keep up. A local PC might suffice initially, but it’s prone to power outages and internet disruptions. A Virtual Private Server (VPS), on the other hand, offers 24/7 uptime and low-latency connections to exchanges, making it a must-have for scaling traders.
Here’s a breakdown of QuantVPS plans to match your trading needs:
| Plan | CPU Cores | RAM | NVMe Storage | Network Speed | Best For | Monthly Cost (Annual) |
|---|---|---|---|---|---|---|
| VPS Lite | 4 | 8GB | 70GB | 1Gbps+ | 1–2 charts, single strategy | $41.99 |
| VPS Pro | 6 | 16GB | 150GB | 1Gbps+ | 3–5 charts, moderate frequency | $69.99 |
| VPS Ultra | 24 | 64GB | 500GB | 1Gbps+ | 5–7 charts, high-frequency trading | $132.99 |
| Dedicated Server | 16+ | 128GB | 2TB+ | 10Gbps+ | 7+ charts, institutional-grade needs | $209.99 |
For traders juggling multiple strategies or engaging in high-frequency trading, the VPS Ultra plan is a strong choice. With 24 cores and 64GB RAM, it can handle up to 5–7 charts and support up to 4 monitors. If you’re managing institutional-level workloads or need maximum performance, the Dedicated Server offers unmatched power with 16+ cores, 128GB RAM, and 10Gbps+ network speeds. All plans include features like DDoS protection, automatic backups, and unmetered bandwidth, ensuring your trading setup remains reliable and secure.
Conclusion
Creating a successful automated futures trading system is no small feat - it demands discipline, thorough testing, and a well-built infrastructure. At its core, the process begins with converting your trading ideas into clear, testable rules. Why? Because only rules that can be tested provide the foundation for reliable automation. This clarity is what enables effective backtesting and solid risk management practices.
Backtesting is where traders often face their biggest challenges. It’s not just about confirming your strategy works; it’s about avoiding common pitfalls like overfitting. For instance, testing 1,000 random strategies can yield a "best" Sharpe ratio of 2.367 purely by chance, while survivorship bias might inflate backtest returns by over 11 percentage points annually. Backtesting helps confirm your edge, but risk management is what ensures your longevity in the market.
Once your strategy passes the testing phase, implementing strict risk controls is essential. Hardcoded limits, such as a 2% daily drawdown cap that stops your bot from trading for the day, can prevent disastrous losses. Starting small also matters - using Micro E-mini contracts (MES, MNQ) lets you test the waters of real-world execution friction before scaling up to larger contracts [31].
Every step of the process, from coding your ideas to scaling your strategy, highlights the importance of a systematic approach. Futures trading operates at lightning speed - delays as small as a few milliseconds can lead to significant slippage [37]. Relying on local PCs for automation simply doesn’t cut it. That’s where a service like QuantVPS comes in. With ultra-low latency, 24/7 uptime, DDoS protection, and automatic backups, QuantVPS ensures reliability. Plans range from VPS Lite ($41.99/month billed annually) for single-strategy setups to Dedicated Servers ($209.99/month billed annually) for institutional-grade performance.
From the initial concept to full-scale deployment, success in automated futures trading hinges on precision, rigorous testing, strict risk management, and robust infrastructure. Every detail matters in this high-speed, high-stakes environment.
FAQs
How do I know if my strategy is overfit?
When a strategy excels on historical data but struggles in live trading or out-of-sample tests, it’s often a sign of overfitting. Some red flags to watch for include excessive parameter adjustments, overly intricate models, or inconsistent results across varying market conditions.
To ensure your strategy isn’t just tailored to past data, consider using methods like out-of-sample validation, walk-forward analysis, or Monte Carlo simulations. These techniques can help determine if the strategy’s performance remains reliable when applied to new, unseen data.
What’s the best way to model real slippage and fees?
When simulating real slippage and fees, it's crucial to use realistic assumptions. For example, consider doubling historical spreads, adding 100-200ms of API latency, and applying full taker fees. To assess how resilient your strategy is, use tools like slippage sweep plots, which test performance across various slippage scenarios. These methods help ensure your strategy is better prepared for actual trading conditions.
When should I scale from micro to full-size contracts?
When moving from micro to full-size contracts, the key is to ensure you're consistently profitable and disciplined with smaller positions first. Only increase your position size after a solid track record of successful trades. This approach helps confirm your readiness and avoids decisions based purely on confidence or impulse. Prioritize steady growth and strong risk management practices to make scaling a sustainable and effective part of your trading strategy.


