
Neutral trading strategies are designed for markets that move sideways - where prices stay within a range instead of trending up or down. Since markets are range-bound about 70% of the time, these strategies can help you generate steady returns without relying on big price moves. By focusing on tools like options straddles, options strangles, and pairs trading, you can profit from time decay and stable price action.
Key highlights:
- Options Straddles: Best for small price movements or expected volatility spikes.
- Options Strangles: Offers a wider profit range but lower premiums.
- Pairs Trading: Balances long and short positions on correlated assets.
To identify sideways markets, use indicators like Bollinger Bands (narrow bands signal low volatility) and RSI (oscillating between 40–60). Combine these with volume analysis to confirm price ranges. Platforms like QuantVPS can help execute these strategies efficiently with low latency and reliable uptime.
Risk management is critical: limit positions to 1% of your capital, use stop-losses just beyond support and resistance levels, and monitor volatility shifts. Neutral strategies thrive on stability, making them a reliable choice for consistent returns in calm market conditions.
How to Identify Sideways Markets
Spotting range-bound markets is key to using neutral trading strategies effectively. These markets are defined by prices moving horizontally within set boundaries, steady trading volume, and reduced volatility. Recognizing these patterns early can help traders capitalize on opportunities, and technical indicators and forex algorithmic trading strategies are invaluable tools in this process.
The best method combines price action analysis with technical tools. In a sideways market, prices bounce between horizontal support and resistance zones instead of forming higher highs or lower lows. These zones are not rigid lines but flexible areas that the market respects over time.
Here’s a quick comparison to help identify sideways markets:
| Characteristic | Sideways Market Behavior | Transition to Trend Signal |
|---|---|---|
| Price Action | Moves horizontally; no clear higher highs or lower lows | Breakout above resistance or below support |
| Volume | Consistent and steady | Noticeable surge in the breakout direction |
| Volatility | Low and stable | Becomes more pronounced with larger price swings |
| RSI | Fluctuates between 30–70 or 40–60 | Stays above 70 or below 30 for extended periods |
As Galen Woods from Trading Setups Review explains:
"When a price zone gets the interest of the market, the market trades. And volume surges".
This means that spikes in trading volume at support or resistance levels confirm the boundaries of the range. Without these volume surges, the range may be weak and prone to breaking.
Sideways markets can last anywhere from a few hours to several months, so patience is critical. The next sections will dive into specific tools - Bollinger Bands and RSI - that can help refine your timing for trades within these ranges.
Using Bollinger Bands to Confirm Range-Bound Conditions
Bollinger Bands are a powerful tool for identifying and trading within sideways markets. They consist of a 20-period simple moving average (SMA) as the centerline, with upper and lower bands set at two standard deviations. Roughly 95% of price movements occur within these bands.
In a sideways market, prices typically oscillate between the upper and lower bands, while the bands themselves become narrow. This "Bollinger Squeeze" indicates low volatility and consolidation. Shaun Murison, Senior Market Analyst at IG, notes:
"The narrow bands suggest a period of low volatility often associated with a sideways market environment (consolidation)".
The 20-period SMA serves as a mean-reversion target. When prices hit the lower band, they often move back toward the middle, and the same happens when prices touch the upper band. John Bollinger, the creator of the tool, emphasizes:
"Bollinger Bands work best when the middle band is chosen to reflect the intermediate-term trend, so that trend information is effectively combined with relative price level information".
To confirm a sideways market, check if the bands remain consistently narrow. If they suddenly widen and volatility increases, the market may be transitioning into a trend. For more reliable signals, wait for prices to close back inside the bands after touching or briefly moving through them.
Run 24/7 while you sleep. Keep bots, platforms, and trade copiers online on a dedicated VPS.
Low-latency VPS hosting for your trading platform.
From $59.99/mo
Using RSI and Oscillators to Spot Trading Opportunities
The Relative Strength Index (RSI) is another essential tool for identifying trading opportunities in sideways markets. RSI measures momentum by analyzing the speed and magnitude of price changes. According to Investopedia:
"The RSI works best in trading ranges rather than trending markets".
In range-bound conditions, RSI typically oscillates between overbought and oversold levels without showing a strong directional trend. While the standard RSI thresholds are 30 (oversold) and 70 (overbought), many traders adjust these to a 40–60 range for better precision in sideways markets.
Here’s how to use RSI effectively:
- Look for bullish signals when RSI is near 40, especially if the price is also touching the lower Bollinger Band.
- Watch for bearish signals when RSI is near 60, particularly if the price is hitting the upper Bollinger Band.
When combined, Bollinger Bands and RSI create a reliable system for trading in sideways markets. The bands outline the market’s boundaries, while RSI pinpoints when momentum is fading at those boundaries. Volume spikes at key levels further confirm these signals.
With these tools, you’ll be well-prepared to take advantage of neutral trading strategies or explore popular futures trading strategies covered in the next section.
3 Neutral Trading Strategies for Range-Bound Markets
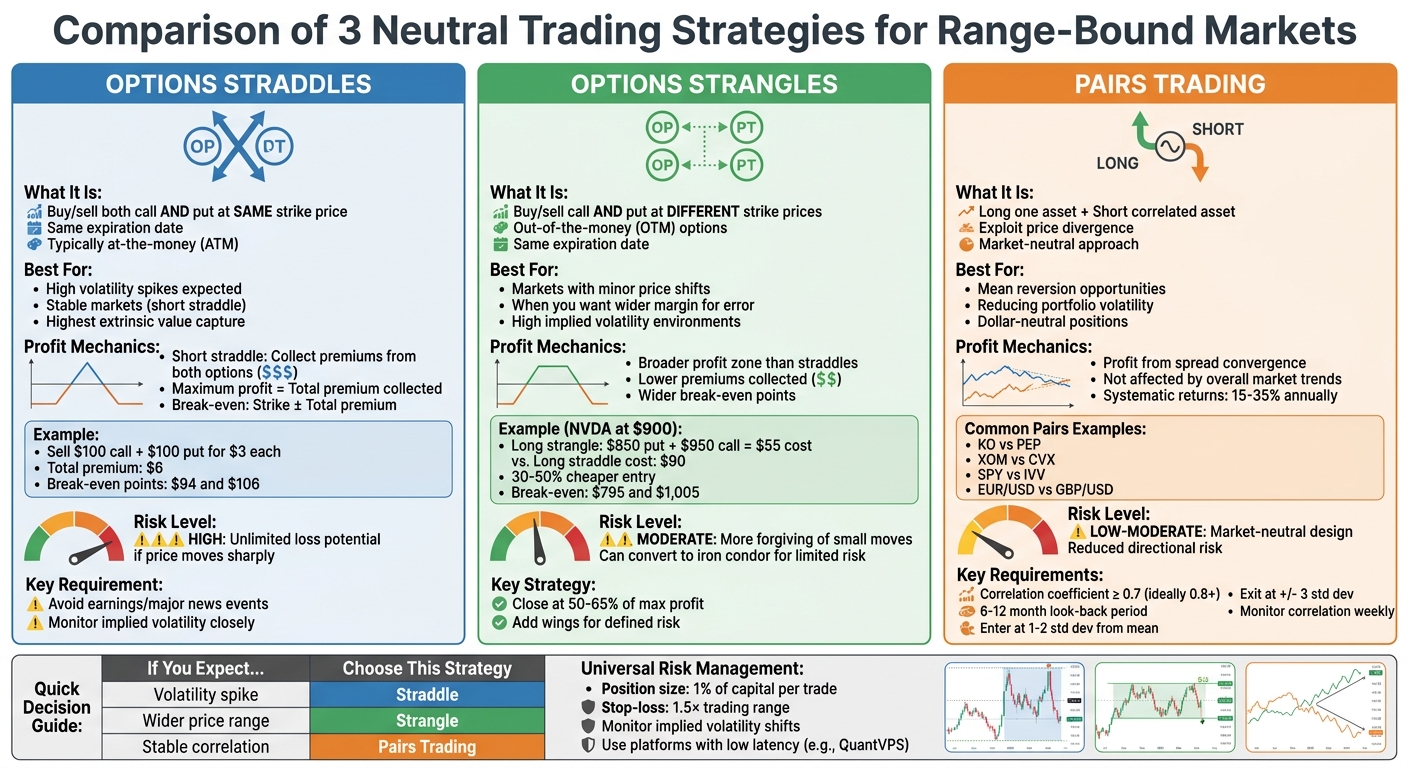
Neutral Trading Strategies Comparison: Straddles vs Strangles vs Pairs Trading
When markets move sideways, you can still find opportunities by applying strategies tailored to such conditions. Below are three approaches, each with its own mechanics, risk considerations, and capital requirements.
Options Straddles: Profiting from Volatility Spikes
A straddle involves buying or selling both a call and a put option for the same asset, with the same strike price and expiration date. The approach depends on your expectation of market movement:
- Long straddle: Used when you anticipate high volatility.
- Short straddle: Best for stable markets with minimal price movement.
In a short straddle, you sell both a call and a put at the same strike price, often at-the-money (ATM). This strategy allows you to collect premiums from both options, profiting as long as the asset's price stays near the strike. The maximum profit is the premium collected, but losses can escalate if the price moves sharply in either direction.
Charles Schwab highlights the utility of this strategy:
"Short straddles and strangles can help traders take advantage of range-bound trading or drops in implied volatility."
ATM options are ideal for short straddles because they carry the highest extrinsic value, making them more sensitive to time decay (theta). Your break-even points are calculated by adding and subtracting the total premium collected from the strike price. For example, if you sell a $100 call and a $100 put for $3 each (total premium: $6), your break-even points are $94 and $106.
Risk management is crucial. Use stop-loss orders and closely monitor implied volatility. Focus on stable stocks or ETFs and avoid trading around earnings or major news events.
If you prefer a strategy with a wider margin for error, you might explore short strangles.
Options Strangles: Managing Wider Price Ranges
For markets with minor price shifts, short strangles offer more flexibility. Like a straddle, a strangle involves buying or selling call and put options, but with different strike prices - usually out-of-the-money (OTM) - and the same expiration date.
Short strangles create a broader profit zone, making them more forgiving of small market moves. While they collect lower premiums than straddles, they provide wider break-even points. Additionally, entering a long strangle position is typically 30-50% cheaper than a long straddle. For instance, if NVDA trades at $900 in January 2026, a long strangle using an $850 put and a $950 call would cost $55, compared to $90 for a long straddle. The break-even points would be $795 and $1,005.
Martin, an investor and blogger at Economagic, explains:
"The choice between these strategies depends on the trader's market outlook and risk tolerance. If there's an expectation of a substantial price movement, but the direction is uncertain, the straddle might be more suitable."
For sideways markets, short strangles are a better fit if implied volatility is high enough to generate decent premiums while maintaining wider break-even points. Many traders close their short strangles early - at 50-65% of maximum profit - to avoid late-stage volatility risks. To limit risk, you can convert a short strangle into an "iron condor" by buying further OTM options.
Pairs Trading: Long-Short Market-Neutral Positions
Pairs trading takes a different approach, focusing on the relationship between two correlated assets. This strategy works well in range-bound markets by exploiting mean reversion. You simultaneously go long on one asset and short on another, aiming to profit from their price divergence and eventual convergence.
This method is market-neutral, meaning overall market trends don't impact your position. By balancing the dollar value of your positions (dollar-neutral), you reduce portfolio volatility and achieve more stable performance during different economic cycles.
To create a strong pair, start by checking the correlation coefficient between two assets. A correlation of 0.7 or higher is ideal. Examples of common pairs include:
- Coca-Cola (KO) vs. Pepsi (PEP)
- Exxon (XOM) vs. Chevron (CVX)
- SPY vs. IVV
- EUR/USD vs. GBP/USD
Use a 6-12 month look-back period to confirm a consistent relationship and test for cointegration to ensure the assets move together over time. Enter trades when the price spread deviates 1–2 standard deviations from the mean. For risk management, set ATR (Average True Range) stop-loss levels or exit if the spread moves beyond +/- 3 standard deviations. Keep an eye on correlations weekly, as relationships can shift over time. Avoid trading pairs during earnings announcements or when the fundamental link between the assets changes.
With proper filters, systematic pairs traders can achieve annual returns of 15–35%. The clearest signals often appear on daily and 4-hour charts.
Running Neutral Strategies with QuantVPS
Neutral strategies thrive on uninterrupted operations and minimal latency. When managing multi-leg options positions or tracking correlated pairs, even a slight delay or downtime can turn a promising trade into a loss. QuantVPS is designed to tackle these challenges with low-latency execution, round-the-clock uptime, and compatibility with platforms like NinjaTrader, MetaTrader 4/5, Tradovate, and MultiCharts. This infrastructure ensures that multi-leg options and correlated pairs perform smoothly without interruptions.
In the week of April 26, 2026, QuantVPS handled over $89 billion in trading volume, showcasing its ability to support complex and high-frequency strategies. For neutral trades, especially in range-bound markets, quick order execution and minimal slippage are crucial, as these strategies often operate on tight profit margins.
QuantVPS integrates with all essential data feeds, including Rithmic, CQG, dxFeed, TT, and IQFeed, ensuring you have accurate market data at all times. The platform’s 1Gbps network with 10Gbps burst capability ensures fast data updates for multi-leg trades. Additionally, its NVMe SSD storage provides rapid access to historical data and speeds up application loading.
Stay online and closer to execution. Choose a VPS location for CME futures, New York markets, London FX, API trading, and more.
Host your platform near the market route that matters.
From $59.99/mo
| Strategy Type | Ideal Market Condition | QuantVPS Benefit |
|---|---|---|
| Options Straddle | High Volatility / Breakout | Fast execution reduces the impact of high Theta decay in ATM options. |
| Options Strangle | Delayed Volatility | Reliable uptime ensures positions remain active across wider break-even ranges. |
These advantages extend to enhanced monitoring and trade management. With multi-monitor RDP support, you can simultaneously track pairs trades and multi-leg options positions. This feature is especially useful for managing multiple positions or monitoring real-time changes in market correlations.
Choosing the right QuantVPS plan is essential to meet the demands of your trading strategy.
Selecting the Right QuantVPS Plan for Range-Bound Trading
Your plan should match the complexity of your strategy and your charting needs. For a single short strangle position with basic monitoring, the VPS Lite plan is sufficient. However, if you’re managing multiple pairs trades or monitoring several charts simultaneously, VPS Pro or VPS Ultra provides the necessary CPU power and RAM for smooth performance.
| Plan | Monthly Cost (Annual) | CPU Cores | RAM | NVMe Storage | Best For |
|---|---|---|---|---|---|
| VPS Lite | $41.99 | 4 | 8GB | 70GB | 1–2 charts, single strategy |
| VPS Pro | $69.99 | 6 | 16GB | 150GB | 3–5 charts, moderate-frequency trading |
| VPS Ultra | $132.99 | 24 | 64GB | 500GB | 5–7 charts, high-frequency trading |
| Dedicated Server | $209.99 | 16+ | 128GB | 2TB+ | 7+ charts, institutional-grade workloads |
For traders conducting systematic pairs strategies with backtesting requirements, VPS Ultra or Dedicated Server plans are ideal. The 24 cores and 64GB RAM of VPS Ultra can handle 5–7 charts alongside backtesting operations. Meanwhile, Dedicated Servers are built for institutional-grade needs, supporting 6+ charts and heavy data processing.
All QuantVPS plans come with Windows Server 2022, unmetered bandwidth, and DDoS protection. Multi-monitor support varies by plan: VPS Pro supports up to 2 monitors, VPS Ultra supports up to 4, and Dedicated Servers support up to 6 monitors.
Risk Management for Sideways Markets
Neutral strategies operate on slim profit margins, making effective risk management absolutely critical. Without proper safeguards, unexpected market movements - like a false breakout or a sudden volatility spike - can quickly wipe out gains. The key to success in these markets is to limit your position sizes and place stop-losses carefully to navigate the frequent whipsaws that come with range-bound trading.
Position Sizing and Stop-Loss Placement
For neutral strategies, a good rule of thumb is to limit each position to about 1% of your total trading capital. This conservative approach minimizes exposure to the unpredictable risks - often referred to as "fat-tail" events - that can arise in sideways markets. For instance, with a $50,000 account, you’d risk no more than $500 per trade.
When using options-based strategies, position sizing is a bit different since your maximum risk is predefined. Take a long straddle or strangle, for example: your total risk equals the premium paid. If a straddle costs $90 per contract, your maximum loss is $90 per contract. To calculate how many contracts to trade, divide your 1% risk budget by the premium cost.
Stop-loss placement in sideways markets also demands precision. It's best to place stops just beyond support or resistance levels - about 1.5× the channel range - to filter out normal price fluctuations. For options strategies like iron condors, the "wings" (long options) naturally limit your maximum loss, acting like built-in stop-losses.
| Strategy Type | Position Sizing Method | Stop-Loss Placement |
|---|---|---|
| Pairs Trading | Volatility of the spread × risk budget | 1.5× the range or at correlation breakdown |
| Long Straddle/Strangle | Premium cost ÷ 1% capital risk | Maximum loss = premium paid (defined risk) |
| Iron Condor | Width of wings × risk tolerance | Long wings define max loss |
Once you've established position sizes and stop-losses, keep adjusting them to align with changing market conditions.
Monitoring Volatility and Adjusting Your Strategy
Beyond setting stops and position sizes, actively monitoring volatility is crucial to protecting your trades. Sideways markets are rarely static - volatility can spike suddenly due to earnings announcements, news, or broader market events. Keeping an eye on implied volatility (IV) lets you adapt before these shifts impact your positions. Tools like the VIX Index, IV Rank, or IV Percentile can help you determine whether volatility is expanding or contracting.
When volatility increases, consider widening your strikes. For instance, you might switch from a short straddle to a short strangle to reduce gamma exposure and expand your profit zone.
It’s also important to watch for the gamma flip level - the point where the market shifts from a stable, mean-reverting behavior (positive gamma) to a more volatile, trending behavior (negative gamma). If prices fall below this level, close your neutral positions immediately. At this point, small price movements can quickly spiral into large losses.
To further protect your capital, use dynamic position sizing based on volatility conditions. A VRP (Volatility Risk Premium) Z-score can guide your exposure:
- Use maximum size when the VRP Z-score exceeds 2.0.
- Scale down to 50–75% when the Z-score is between 0.5 and 1.5.
- Close positions entirely if the Z-score drops below -1.0.
Finally, implement automatic halts if your performance veers far from historical norms. For example, if a pairs trade suddenly loses its correlation or an iron condor gets tested earlier than expected, it’s better to exit the position than to rely on hope for a reversal. In neutral strategies, protecting your capital is more important than squeezing out every last bit of profit.
Conclusion
Sideways markets account for 70% to 80% of trading time in futures markets. This makes understanding neutral strategies a valuable tool for navigating such conditions. By focusing on technical tools like Bollinger Bands - where 95% of price action stays within ±2 standard deviations - and RSI readings between 40 and 60, traders can identify range-bound conditions. From there, strategies that benefit from time decay and mean reversion can be deployed, avoiding reliance on directional price movements.
Neutral strategies like Options Straddles, Options Strangles, and Pairs Trading cater to different scenarios and levels of risk. For example:
- Straddles are ideal when expecting significant volatility spikes.
- Strangles provide flexibility for wider price ranges as volatility increases.
- Pairs Trading, which requires a correlation coefficient above 0.80, thrives on temporary price divergences between related assets like PEP and KO.
However, success in these strategies often hinges on precise execution. Multi-leg options trades or simultaneous pairs entries demand low-latency systems to capitalize on narrow profit margins quickly. Platforms like QuantVPS can provide the necessary infrastructure, offering low-latency execution and reliable uptime - whether you're running automated strangles at 45 days to expiration (DTE) or watching Z-score triggers near ±2.0 standard deviations.
Risk management remains the backbone of long-term profitability. Stick to strict rules: limit individual trades to 1% of account size, set stop-losses at 1.5× the trading range, and take profits with discipline. As conditions shift, keep an eye on implied volatility to adjust your strategies - moving from tighter straddles to wider strangles as needed to allow for increased price movement.
In practice, start by confirming range-bound conditions with tools like ADX readings below 25. Then, choose the appropriate strategy for the current volatility, execute trades with precision, and manage risks rigorously. Sideways markets reward patience and careful planning, and automated systems can help reinforce these habits. By applying these strategies with discipline, traders can consistently find opportunities in range-bound markets.
FAQs
How do I know a market is truly sideways and not about to break out?
A sideways market is characterized by prices moving back and forth between well-defined support and resistance levels. This pattern is often accompanied by steady trading volume and minimal price swings, indicating low volatility.
What to look for? Oscillators like the Relative Strength Index (RSI) are useful tools here, as they can confirm that the market is consolidating within a specific range. Additionally, the absence of strong momentum signals - like sharp increases in trading volume or divergence in momentum indicators - typically points to a range-bound market rather than one gearing up for a breakout.
When should I use a short straddle vs a short strangle?
A short straddle is a go-to strategy when you anticipate minimal price movement and low market volatility. It works by capitalizing on time decay, generating profits when the stock price stays close to the strike price of the sold call and put options.
On the other hand, a short strangle is better suited for situations where a broader price range is expected. This strategy involves selling out-of-the-money call and put options at different strike prices. The result? A wider profit zone, lower upfront costs, and reduced risk, all while still taking advantage of low volatility and time decay.
What’s the safest way to limit risk in pairs trading if correlation breaks?
The best way to reduce risk in pairs trading when correlation falters is by implementing strict stop-losses. These act as a safeguard against sudden market changes or structural shifts, helping to limit losses if the trade veers away from the original strategy.


