
Trading made simple: Combining moving averages with support and resistance levels can help traders identify high-probability zones for price action. Moving averages act as dynamic support or resistance, while horizontal levels highlight historical price reactions. Together, they create "confluence zones" where multiple factors align, improving trade timing and decision-making.
Key Takeaways:
- Moving Averages: Tools like the 50-day and 200-day SMAs are widely used to track trends and dynamic support/resistance.
- Support/Resistance: Horizontal levels show where price historically reacts, adding context to moving averages.
- Confluence Zones: When moving averages align with horizontal levels, they signal potential bounce or reversal points.
- Risk Management: Use stop-losses and volume analysis for better trade execution.
- Automation: Platforms like QuantVPS help execute strategies efficiently, especially in fast-moving markets.
By layering these tools, traders can reduce false signals and refine their strategies for trending markets. Always confirm trades with price action and volume for stronger setups.
Live trading strategy using moving averages & support and resistance
Moving Averages and How They Work in Trading
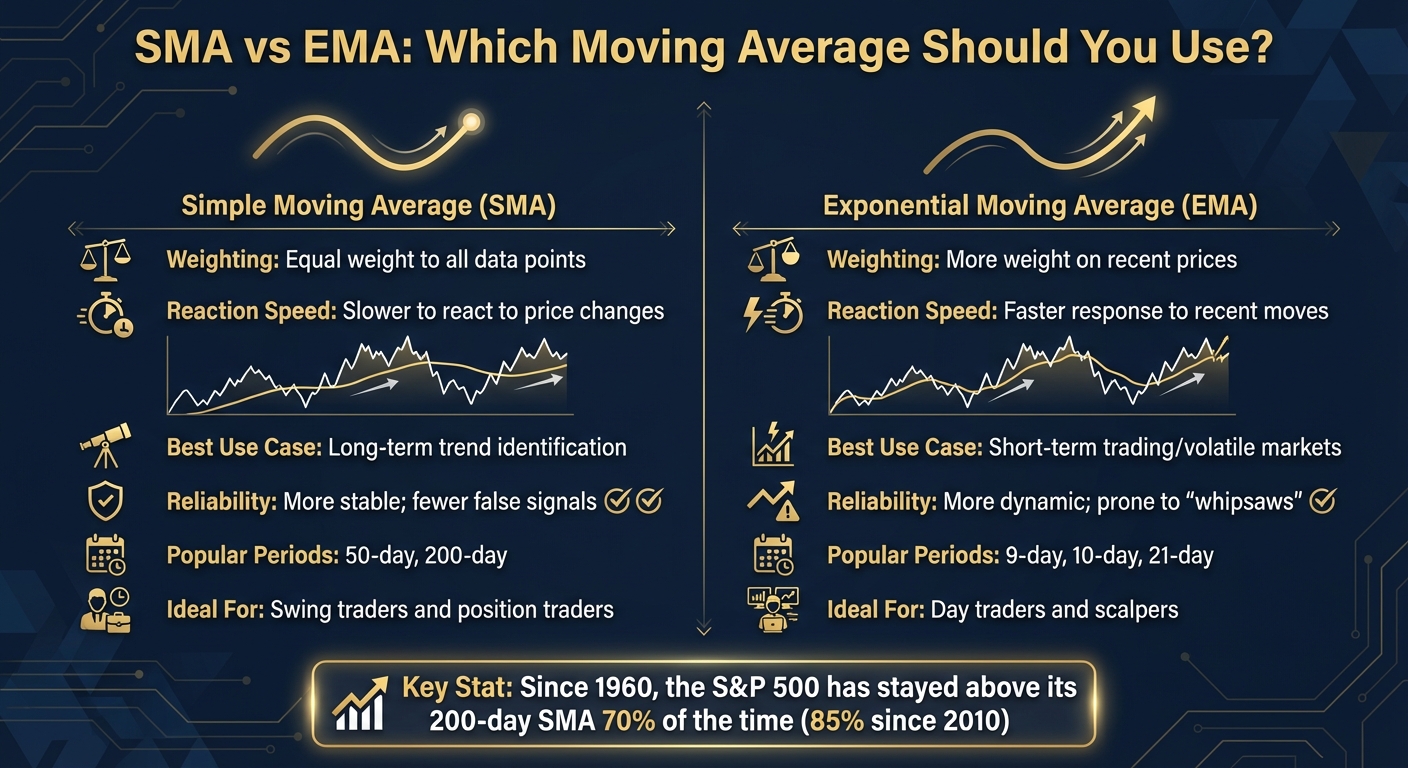
Simple Moving Average vs Exponential Moving Average Comparison Chart
Moving averages play an essential role in trading, especially when paired with classic support and resistance analysis. At their core, a moving average (MA) smooths out price fluctuations by calculating the average price of a security over a set period. This helps traders identify the market's overall direction. When the price stays above the moving average, it signals an uptrend; when it falls below, it indicates a downtrend. A steeply rising moving average reflects strong momentum, while a sharp decline points to bearish pressure.
First introduced by Charles Dow in the 1920s, moving averages have remained a trusted tool because they automatically adjust to recent price data. In an uptrend, they often act as a support level where prices tend to bounce. Conversely, in a downtrend, they serve as resistance, where prices may stall or reverse.
Types of Moving Averages
The two most commonly used types of moving averages are the Simple Moving Average (SMA) and the Exponential Moving Average (EMA).
- SMA: This averages all data points equally, making it slower to react to price changes but more stable. It's particularly useful for analyzing long-term trends and understanding the broader market direction.
- EMA: This gives more weight to recent price data, allowing it to respond faster to market changes. Its quick reaction makes it a favorite for short-term trading and volatile market conditions.
| Feature | Simple Moving Average (SMA) | Exponential Moving Average (EMA) |
|---|---|---|
| Weighting | Equal weight to all data points | More weight on recent prices |
| Reaction Speed | Slower to react to price changes | Faster response to recent moves |
| Best Use Case | Long-term trend identification | Short-term trading/volatile markets |
| Reliability | More stable; fewer false signals | More dynamic; prone to "whipsaws" |
Both SMA and EMA are lagging indicators, meaning they confirm trends after they have already started. Day traders often prefer faster EMAs like the 9, 10, or 21-period to capture quick shifts in trends. Meanwhile, swing and position traders lean on longer SMAs, such as the 50 or 200-period, to track broader market movements.
How Moving Averages Function as Support and Resistance
Moving averages act as dynamic support or resistance levels, depending on their position relative to the current price. When prices are above a moving average, it serves as support, and when below, it acts as resistance. Unlike fixed horizontal lines, moving averages adjust automatically as new price data comes in, reflecting changes in market sentiment. This makes them especially effective in trending markets, where they help identify reaction zones during pullbacks or rallies.
"Moving averages adjust automatically to recent price movements, unlike fixed support and resistance lines. This automatic adjustment helps traders identify reaction zones without needing constant manual updates." - Sean Mackey, Founder & CEO, LuxAlgo
Among moving averages, the 50-period and 200-period are particularly influential. These levels are closely watched by institutional traders, often leading to significant buying or selling activity. When prices break through a moving average, its role typically reverses - a broken support level becomes resistance, and vice versa. However, in sideways or choppy markets, moving averages lose their reliability, as prices frequently cross them, creating false signals. To maximize their effectiveness, only trade bounces when the moving average shows a clear upward or downward slope. Flat moving averages are less dependable and may not provide meaningful insights. This adaptability makes moving averages a valuable tool for pinpointing support and resistance zones in trending markets.
Finding Support and Resistance Levels with Moving Averages
Run 24/7 while you sleep. Keep bots, platforms, and trade copiers online on a dedicated VPS.
Low-latency VPS hosting for your trading platform.
From $59.99/mo
Once you’ve grasped how moving averages (MAs) work, the next step is identifying their most reliable support and resistance zones. This builds on their dynamic roles and ties into the concept of confluence - where multiple indicators strengthen the validity of a price level.
Using the 50-Day and 200-Day Moving Averages
The 50-day and 200-day simple moving averages (SMAs) are among the most widely followed levels in trading. The 50-day SMA reflects about two months of trading activity, while the 200-day SMA captures roughly a year’s worth of data. These timeframes naturally make them key reference points for both retail and institutional traders.
Their popularity as benchmarks gives these moving averages considerable influence. For instance, institutional investors often use the 200-day SMA to assess an asset’s long-term trend. When millions of traders monitor the same levels, they become psychological zones where buying or selling pressure tends to spike. As a result, prices frequently stall, bounce, or reverse near these averages.
"Prices are above the 50-day moving average, so the uptrend remains intact." - StockCharts
The interaction between the 50-day and 200-day SMAs also offers insights into market trends. When the 50-day SMA rises above the 200-day SMA, and both are sloping upward, it signals a strong uptrend. Conversely, when the 50-day SMA falls below the 200-day SMA and both slope downward, it indicates a strong downtrend. These relationships not only reveal trend strength but also help pinpoint optimal entry points during pullbacks .
Here’s a noteworthy statistic: since 1960, the S&P 500 has stayed above its 200-day SMA 70% of the time. That figure has increased to 85% since 2010. This underscores the 200-day SMA’s reliability as a support level during bull markets.
Now, let’s see how combining these moving averages with horizontal levels can refine your trading strategy.
Aligning Horizontal Support/Resistance with Moving Averages
While major moving averages like the 50-day and 200-day SMAs are powerful on their own, combining them with horizontal support and resistance levels can make them even more effective. The strongest trading signals often occur when a horizontal level aligns with a key moving average, creating what traders refer to as a "confluence" or "cluster" . Think of it as multiple layers of evidence pointing to the same price zone.
These intersections should be treated as zones rather than exact points . Markets rarely respect precise levels, so allow for some flexibility - perhaps a few points above or below. For example, if the 200-day SMA aligns with a previous swing low or a round number like $100, the combination of psychological and institutional factors can amplify its significance .
"My metric for everything I look at is the 200-day moving average of closing prices... If you use the 200-day moving average rule, then you get out. You play defense, and you get out." - Paul Tudor Jones, founder of Tudor Investment Corporation
To improve your accuracy, wait for confirmation from price action before making a move. Don’t rush into a trade the moment price touches a moving average or horizontal level. Instead, wait for a clear signal, such as a candle closing beyond the level or a rejection pattern like a bullish engulfing candle . And remember, strong moves are often accompanied by high trading volume - a bounce or breakout on low volume is far less reliable.
Finally, consider using multi-timeframe analysis to fine-tune your entries. Identify key levels on higher timeframes, such as the daily or 4-hour chart, and then zoom in to lower timeframes, like 15- or 5-minute charts, to find precise entry points. This layered approach minimizes the risk of entering too early while still allowing you to capture the move effectively.
How to Combine Moving Averages with Support/Resistance
Now that you’ve learned how to spot key levels, let’s dive into combining moving averages with support and resistance for a practical trading strategy. The idea here is to layer multiple confirmations before entering a trade, which helps reduce false signals and increases your chances of success.
Step 1: Use Moving Average Crossovers to Confirm the Trend
Start by determining the overall trend using moving average crossovers. A Golden Cross, where the 50-period moving average crosses above the 200-period moving average, signals a long-term uptrend - this is your cue to look for buying opportunities. On the flip side, a Death Cross, where the 50-period moving average drops below the 200-period moving average, points to a downtrend, making it ideal for short setups.
Keep in mind that crossovers confirm trends after they’ve already started. They’re great for validating momentum but not as useful in sideways or consolidating markets, where they can lead to "whipsaws" or false signals. Once you’ve identified a solid trend, you can move on to pinpointing pullback zones.
Step 2: Monitor Price Behavior at Moving Average Levels
After confirming the trend, watch for price to pull back to a moving average that aligns with a horizontal support or resistance level. For quick-moving trends, the 20 EMA is a reliable guide for shallow pullbacks. For deeper pullbacks or re-entry points, the 50 SMA is often more effective. Treat these moving averages as zones rather than precise levels.
"Don't just wait to see if price bounces. Anticipate where and why it might bounce - then look for confirmation." - Jasper Osita, Market Analyst, ACY Securities
Pay close attention to how price reacts at these levels. Does it pause, form a rejection wick, or reverse sharply? If a moving average that previously acted as support is broken, it often flips into resistance (a phenomenon known as "role reversal"). This flip can create excellent opportunities for short entries.
Step 3: Look for Volume and Candlestick Pattern Confirmation
Before entering a trade, wait for confirmation through candlestick patterns and volume. Patterns like a bullish engulfing candle or a hammer at support indicate strong buying interest, while a bearish marubozu at resistance suggests selling pressure.
Volume adds another layer of confirmation. A bounce off a moving average with high volume signals strength. High-probability setups often involve a liquidity sweep into the moving average, followed by a strong, high-volume move. On the other hand, if volume is low during a bounce or breakout, the signal is less reliable.
For even more precision, combine moving averages with momentum indicators like the RSI (Relative Strength Index). For example, if the price touches a 50-day moving average support while the RSI is below 30 (indicating oversold conditions), the chances of a successful bounce increase significantly.
Step 4: Manage Risk with Stop-Losses and Profit Targets
Once you’ve identified your entry, set a protective stop-loss. A good rule of thumb is to place your stop 3–5 points below the moving average to account for minor price fluctuations. Alternatively, you can set it below the recent swing low or directly below the moving average itself. This gives the trade enough breathing room while still capping potential losses.
For profit targets, look at the next major resistance level or use a trailing stop that follows the 20 EMA to lock in gains as the trend advances. Stick to a disciplined risk management plan like the 3-5-7 rule: risk 3% per trade, limit total exposure to 5%, and aim for a 7% profit target. This ensures that your winning trades outweigh your losses over time.
| Price Action Pattern | Signal Type | Confirmation Requirement |
|---|---|---|
| Price Break Above MA | Bullish | Strong volume + upward-moving MA slope |
| Price Break Below MA | Bearish | Strong volume + downward-moving MA slope |
| Price Bounce Off MA | Continuation | Bullish or bearish candlestick pattern at MA |
To refine your entries, identify trend zones on higher timeframes like the 1-hour or 4-hour chart. Then, switch to lower timeframes, such as the 15-minute or 5-minute chart, to wait for a breakout or engulfing candle. This "sniper entry" approach helps you avoid entering too early while still capturing the move effectively.
Optimizing and Backtesting the Strategy for Different Markets
Adjusting Moving Average Settings for Different Trading Styles
Your moving average settings should align with your trading style and the current market environment. For day traders, faster-reacting EMAs like the 9/21 combination are ideal. These shorter periods (under 20) are great for capturing quick momentum shifts, especially in mean-reversion strategies, where profits come from rapid price bounces.
Stay online and closer to execution. Choose a VPS location for CME futures, New York markets, London FX, API trading, and more.
Host your platform near the market route that matters.
From $59.99/mo
On the other hand, swing traders and position traders often rely on the 20/50/200 SMA setup. This combination helps identify major trend changes and pinpoint long-term support or resistance levels. Simple Moving Averages work better for these traders due to their stability when applied to daily timeframes.
Market conditions are just as crucial as your trading style. In trending markets, moving averages serve as dynamic support and resistance levels. However, in ranging or sideways markets, they often generate false signals, known as "whipsaws", as prices repeatedly cross the averages without establishing clear direction. If you notice consolidation, avoid using moving average crossover strategies - they tend to fail in trendless environments. Instead, consider Moving Average Envelopes set at 3% above and below your moving average. These can help identify overbought or oversold extremes during periods of low volatility.
Customizing your settings based on these factors lays the groundwork for effective backtesting and strategy refinement.
Backtesting the Strategy with QuantVPS
After fine-tuning your moving average settings, backtesting is essential to validate your strategy before committing real money. Focus on key metrics like expectancy (the average profit per trade), reward-to-risk ratio (aim for at least 2:1), and maximum drawdown (the largest loss from a peak in your account). These figures reveal whether your strategy is truly profitable, beyond just its win rate.
QuantVPS is a powerful tool for backtesting, offering ultra-low latency and reliable uptime. This ensures smooth processing of historical data without interruptions or slippage issues. Its dedicated resources and NVMe storage allow for seamless backtesting across years of tick data. For day traders conducting high-frequency tests, the VPS Pro plan ($99.99/month or $69.99/month billed annually) provides 6 cores and 16 GB of RAM, capable of running 3–5 charts simultaneously. More demanding workloads can benefit from the VPS Ultra plan, which offers 24 cores and 64 GB of RAM, supporting 5–7 charts and up to 4 monitors.
When analyzing backtest results, adjust for transaction costs and spreads, as these can significantly impact profitability, especially in scalping or day trading strategies. Additionally, keep a detailed trading journal during the backtesting phase. Document specifics such as the moving average tested (e.g., 20 EMA vs. 50 SMA), the higher timeframe trend, the price action confirmation patterns used, and the final outcome. This record-keeping helps identify which setups perform best under various market conditions, allowing you to refine and improve your strategy over time.
Automating Your Trading with QuantVPS
Running Automated Strategies with QuantVPS
Once you've backtested your trading strategy, automation takes it a step further by ensuring precise and timely trade execution. If your strategy relies on moving averages to determine entry and exit points, automation can help you act on these signals without hesitation. For instance, Expert Advisors (EAs) on platforms like MT4 or MT5 can monitor dynamic levels - such as the 20 EMA and 50 SMA - and execute trades as soon as price touches these zones. This is especially useful for lower timeframes (like M1, M5, or M15), where even a brief delay can mean missing critical opportunities.
QuantVPS provides lightning-fast order processing, clocking in at under 30 ms, which ensures trades are executed instantly at key support or resistance levels. This kind of speed becomes crucial during high-volatility events, such as Non-Farm Payroll (NFP) or Consumer Price Index (CPI) releases, when prices often test significant levels like the 200-day SMA.
As Jasper Osita from ACY Securities notes, "MAs often act as magnet zones - places where price pauses, bounces, or reverses".
For more complex strategies, such as those using Moving Average Ribbons (which involve up to 10 moving averages) or multi-timeframe setups, you'll need a VPS with enough processing power to keep up. QuantVPS offers plans tailored for such demands. The VPS Pro plan, priced at $99.99 per month (or $69.99 per month if billed annually), includes 6 cores and 16 GB of RAM, supporting 3–5 charts. For even more resource-intensive setups, the VPS Ultra plan features 24 cores and 64 GB of RAM, ideal for running 5–7 charts seamlessly. These high-performance VPS options ensure your strategies operate efficiently and without lag.
Using QuantVPS for Reliable System Management
Speed is just one piece of the puzzle - reliability is equally critical for automated trading. Strategies that combine moving averages with support and resistance levels require uninterrupted uptime to catch important signals. Patterns like the "Golden Cross" (when the 50-day MA crosses above the 200-day MA) or the "Death Cross" may take days to form, but execution must be immediate once they occur. QuantVPS ensures continuous connectivity, so your system is always ready to act when the moment arrives. This reliability is especially important for capturing trades at confluence zones, where moving averages overlap with horizontal support or resistance.
To protect your system during high-traffic market events, QuantVPS includes robust DDoS protection. These safeguards are particularly valuable during moments when thousands of traders are watching the same moving average levels. As Shain Vernier from HowToTrade explains, "the reason moving averages are so powerful as support and resistance levels... ultimately, it all comes down to peer pressure and the fact that thousands and thousands of traders use moving averages".
With nearly 90% of traders relying on moving averages like the 10-, 20-, 50-, 100-, or 200-period MAs, these levels naturally attract intense activity. QuantVPS’s infrastructure is designed to handle this pressure, keeping your automated strategies running smoothly, even when the market is hyper-focused on key levels like the 200-day SMA.
Conclusion
Using moving averages alongside support and resistance can reshape your trading approach, turning static lines into dynamic zones that adapt to market shifts. The 50-day and 200-day moving averages, in particular, serve as psychological markers - key levels monitored by the majority of traders. These levels often create zones where prices either bounce or reverse.
To refine your strategy, incorporate multiple confirmations. As Christian Norman from OANDA explains:
"Traders should look to build 'confluences' within their trading strategies, where multiple forms of analysis... come to the same consensus".
Instead of reacting immediately when the price touches a moving average, look for additional signals like candlestick patterns, volume surges, or alignment across multiple timeframes. This allows you to anticipate potential bounces and set your stop-loss with more precision.
Backtesting plays a key role in understanding how different moving averages perform under various market conditions. For instance, EMAs tend to work well in trending markets but might produce false signals during sideways movements. On the other hand, SMAs provide more stable support but respond more slowly to price changes . Testing historical data can help you determine which combination aligns with your trading style.
For those using automated strategies, platforms like QuantVPS ensure ultra-low latency and uninterrupted uptime, enabling your Expert Advisors to capture critical signals without delay.
FAQs
How can moving averages and support/resistance levels work together to improve trading decisions?
Moving averages, like the 50-day or 200-day simple moving averages (SMAs), often serve as support or resistance levels that adapt to price changes over time. When the price stays above a moving average, it tends to act as a support level. Conversely, when the price dips below it, the moving average often functions as resistance. On the other hand, traditional horizontal support and resistance zones - drawn from previous highs, lows, or trendline intersections - highlight areas where significant buying or selling activity has occurred in the past.
When a moving average aligns with a horizontal support or resistance zone, it creates what’s called a confluence zone. This is a key area where dynamic signals from the moving average and static signals from historical price levels come together, reinforcing each other. These zones often catch the eye of traders, as they increase the chances of notable price movements, such as sharp bounces or decisive breakouts. For instance, if the 50-day SMA coincides with a prior resistance level, it could signal a strong opportunity for entering or exiting a trade, depending on the price’s direction.
By using moving averages alongside horizontal levels, traders can fine-tune their strategies, spot more reliable trade setups, and enhance both manual and automated trading decisions.
What is the difference between a Simple Moving Average (SMA) and an Exponential Moving Average (EMA) in trading?
The Simple Moving Average (SMA) treats all prices within its calculation period equally, which results in a slower response to price fluctuations. Because of this, the SMA is often used to evaluate longer-term trends, offering a broader perspective on market movements.
On the other hand, the Exponential Moving Average (EMA) places greater emphasis on recent prices. This weighting allows it to react more quickly to changes in the market, making it a preferred tool for spotting short-term trading opportunities and adapting to rapid market shifts.
Both SMA and EMA have their place in trading, but their usefulness largely depends on your specific strategy and the market conditions you're analyzing.
How does automation improve the use of moving average strategies in trading?
Automation takes moving average strategies to the next level by making the process faster, more consistent, and free of emotional bias. Automated systems can monitor price data around the clock, calculate different types of moving averages - like simple, exponential, or weighted - and instantly detect important signals such as crossovers or interactions with support and resistance levels. This ensures trades are executed with precision, whether during overnight trading hours or when traders are unavailable.
Beyond just identifying signals, automation simplifies both backtesting and live execution. Traders can test strategies on historical data and apply the same logic seamlessly in real-time markets. These systems also promote disciplined risk management, eliminate emotional decision-making, and tweak parameters based on performance metrics. By relying on data-driven processes, automation reduces missed opportunities and increases the overall efficiency of trading strategies.


