
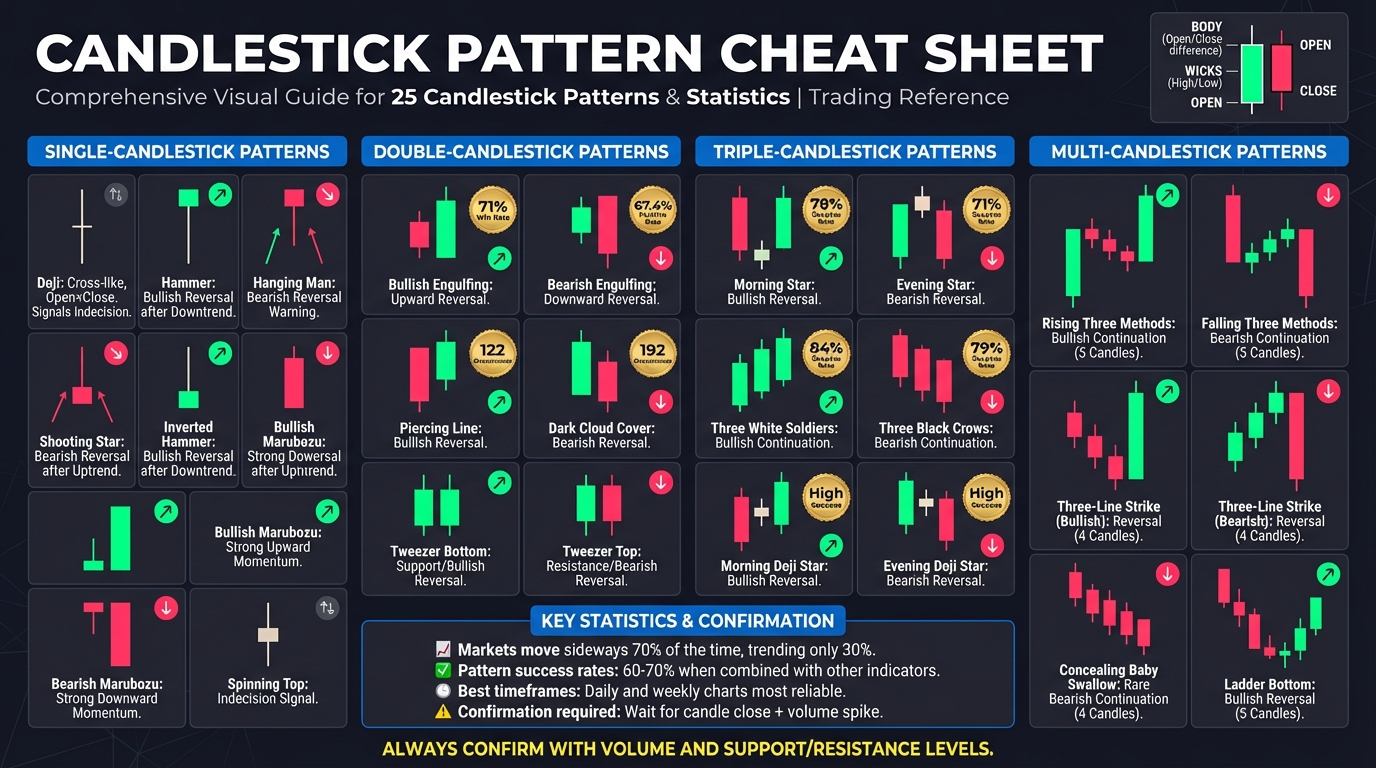
Candlestick patterns are a key tool for traders to interpret market sentiment and predict price movements. This guide highlights 25 essential patterns, grouped into single, double, and triple-candlestick setups, providing actionable insights for identifying market reversals and continuations. Here’s what you need to know:
- Single-Candlestick Patterns: Quick indicators of market sentiment, such as the Doji (indecision), Hammer (bullish reversal), or Shooting Star (bearish reversal). Context and confirmation from the next candle are critical.
- Double-Candlestick Patterns: More reliable signals like Bullish/Bearish Engulfing or Piercing Line/Dark Cloud Cover patterns. These often indicate trend reversals when confirmed by volume or key support and resistance levels.
- Triple-Candlestick Patterns: Stronger setups like Morning Star (bullish reversal) or Three Black Crows (bearish continuation). These patterns offer clearer momentum shifts over three sessions.
Candlestick patterns work best when paired with other tools like volume analysis or support/resistance levels. For high-performance trading, tools like QuantVPS ensure fast order execution during critical market moments.
Key takeaway: Understanding candlestick patterns and their context can improve your trading decisions, especially when combined with proper confirmation and tools for speed and accuracy.
How to Read Candlesticks as a Beginner?
Most beginners memorize candlestick names and still feel lost on live charts. Reading candlesticks well is not about recognizing shapes — it's about understanding what price behavior reveals about who is in control at any given moment.
"The shape of a candlestick is not the signal — the story of buyer vs. seller control behind that shape is what separates profitable readers from confused beginners." — Investopedia, Trading Fundamentals
💡 Tip: Before memorizing pattern names like Doji, Hammer, or Engulfing, train yourself to ask one question first: who won this candle — buyers or sellers?
⚠️ Warning: The most common beginner mistake is pattern-matching without context. A Hammer candle in the middle of a trend means something entirely different than one at a key support level.
| Candlestick Element | What It Reveals |
|---|---|
| Long upper wick | Buyers pushed the price up, but sellers took back control |
| Long lower wick | Sellers pushed the price down, but buyers rejected the move |
| Large body | One side — buyer or seller — had dominant control |
| Small body | Indecision between buyers and sellers |
| Close near high | Bullish strength — buyers finished in control |
| Close near low | Bearish strength — sellers finished in control |
What Candlestick Patterns Really Represent
Candlestick patterns are a visual record of price movement during a specific period and what that movement reveals about trader behavior. According to Dukascopy Bank SA, candlestick charts were developed by Japanese rice merchants over 300 years ago in the 18th century. This long history suggests the method works, not merely that it's popular. When read correctly, candlesticks show shifts in pressure, hesitation, and momentum before most indicators react.
Candle Anatomy: What You're Actually Looking At
Every candlestick has two parts: the body, a thick rectangular block showing the range between the open and close, and the wicks (or shadows), thin lines extending above and below the body that mark the high and low prices reached during that period.
Color tells you the direction at a glance. A green or white body means the close was higher than the open (buyers won). A red or black body means the close was lower than the open (sellers won). Check your charting platform, as colors are a common practice rather than a universal rule, and some traders customize them.
A single candle represents whatever period your chart is set to. On a 1-minute chart, each candle shows 60 seconds of activity; on a daily chart, each candle compresses an entire day. The anatomy stays the same; only the timeframe changes what story it tells.
The OHLC Story (Market Psychology in One Candle)
Dukascopy Bank SA reports that each candlestick represents four key price points: open, high, low, and close within a single time period. The open signals early market sentiment: a strong open shows confidence, while a weak open indicates sellers are in control. The high and low show price movement in both directions. The close determines the candle's outcome: which side finished stronger.
A long upper wick means buyers pushed the price significantly higher, sellers stepped in aggressively at that elevated level, and the price closed well below the high. This represents buying pressure that got rejected.
Price opens and falls sharply as sellers take control. Buyers step back in around support, push the price back up steadily, and the candle closes near its high. That single candle tells you buyers absorbed the selling pressure and regained control without needing an indicator.
Candlesticks Are Not Magic Signals
A trader spots a textbook hammer or bullish engulfing candle, enters immediately, and gets stopped out. The pattern looked perfect. The context was wrong. A candlestick pattern only shows what happened—it does not predict what comes next with certainty. The same hammer that signals a powerful reversal near major support is noise when it forms in the middle of a downtrend with no surrounding structure.
Most traders scan charts for familiar shapes and treat each pattern as an independent signal. That approach works occasionally, which is why it's hard to abandon. But as market conditions shift, pattern-only trading yields inconsistent results because the same candle can mean different things in different locations. Candlesticks gain meaning when they appear near support, resistance, trendlines, or key breakout zones, and when price confirms the move in the candles that follow. One candle is a clue. A cluster of candles in the right place, with volume behind them, is a conversation worth listening to.
Before trusting any candle, ask three questions: What's the broader trend doing? Is this candle forming near support or resistance, or floating in open space? Did the next candle confirm the move, or reverse it? A candle that passes all three tests warrants attention. One that fails even one is probably noise.
Knowing how to read a single candle is only half the equation; the real test begins when you start trading those signals in real time.
25 Essential Candlestick Patterns Quick Reference Guide
Single-Candlestick Patterns
Single-candlestick patterns provide a quick glimpse into market sentiment, distilling the ongoing tussle between buyers and sellers into a single, clear shape. Each candle captures the emotions driving the market - whether it's fear, greed, or hesitation. The candle's body reflects the range between the open and close prices, while the wicks show the highest and lowest points reached during the session.
However, these patterns don’t exist in isolation - context matters. For instance, a candle with a small body and a long lower wick can signal two completely different outcomes depending on its position. After a downtrend, it’s called a bullish Hammer, hinting at one of several bullish reversal patterns. But after an uptrend, the same shape becomes a bearish Hanging Man, signaling bearish reversal patterns may be forming. Confirmation is crucial - watch for the next candle to validate the signal, like a higher close after a Hammer. High trading volume can strengthen these signals, and patterns on daily or weekly charts tend to be more reliable than those on shorter timeframes. Let’s break down some key single-candlestick patterns and what they reveal about market dynamics.
Doji
A Doji forms when a candle's open and close prices are nearly identical, creating a cross-like appearance. This pattern signals a stalemate between buyers and sellers.
Run 24/7 while you sleep. Keep bots, platforms, and trade copiers online on a dedicated VPS.
Low-latency VPS hosting for your trading platform.
From $59.99/mo
"A Doji represents indecision in the market. During the period of the Doji, neither buyers nor sellers could gain control, and the result was essentially a draw." - PriceActionNinja
While a Doji doesn’t predict the next move on its own, it often suggests that the current trend is losing steam. In an uptrend, it may hint that buyers are running out of momentum. In a downtrend, it could mean that selling pressure is easing. The key is watching the next candle to see if the market shifts direction or resumes its path. Traders often use this follow-up action to decide whether to enter or exit a position.
Hammer and Hanging Man
The Hammer and Hanging Man share a similar look: a small body near the top of the candle with a long lower wick that’s at least twice the body’s length. The difference lies in their context.
- Hammer: Appears after a downtrend and signals a potential bullish reversal. The long lower wick shows that sellers drove prices down, but buyers stepped in to push them back up by the close.
- Hanging Man: Forms after an uptrend, warning of a possible bearish reversal. Although it looks identical to the Hammer, it suggests that selling pressure is starting to challenge buyer dominance.
High trading volume can make these patterns more reliable, as it shows strong market participation. Both patterns are valuable for spotting potential reversals.
Shooting Star and Inverted Hammer
These patterns are the vertical opposites of the Hammer and Hanging Man, with a small body near the bottom and a long upper wick.
- Shooting Star: Appears after an uptrend, signaling a bearish reversal. The long upper wick shows that buyers tried to push prices higher, but sellers regained control by the close.
- Inverted Hammer: Shows up after a downtrend and hints at a bullish reversal. Its long upper wick indicates that buyers tested higher prices, and although sellers pushed back, the effort suggests a potential shift in momentum.
Marubozu (Bullish and Bearish)
The Marubozu is characterized by a long body with little to no wicks, signaling complete control by either buyers or sellers.
- Bullish Marubozu: Typically green or white, this candle shows that buyers dominated from open to close, with prices steadily climbing throughout the session. It often suggests that the uptrend will continue.
- Bearish Marubozu: Usually red or black, this candle indicates that sellers controlled the session, driving prices down from the high at open to the low at close. It’s a strong sign of downward momentum.
These patterns often confirm an ongoing trend or mark the start of a new one after a period of sideways movement.
Spinning Top
The Spinning Top features a small body with long upper and lower wicks of roughly equal length. Unlike a Doji, which has almost no body, the Spinning Top shows slight movement between the open and close prices.
This pattern reflects indecision, with buyers and sellers testing extremes but failing to gain control. After a strong trend, a Spinning Top can signal that momentum is fading, possibly leading to consolidation or a reversal. The next few candles usually clarify whether the market will continue its direction or shift course. This pattern often sets the stage for more definitive signals in the near future.
Double-Candlestick Patterns
Double-candlestick patterns provide more reliable signals by combining two consecutive candles: the first sets the stage, while the second confirms the move. This two-step approach helps filter out the noise that can make single-candle patterns less dependable.
"Double candlestick patterns are formed by two consecutive candlesticks. They give stronger signals because there is confirmation from the second candlestick." - Alan Tsagaraev, Candlestick Analysis Expert, LiteFinance
These patterns reflect the balance - or imbalance - between supply and demand over two trading sessions. For instance, a Bearish Engulfing pattern following an uptrend doesn't just hint at weakness; the second candle completely overtakes the gains of the previous day, signaling strong seller control. Backtesting on the S&P 500 from 1993 to 2026 showed 276 trades using the Bearish Engulfing pattern, with a 71% win rate and an average gain of 0.56% per trade.
The effectiveness of these patterns often depends on context. They tend to perform best near key support or resistance levels or after extended trends. For example, a Piercing Line pattern forming at a major demand zone carries more weight than one appearing in a sideways market. To manage risk, consider placing stop-loss orders just below the low of a bullish pattern or above the high of a bearish pattern. Let’s explore some key double-candlestick patterns and their role in market reversals.
Bullish and Bearish Engulfing
Engulfing patterns are among the clearest indicators of potential market reversals. They occur when the second candle’s body completely envelops the first candle’s body, signaling a decisive shift in momentum.
Bullish Engulfing forms after a downtrend and signals a reversal to the upside. The first candle is small and bearish, showing that sellers are still in control. The second candle opens lower but then surges to close well above the first candle’s open, confirming buyer dominance. A study of large-cap stocks from 2017 to 2023 revealed that the Bullish Engulfing pattern had a five-day win rate of 71%. For example, on January 13, 2012, Philip Morris (PM) stock displayed a Bullish Engulfing pattern. The price opened at $76.22 and closed at $77.32, with the bullish candle overshadowing the prior day’s losses, signaling continued upward momentum.
Bearish Engulfing appears after an uptrend and indicates a potential reversal to the downside. A small bullish candle is followed by a large bearish one that opens higher and closes well below the first candle’s open, showing sellers have taken control. Interestingly, a study of 50 years of weekly S&P 500 data found that the market was positive 67.4% of the time one week after a Bearish Engulfing pattern appeared.
For automated trading strategies, ensure the second candle’s body is at least 150% the size of the first to confirm a strong momentum shift. A volume spike on the second candle can further validate the signal. Avoid trading these patterns in choppy, sideways markets where false signals are common.
Piercing Line and Dark Cloud Cover
These patterns are similar to Engulfing patterns but require the second candle to close beyond the 50% mark of the first candle’s body.
Piercing Line is a bullish reversal pattern that forms after a downtrend. The first candle is a long bearish one, followed by a bullish candle that gaps down at the open but rallies to close above the midpoint of the previous candle. This signals that buyers are regaining control.
"While the Bullish Engulfing shouts domination, the Piercing Pattern whispers a comeback, and that whisper is often more actionable when paired with Smart Money Concepts." - Jasper Osita, Market Analyst, ACY Securities
Backtesting the S&P 500 from 1993 to 2023 found 122 occurrences of the Piercing Line pattern. It’s particularly effective after a liquidity sweep below previous session lows or following a news-driven selloff.
Dark Cloud Cover is the bearish counterpart, appearing after an uptrend. A long bullish candle is followed by a bearish candle that opens higher but closes below the midpoint of the first candle, signaling that sellers are taking over. This pattern was observed 192 times in the same S&P 500 study and is most effective when the market is overextended or near major resistance levels.
For both patterns, wait for the second candle to close fully before entering a trade. Use additional confirmation tools, such as higher-timeframe levels like demand/supply zones or Fibonacci retracement levels. A volume spike on the second candle adds further credibility. For a Piercing Line, place the stop-loss below the second candle’s low; for Dark Cloud Cover, place it above the second candle’s high.
Tweezer Bottom and Tweezer Top
Tweezer patterns emphasize price rejection, focusing on identical or near-identical lows (Tweezer Bottom) or highs (Tweezer Top). These patterns highlight levels where the market has repeatedly rejected further movement.
Tweezer Bottom forms after a downtrend. Two candles test the same low, signaling that sellers have exhausted their momentum and buyers are stepping in. The first candle is often bearish, while the second can be bullish or neutral - the key is that both candles share the same low, suggesting a potential reversal.
Tweezer Top appears after an uptrend. Here, two candles reach the same high, showing that buyers have lost momentum and sellers are imposing resistance. The inability to break higher on the second attempt suggests a weakening uptrend.
These patterns are especially useful for pinpointing exact reversal points, as they highlight specific price levels where the market has rejected further movement. They are most effective at well-tested support or resistance zones. The candle following a Tweezer pattern typically confirms whether the reversal will hold or if the market will retest the level again.
| Pattern Type | Trend Context | First Candle | Second Candle | Signal |
|---|---|---|---|---|
| Bullish Engulfing | Downtrend | Small Bearish | Large Bullish (Engulfs 1st) | Upward Reversal |
| Bearish Engulfing | Uptrend | Small Bullish | Large Bearish (Engulfs 1st) | Downward Reversal |
| Piercing Line | Downtrend | Large Bearish | Bullish (Closes >50% of 1st) | Bullish Reversal |
| Dark Cloud Cover | Uptrend | Large Bullish | Bearish (Closes <50% of 1st) | Bearish Reversal |
| Tweezer Bottom | Downtrend | Any | Matches low | Support/Bullish Reversal |
| Tweezer Top | Uptrend | Any | Matches high | Resistance/Bearish Reversal |
Triple-Candlestick Patterns
Triple-candlestick patterns span three trading sessions, offering insights into trend direction, moments of indecision, and confirmation of market shifts. The sequence begins with a candle reflecting the current trend, followed by one indicating uncertainty or exhaustion, and concludes with a candle confirming a new directional move. This structured approach makes these patterns more dependable than single- or double-candlestick setups, as they require stricter conditions and deliver stronger confirmation signals .
"The third candle is the 'shift candle' - the clearest signal that momentum has flipped." - Jasper Osita, Market Analyst, ACY Securities
Technical analysts have identified around 40 distinct triple-candlestick patterns. Among these, the Morning Star and Three White Soldiers stand out, with probabilities of 75% or higher for resolving in the predicted direction. To ensure accuracy, wait for the third candle to close completely before making any trade decisions. This final step confirms the momentum shift.
These patterns are most effective after extended trends or at key support and resistance levels . For added confirmation, look for high trading volume on the first and third candles, with reduced volume on the middle indecision candle. Triple-candlestick patterns build on the insights provided by single and double-candlestick formations, offering traders a more layered view of market behavior. Let’s dive into some key configurations, starting with the reversal patterns Morning Star and Evening Star.
Morning Star and Evening Star
The Morning Star signals a bullish reversal after a downtrend. It consists of three candles: a long bearish candle, a small candle that gaps down, and a long bullish candle that closes at least halfway into the body of the first candle . With a 78% success rate, this pattern is particularly effective on 15-minute and 1-hour charts .
On the flip side, the Evening Star is a bearish reversal pattern that forms after an uptrend. It features a long bullish candle, a small candle that gaps up, and a long bearish candle that closes deep into the body of the first candle . This pattern has a 71% success rate.
"It's like a courtroom trial: The first lawyer dominates (first candle). The judge pauses the case to hear both sides (doji). The other lawyer drops evidence so strong that the jury flips (3rd candle = market shifts)." - Jasper Osita, Market Analyst, ACY Securities
The middle "star" candle represents a pivotal moment where the previous trend weakens, but the opposing force hasn’t yet seized control . The signal is even stronger when the third candle fully engulfs the first candle’s body, resembling an engulfing pattern. For Morning Stars, position your stop-loss just below the pattern’s lowest point; for Evening Stars, place it slightly above the highest point.
Three White Soldiers and Three Black Crows
Three White Soldiers is a bullish continuation pattern made up of three consecutive long-bodied candles with higher closes and minimal upper shadows . Ideally, each candle opens within the previous candle’s real body, showing consistent buying pressure. This pattern boasts an 84% success rate and indicates strong, sustained upward momentum, either as a continuation of an uptrend or a reversal from a downtrend.
The bearish counterpart, Three Black Crows, consists of three consecutive long-bodied bearish candles with lower closes and minimal shadows . Each candle typically opens within the body of the previous one, signaling aggressive selling pressure. This pattern has a 79% success rate and suggests that sellers have taken firm control of the market.
Both patterns are most impactful when they appear after extended trends or at significant price levels. Their consecutive formation underscores a steady, uninterrupted directional move.
Morning Doji Star and Evening Doji Star
Stay online and closer to execution. Choose a VPS location for CME futures, New York markets, London FX, API trading, and more.
Host your platform near the market route that matters.
From $59.99/mo
The Morning Doji Star and Evening Doji Star are variations of the standard star patterns, with a Doji candle in the middle position . The Doji reflects a moment of balance between buyers and sellers, signaling market equilibrium. When the third candle breaks this balance, the resulting move can be more pronounced, especially in volatile conditions. The Doji highlights heightened indecision, often leading to stronger reversals accompanied by volume spikes .
For these patterns, increasing volume across the three sessions - particularly a spike on the third candle - adds credibility to the signal . Pairing these patterns with tools like the Relative Strength Index (RSI) can further confirm overbought or oversold conditions. High-probability setups often emerge when these patterns form after a liquidity sweep or near a Fair Value Gap.
| Pattern | Type | Success Rate | Structure |
|---|---|---|---|
| Morning Star | Bullish Reversal | 78% | Long bearish, small indecision, long bullish closing >50% of first |
| Evening Star | Bearish Reversal | 71% | Long bullish, small indecision, long bearish closing >50% of first |
| Three White Soldiers | Bullish Continuation | 84% | Three consecutive long bullish candles with higher closes |
| Three Black Crows | Bearish Continuation | 79% | Three consecutive long bearish candles with lower closes |
Multi-Candlestick Patterns: Continuation and Reversal
Building on the foundation of single, double, and triple candlestick patterns, multi-candlestick setups provide a richer perspective on market behavior. These patterns, which consist of more than three candles, can signal either a continuation of the current trend or a potential reversal. In continuation setups, the market takes a brief pause before resuming its dominant trend. Reversal patterns, on the other hand, suggest that the prevailing momentum is losing steam, hinting at an upcoming shift in direction.
Interestingly, financial markets spend about 70% of the time moving sideways within ranges, with only 30% in trending phases. This makes it crucial to evaluate these patterns in the context of major support or resistance levels. Patterns observed on higher timeframes, such as daily or weekly charts, are often more dependable since they filter out short-term market noise.
"A good candlestick in a bad location is still a bad trade." - Jasper Osita, Market Analyst, ACY Securities
When paired with other technical indicators, many of these patterns boast success rates between 60% and 70%. Below, we’ll break down key multi-candlestick patterns, along with tips on stop-loss placement and volume confirmation to enhance your trading decisions.
Rising Three Methods and Falling Three Methods
The Rising Three Methods is a bullish continuation pattern that unfolds over five candles during an uptrend. It begins with a large bullish candle, followed by three smaller candles that remain within the range of the first. The pattern concludes with a strong bullish candle that closes above the high of the first candle. Those three smaller candles represent a brief attempt by sellers to push prices lower, but their failure to break the trend signals that buyers are still in control.
"The decisive (fifth) strongly bullish candle is proof that sellers did not have enough conviction to reverse the prior uptrend and that buyers have regained control of the market." - Investopedia
The Falling Three Methods operates similarly but in a downtrend. It starts with a large bearish candle, followed by three smaller candles within its range, and ends with a strong bearish candle closing below the low of the first candle. This structure confirms that the downtrend is likely to continue after a brief pause.
Before trading these patterns, it’s important to consider nearby resistance or support levels. For example, a Rising Three Methods pattern forming near a long-term moving average or significant price barrier might limit potential gains. Traders can place stop-loss orders either below the low of the final candle (for aggressive setups) or below the low of the first candle (for more conservative setups).
| Pattern | Type | Candle Count | Structure | Signal |
|---|---|---|---|---|
| Rising Three Methods | Continuation | 5 | Large bullish, three small bearish (within range), large bullish (breaks high) | Bullish |
| Falling Three Methods | Continuation | 5 | Large bearish, three small bullish (within range), large bearish (breaks low) | Bearish |
Three-Line Strike (Bullish and Bearish)
The Three-Line Strike pattern challenges the prevailing trend by reversing prior moves. It consists of four candles: three smaller candles in the trend’s direction, followed by a large "strike" candle that retraces them completely, signaling either continuation or reversal.
In a bullish Three-Line Strike, three small bearish candles are followed by a large bullish candle that closes above the open of the first candle. Conversely, a bearish Three-Line Strike features three small bullish candles followed by a large bearish candle that closes below the open of the first candle. The large strike candle essentially negates the progress of the previous three candles, indicating a potential shift in market momentum.
This pattern often appears after an extended trend, suggesting that the current move may be running out of steam. Adding oscillators like RSI or Stochastics can help confirm overbought or oversold conditions, providing additional confidence in the setup.
Concealing Baby Swallow and Ladder Bottom
These less common patterns can also offer valuable insights when they occur in the right context.
The Concealing Baby Swallow is a rare bearish continuation pattern that appears in a downtrend. It consists of two long bearish candles, followed by a smaller bearish candle and a final bearish candle that engulfs the prior one. This formation indicates that sellers remain firmly in control, even as buyers briefly attempt to push prices higher. High volume on the final candle strengthens the signal.
The Ladder Bottom, on the other hand, is a bullish reversal pattern. It includes three long bearish candles, followed by a smaller bearish candle, and concludes with a bullish candle that closes above the previous high. This pattern suggests that sellers are losing momentum, and buyers are starting to take charge. Ladder Bottom setups are more reliable when they form near key support levels or after a liquidity sweep.
Both of these patterns work best when confirmed by additional factors like volume spikes (50–150% above the recent average) or alignment across multiple timeframes. For example, spotting a pattern on a daily chart and confirming it against a weekly chart can provide greater confidence. Always wait for the final candle to close before acting, as premature entries can lead to false signals. These multi-candlestick patterns, whether indicating continuation or reversal, offer traders a deeper layer of market analysis to refine their strategies.
Trading Candlestick Patterns with QuantVPS
Trading candlestick patterns effectively requires lightning-fast infrastructure to capitalize on rapid market movements. During high-activity periods like the London Open (3:00–6:00 AM ET) and New York Open (8:30–11:00 AM ET), even milliseconds can mean the difference between catching a reversal or missing it entirely.
QuantVPS offers ultra-low latency infrastructure, routing orders to major exchanges in as little as 0–1 ms. For futures traders dealing with CME products like ES or NQ, its Chicago and Aurora data centers provide sub-1 ms latency (as low as 0.52 ms) to CME gateways. This speed is crucial for traders analyzing multiple charts - whether for broader trend context on daily timeframes or pinpointing entry points on shorter charts. Let’s explore how QuantVPS enhances candlestick pattern trading through its specialized features.
Using Ultra-Low Latency for Faster Pattern Recognition
When analyzing candlestick patterns, ultra-low latency ensures you don’t miss critical signals. Monitoring dozens of instruments simultaneously - looking for patterns like Hammer or Shooting Star - demands robust processing power, especially in volatile markets. QuantVPS delivers this with dedicated AMD Ryzen and EPYC CPUs, boasting clock speeds above 3.5 GHz for optimal single-threaded performance. Its high-frequency NVMe storage processes large bursts of tick data in real time, ensuring automated scanners detect patterns immediately after a candle closes. For resource-heavy tools like Bookmap, optional GPU acceleration and 10 Gbps uplink options further enhance performance.
Recommended VPS Plans for Candlestick Pattern Scanning
The right VPS plan depends on how many charts you’re monitoring and the complexity of your setup. A trader manually identifying basic patterns like Doji or Marubozu on one or two charts will have different requirements than someone running automated scanners across multiple timeframes and instruments.
| VPS Plan | Monthly Cost | Best For | Key Specs | Monitor Support |
|---|---|---|---|---|
| VPS Lite | $59.99 ($41.99 annual) | 1–2 charts, manual pattern identification | 4 cores, 8GB RAM, 70GB NVMe | Single monitor |
| VPS Pro | $99.99 ($69.99 annual) | 3–5 charts, multi-platform setups | 6 cores, 16GB RAM, 150GB NVMe | Up to 2 monitors |
| VPS Ultra | $189.99 ($132.99 annual) | 5–7 charts, automated scanning | 24 cores, 64GB RAM, 500GB NVMe | Up to 4 monitors |
For most traders scanning candlestick patterns, the VPS Pro plan is an excellent choice. It provides enough resources to run platforms like MetaTrader 4 for automated Expert Advisors spotting Engulfing patterns, TradingView for advanced charting of Morning Star setups, and ProRealTime for backtesting - all on one server. For smooth operation, allocate 2–4 GB of RAM per platform instance.
If your strategy involves scanning hundreds of symbols for complex patterns like Rising Three Methods or Three-Line Strike, the VPS Ultra plan offers the processing power needed to handle market volatility without compromising performance. All plans include 99.999% uptime, Windows Server 2022, and unmetered bandwidth - ensuring uninterrupted 24/7 monitoring.
With the right VPS plan, you can seamlessly integrate automation into your candlestick pattern strategies.
Automated Trading Strategies with Candlestick Patterns
Automating candlestick pattern strategies requires a high-performance infrastructure that can handle complex calculations and execute trades without delay. QuantVPS provides the dedicated resources needed to run multiple strategies smoothly. As Optimus Futures explains:
"QuantVPS is purpose-built for traders who require predictable latency, optimized hardware, and infrastructure designed explicitly for financial markets - not repurposed web-hosting servers."
Automated pattern recognition becomes even more effective when combined with other indicators. For instance, your VPS can host scanners that detect a Bullish Engulfing pattern while simultaneously checking RSI levels and volume for confirmation. This multi-indicator approach helps filter out false signals. Thanks to QuantVPS’s bare-metal AMD architecture, these calculations are processed instantly, even during high-volume trading periods.
Additionally, with fiber cross-connects to the CME, QuantVPS is ideal for scalpers and high-frequency traders who demand consistent performance.
"A VPS turns your trading setup into a professionally managed execution environment accessible from any device." - Optimus Futures
This robust infrastructure ensures that your automated, pattern-based strategies can run continuously, enabling 24/7 execution without interruptions.
Conclusion
Understanding candlestick patterns is a powerful skill for anticipating market movements. These 25 setups simplify the push-and-pull between buyers and sellers into easy-to-read visuals, enabling quicker and more confident trading decisions. As Timothy Sykes, Penny Stock Trader and Educator, puts it:
"Candlestick patterns are revered for their ability to distill complex market sentiments into understandable visual forms".
Mastering these patterns positions you for more effective trading. But success lies in using them wisely - context and confirmation are everything. Keep in mind that markets spend about 70% of the time moving sideways. Candlestick patterns help you spot the critical 30% when breakouts occur. Always wait for candle confirmation and assess the broader trend before taking action.
Timing is also crucial, especially during high-activity periods like the London and New York session overlap (8:30–11:00 AM ET). In these moments, milliseconds can mean the difference between capitalizing on a reversal or missing it altogether. QuantVPS’s ultra-low latency infrastructure - offering 0–1 ms routing to major exchanges and sub-1 ms latency to CME gateways - ensures your orders execute the moment a pattern completes.
Whether you're manually tracking Hammers on a single chart or using automated scanners across hundreds of symbols, QuantVPS provides the reliability and speed you need. Their plans range from the VPS Lite option at $41.99/month (billed annually) for basic setups to the VPS Ultra plan at $132.99/month for advanced multi-chart scanning, allowing you to tailor your setup to your trading strategy.
With well-defined patterns, proper confirmation, and QuantVPS’s high-performance tools, you can turn market insights into consistent, profitable trades.
FAQs
Which candlestick patterns are most reliable in sideways markets?
In sideways markets, candlestick patterns can be a helpful tool for traders, offering clues about potential reversals or moments of indecision. Patterns like the Hammer and Shooting Star often hint at possible reversals, while the Doji, Inside Bar, and Pin Bar suggest indecision or a pause in market momentum. To get the most out of these patterns, traders can pair them with support and resistance levels or analyze trading volume to better anticipate market movements.
What’s the best way to confirm a candlestick pattern before entering a trade?
To ensure the reliability of a candlestick pattern, it's essential to use several validation methods to filter out false signals. Combine the pattern with technical indicators like moving averages, RSI, or volume analysis to confirm trends. For instance, a bullish Hammer can be validated by observing rising volume or a moving average crossover. Additionally, take the broader market environment into account - pay attention to support and resistance levels to verify that the pattern aligns with the market's general direction.
How should I set stop-loss and take-profit levels using candlestick patterns?
To effectively set stop-loss and take-profit levels using candlestick patterns, here’s how you can approach it:
- Stop-Loss: Position your stop-loss slightly beyond the pattern's extreme wick or the most recent swing high/low. This helps to cap your potential losses if the trade moves against you.
- Take-Profit: Determine your take-profit level based on either the size of the candlestick or the next significant support or resistance level. Aim for a risk-to-reward ratio of at least 1:2 to ensure your potential gains outweigh your risks.
For improved precision and better risk management, pair candlestick patterns with trend analysis and technical indicators. This combination can help you make more informed trading decisions.


