
Machine learning is transforming how trading strategies are built and executed. Unlike rule-based methods, these systems analyze large datasets to identify patterns and make decisions. They improve prediction accuracy, adapt to changing markets, and eliminate emotional biases. Strategies use supervised learning for predictions, reinforcement learning for decision-making, and tools like TensorFlow and Python libraries for implementation. Proper data preparation, backtesting, and risk management are crucial for success. High-performance VPS ensures low latency and reliability for live trading. ML offers a data-driven edge in today's highly competitive financial markets.
Supervised Learning for Trading Predictions
Supervised learning tools are a powerful way to make trading predictions by analyzing historical data. These methods train algorithms to predict market movements using labeled examples from the past. As Stefan Jansen, Founder of Applied AI, explains:
"The term supervised implies the presence of an outcome variable that guides the learning process - that is, it teaches the algorithm the correct solution to the task at hand".
Supervised learning generally falls into two categories based on the prediction goal: regression models and classification models. Regression models predict numerical values like future prices or percentage returns, while classification models assign labels such as "buy", "sell", or "hold" to market conditions. Essentially, regression focuses on the size of a price change, while classification identifies the direction or action to take.
Regression Models for Price Forecasting
Regression models aim to predict specific numerical outcomes by studying the relationships between variables like market indicators and price movements. Common methods include Linear Regression for simple trends and Ridge or Lasso Regression for handling datasets with many technical indicators to avoid overfitting. For instance, one study trained a model on daily U.S. stock prices from 2010 to 2017 to predict returns for a ranking-based strategy.
However, financial returns often don't follow normal distributions - they tend to have heavy tails and skewness, which can make traditional linear models less reliable. Techniques like Ridge regression help by reducing model complexity, ensuring the algorithm doesn't overfit to noise in the data that won't repeat in live trading.
Classification Models for Trading Signals
Classification models focus on turning market data into actionable signals like "Buy" or "Sell." Instead of estimating the exact price change, these models determine the likely direction of movement. As Yves Hilpisch, CEO of The Python Quants, explains:
"In algorithmic trading it is generally enough to predict the direction of movement for a financial instrument as opposed to the absolute magnitude of that movement".
Popular algorithms include Logistic Regression for binary decisions, Random Forests for capturing complex patterns among indicators, and Support Vector Machines (SVM) for finding decision boundaries in high-dimensional data. For example, in October 2025, PyQuantLab developed a Bitcoin trading strategy using classification to generate "Buy" signals when the short-term moving average crossed above the long-term moving average. The model used features like momentum and volatility indicators to improve accuracy.
Preparing Data for Supervised Learning
The quality of data preparation can make or break a trading model. This process involves sourcing market data (such as tick-by-tick or OHLCV bars), financial statement information, and alternative data like earnings call transcripts. With over 13,000 public companies generating around 2 million pages of annual reports and 30,000 hours of earnings calls each year, there’s no shortage of training material.
Feature engineering plays a key role in turning raw data into useful signals. This might involve creating technical indicators, moving averages, or volume-based metrics to capture supply and demand dynamics. It's also critical to avoid look-ahead bias, which happens when the model uses data that wouldn’t have been available at the time of prediction. Specialized cross-validation techniques, such as purging and embargoing, help prevent this issue by ensuring that training and test datasets remain independent despite the serial correlation in financial data. Stefan Jansen highlights the risks:
"The resulting risks include the leaking of information from the test into the training set, likely leading to an artificially inflated performance that needs to be addressed by ensuring that all data is point-in-time".
For large-scale projects, efficient data storage formats like HDF5 or Parquet are preferable to CSV files. For example, AlgoSeek's equity minute bar data includes up to 54 fields per record, and using these optimized formats can significantly speed up training and backtesting processes.
Proper data preparation lays the groundwork for applying advanced machine learning techniques in fast-moving trading environments.
Reinforcement Learning for Strategy Optimization
Reinforcement learning (RL) takes a unique approach compared to supervised learning by teaching agents to make decisions through feedback in the form of rewards (profits) or penalties (losses). As noted in one ACM survey:
"RL-based methods bypass the extremely difficult task to predict future price and optimize overall profit directly".
Rather than attempting to forecast market movements, RL agents focus on learning which actions - buy, sell, hold, or adjust position sizes - lead to better outcomes. This feedback-driven system adapts strategies based on actual trading results, making it especially effective in volatile and unpredictable markets, where traditional price predictions often fail to yield consistent profits.
How Reinforcement Learning Works in Trading
In RL, trading is modeled as an interaction process. The agent - essentially your trading algorithm - analyzes market data such as moving averages, trading volume, or momentum indicators. Based on this analysis, it takes an action, like placing an order. The environment (the market) responds with a new state and a reward signal, often tied to profit, loss, or risk-adjusted metrics like the Sharpe ratio.
Trading is considered a "partially observable Markov Decision Process" because the agent has limited visibility into the market. It can access public data like prices and volumes but not private information, such as other traders' account sizes or hidden orders. Between 1999 and 2001, researchers John Moody and Matthew Saffell applied Recurrent Reinforcement Learning (RRL) to currency trading and asset allocation. By directly optimizing the differential Sharpe ratio, they outperformed traditional Q-learning methods, effectively managing the high variability of financial returns.
The learning process involves simulations where the agent stores its experiences - state, action, and reward - in what’s called "experience replay." During training, the agent randomly samples these experiences to break correlations in sequential data, stabilizing its learning process. In medium-frequency electronic trading, RL agents can make 3,600 decisions per hour - one every second. This high-frequency decision-making lays the groundwork for handling the complexities of modern financial markets.
Deep Reinforcement Learning for Complex Markets
Run 24/7 while you sleep. Keep bots, platforms, and trade copiers online on a dedicated VPS.
Low-latency VPS hosting for your trading platform.
From $59.99/mo
Building on standard RL, Deep Reinforcement Learning (DRL) introduces neural networks to manage more intricate market conditions. These networks help agents process high-dimensional data, such as multiple technical indicators, order book depth, and alternative data sources, all at once.
A standout DRL technique, Proximal Policy Optimization (PPO), has gained popularity in trading. It uses a "clipped objective function" to prevent overly aggressive adjustments. As Dan Buckley, Chief Analyst at DayTrading.com, explains:
"PPO's clipped updates reduce this risk by making incremental improvements. It strikes a balance between exploration and exploitation, without overshooting".
Advanced DRL agents also employ Long Short-Term Memory (LSTM) networks, which allow them to maintain a "hidden state" of recent market history. This capability is crucial for recognizing patterns in sequential time-series data, especially in markets with strong autocorrelation. In fact, some cryptocurrency backtests using DRL frameworks have delivered 4x returns in just 50 days, even with a high commission rate of 0.25%.
Balancing Risk and Reward
One of the key challenges in RL trading is designing the reward function to balance profitability with risk management. A simple profit-focused reward often encourages risky behavior and high volatility. To counter this, successful implementations optimize for risk-adjusted metrics like the Sharpe or Sortino ratios, which penalize strategies reliant on excessive risk-taking.
Some strategies also incorporate a "turbulence filter" to identify extreme market conditions. When thresholds are exceeded, these filters trigger asset sales to protect capital. Another important aspect is the discount factor (γ), typically set between 0 and 1, which controls how much the agent prioritizes future rewards over immediate profits.
To ensure stability during training, RL models often use a slowly-updating "target network" for more consistent value estimates. This mechanism is particularly critical in volatile markets, where instability can derail learning. Given that quantitative trading now represents over 70% of trading volume in developed markets like the U.S. and more than 40% in emerging markets like China, these RL techniques are essential for optimizing strategies that not only generate profits but also manage risks effectively.
Tools and Platforms for ML Trading Strategies
Python Libraries for Machine Learning Trading: Features and Use Cases
Building machine learning (ML) trading strategies requires the right set of tools, and Python stands out as the go-to language in this space. The right tools not only speed up development but also improve strategy execution. These tools help traders implement and refine both supervised and reinforcement learning techniques, creating a seamless path from idea to deployment.
Using TensorFlow for Neural Networks
TensorFlow plays a key role in tasks like price prediction, sentiment analysis, and reinforcement learning. Its ability to harness GPU power significantly speeds up training on large datasets.
With TensorFlow 2.0, Keras became its primary interface, making model development much simpler. As Stefan Jansen notes in his work on algorithmic trading:
"TensorFlow 2.0 adopted Keras as its main interface, effectively combining both libraries into one".
This integration allows for quick creation of Sequential models, which can predict future price movements using historical OHLCV (Open, High, Low, Close, Volume) data. For more specialized needs in finance, the tf-quant-finance library extends TensorFlow with tools for tasks like Black-Scholes option pricing, Monte Carlo simulations, and swap curve fitting.
TensorBoard is another valuable feature, offering visualization tools to track metrics like loss and accuracy during training, which helps identify overfitting early. However, training ML models can be resource-intensive, and some platforms limit single backtesting loops to 10 minutes. Advanced retraining techniques can extend this to 30 minutes.
Python Libraries for Trading
Beyond deep learning frameworks, Python libraries simplify data handling and traditional ML modeling. Libraries like Pandas and NumPy are essential for working with time-series data and performing high-speed calculations.
For traditional ML models, scikit-learn is a popular choice, offering algorithms for regression, classification (e.g., Random Forests and SVM), and clustering. According to QuantConnect's documentation:
"Scikit-learn is great to use if you want to quickly test an idea or hypothesis using a machine learning algorithm, without having to worry about building a model from the ground up".
Its Pipeline feature streamlines feature processing and hyperparameter tuning, reducing the risk of data leakage during cross-validation. For more advanced predictive modeling, gradient boosting libraries like XGBoost, LightGBM, and CatBoost handle large datasets efficiently.
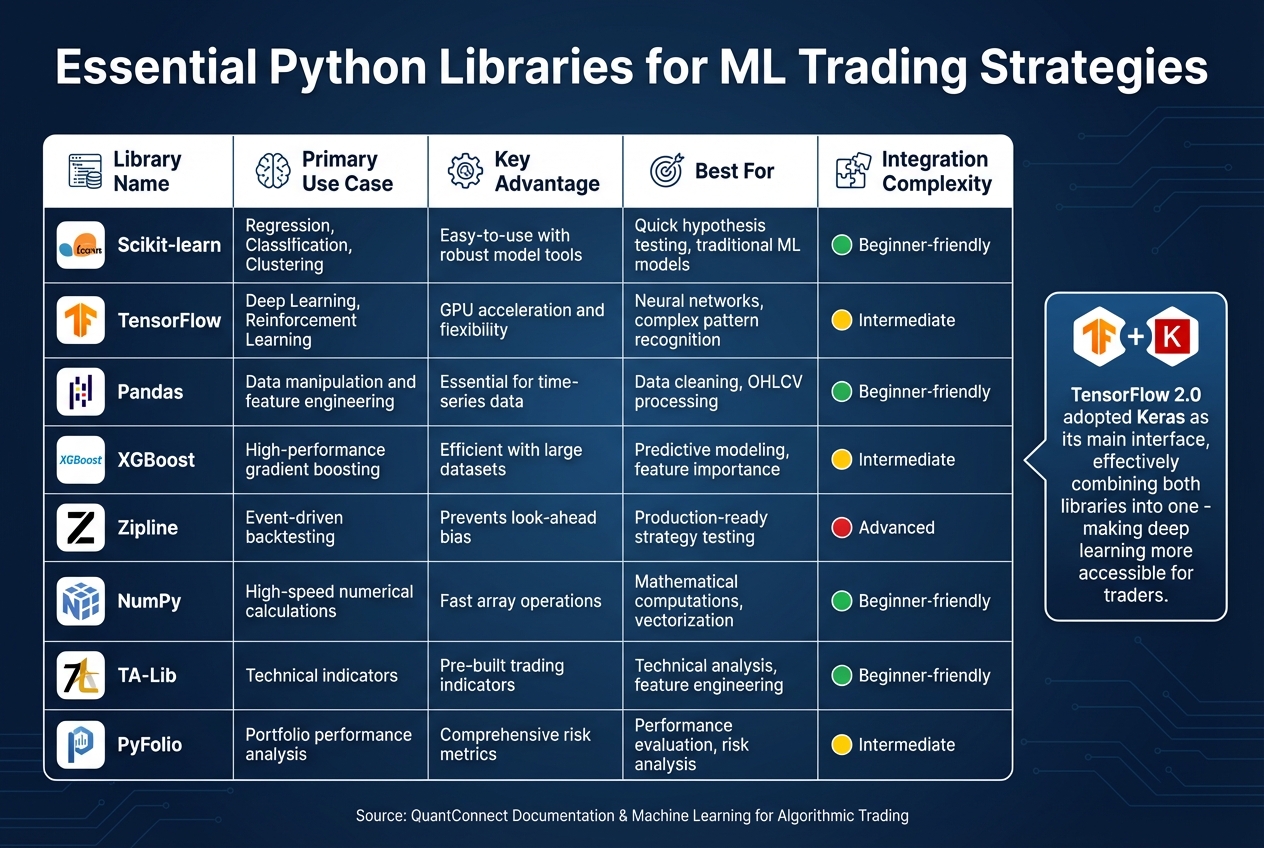
For backtesting, tools like Zipline Reloaded provide event-driven systems designed to avoid look-ahead bias, ensuring strategies are production-ready. The LEAN engine, used by QuantConnect, supports Python and C# for both research and live trading. Other specialized tools include TA-Lib for technical indicators, Alphalens for evaluating predictive factors, and PyFolio for portfolio performance and risk analysis. These libraries and platforms not only aid in developing models but also ensure thorough backtesting and smooth deployment.
| Library | Primary Use Case | Key Advantage |
|---|---|---|
| Scikit-learn | Regression, Classification, Clustering | Easy-to-use with robust model tools |
| TensorFlow | Deep Learning, Reinforcement Learning | GPU acceleration and flexibility |
| Pandas | Data manipulation and feature engineering | Essential for time-series data |
| XGBoost | High-performance gradient boosting | Efficient with large datasets |
| Zipline | Event-driven backtesting | Prevents look-ahead bias |
Connecting ML Models to Trading Platforms
Integrating ML models into live trading platforms requires careful attention to latency. To minimize delays, model retraining is often run on separate threads or GPUs, leaving inference and trade execution uninterrupted. For example, the round-trip latency between exchanges in New York can be as low as eight milliseconds, highlighting the importance of speed even for medium-frequency strategies.
Event-driven architectures are particularly effective in simulating live trading conditions. As Stefan Jansen explains:
"The ultimate goal of the ML4T workflow is to gather evidence from historical data that helps decide whether to deploy a candidate strategy in a live market and put financial resources at risk".
Platforms like LEAN and tools such as FreqTrade (an open-source crypto trading bot) simplify the connection between ML models and live execution. Trained models can be saved to disk for quick reloading after interruptions, and many platforms include an Object Store to avoid retraining after a restart.
When deploying deep learning models, Docker can help manage GPU drivers and CUDA environments, reducing version conflicts in production. For strategies needing to adjust to market changes, tools like FreqAI enable adaptive retraining in the background while the main trading bot continues operating with existing signals.
Building and Deploying ML Trading Strategies
Turning a machine learning (ML) model into a profitable trading strategy takes more than just training algorithms. It starts with defining the problem - understanding the specifics of the asset, what drives its price, and how market participants behave. This groundwork influences everything from data collection to managing risk.
Steps to Develop an ML Trading Strategy
Developing an ML trading strategy involves a structured process. The first step is gathering high-quality historical data, such as tick-level or OHLCV (Open, High, Low, Close, Volume) data. Supplement this with additional inputs like the VIX volatility index, economic indicators, or news sentiment scores. Then comes feature engineering, where you create meaningful inputs like technical indicators or market microstructure metrics (e.g., order book imbalances or trade volume) to capture market signals.
Choosing the right model depends on your goals. For example, Random Forests are great for detecting non-linear relationships, while LSTM networks excel at analyzing time-series data. Many traders combine models using ensemble methods to leverage their strengths. As Dan Buckley, Chief Analyst at DayTrading.com, puts it:
"Machine learning algorithms help traders analyze vast datasets, identify patterns that are hard for humans to detect, and make more informed trading decisions".
After model training, the next step is backtesting. This involves simulating the strategy under realistic conditions, accounting for bid-ask spreads, slippage, and transaction costs. Using event-driven backtesting engines like Zipline or backtrader ensures you can replicate real trading conditions bar-by-bar. To avoid overfitting, apply techniques like walk-forward validation, purging overlapping data, and embargoing training samples that overlap with test periods.
| Stage | Key Activities | Tools/Methods |
|---|---|---|
| Data | Cleaning & Normalization | Pandas, NumPy, FreqAI |
| Features | Technical Indicators, Sentiment, Microstructure | TA-Lib, spaCy, Beautiful Soup |
| Modeling | Training, Hyperparameter Tuning, Validation | Scikit-learn, TensorFlow, PyTorch |
| Testing | Backtesting, Performance Metrics (e.g., Sharpe) | Zipline, backtrader, Pyfolio |
| Live Ops | Execution, Monitoring, Retraining | Broker APIs, Cloud VPS, Kafka |
Start with simple models (under 100 lines of code) and only add complexity if it improves performance. A modular architecture - with separate components for data ingestion, signal generation, order execution, and monitoring - makes debugging and scaling much easier. These steps set the stage for risk management and live deployment.
Risk Management and Live Deployment
Before putting real money on the line, integrate risk management measures into your strategy. This includes stop-losses, take-profit levels, and position sizing techniques like the Kelly Criterion. Paper trading is an essential step - it helps uncover latency or execution issues before going live.
To reduce delays, deploy the strategy using low-latency infrastructure located near exchange data centers. For example, the round-trip latency between CME and BATS exchanges in New York is about 8 milliseconds. Services like QuantVPS offer low-latency hosting, enabling professional-grade execution speeds even with smaller capital.
For reliability, use tools like Docker to manage dependencies and store trained models for quick recovery in case of system crashes. This ensures your trading bot can continue uninterrupted.
Continuous Model Optimization
Deployment is just the beginning. To maintain performance, your models need regular updates. Markets change, and your strategy must adapt. Schedule automated retraining on a weekly or monthly basis to keep models relevant. Use rolling windows to focus on recent market trends while keeping enough historical data for statistical accuracy.
Stay online and closer to execution. Choose a VPS location for CME futures, New York markets, London FX, API trading, and more.
Host your platform near the market route that matters.
From $59.99/mo
Retraining should run on separate threads or GPUs to avoid slowing down live trading operations. This separation ensures your bot keeps executing trades while new models are trained in the background.
Be on the lookout for feature drift, where the statistical properties of your input data change over time, potentially harming performance. Regime detection algorithms can help identify shifts in market conditions, such as a switch from bullish to bearish trends. Adjust your strategy parameters or switch models dynamically to match current market behavior. Visualization tools are also critical for early detection of issues, helping you maintain consistent performance as conditions evolve.
High-Performance VPS for ML Trading
When it comes to machine learning (ML)-driven trading strategies, precision and speed are everything. The infrastructure supporting these strategies is just as crucial as the algorithms themselves. For live deployment, a dedicated VPS (virtual private server) provides the reliability and performance that ML trading demands. Running ML strategies on a home computer introduces risks like power outages, unstable internet, and hardware failures - all of which can disrupt trading at critical moments. A high-performance VPS eliminates these risks, delivering the consistent speed and uptime essential for seamless execution.
Why Low-Latency VPS Matters
In automated trading, execution speed can make or break profitability. Low-latency VPS solutions, especially those located near broker servers, are critical for reducing delays. While a home internet connection adds 50–200ms of latency, a dedicated trading VPS can bring that down to under 1ms. For ML models, which need to react to market changes in real time, this speed is non-negotiable.
For example, in October 2024, an investment firm revamped its trading systems by integrating deep learning techniques. By prioritizing execution speed and accuracy, the firm saw a 15% boost in ROI on trades. Considering that algorithmic systems now drive over 70% of forex trading volume, having a reliable, low-latency VPS isn't just helpful - it's essential.
QuantVPS Plans Comparison
QuantVPS offers a range of plans tailored to the varying demands of ML trading strategies. Here's how the plans stack up:
| Plan | Monthly Price | Annual Price | CPU Cores | RAM | Storage | Best For |
|---|---|---|---|---|---|---|
| VPS Lite | $59.99 | $41.99/mo | 4 cores | 8GB | 70GB NVMe | Basic ML models, testing |
| VPS Pro | $99.99 | $69.99/mo | 6 cores | 16GB | 150GB NVMe | Complex ML strategies |
| VPS Ultra | $189.99 | $132.99/mo | 24 cores | 64GB | 500GB NVMe | Deep learning, HFT |
| Dedicated Server | $299.99 | $209.99/mo | 16+ cores | 128GB | 2TB+ NVMe | Heavy trading workloads |
Every plan comes with 1Gbps+ network speeds, unmetered bandwidth, Windows Server 2022, and full root access. For those needing even more power, Performance Plans (+) offer enhanced processing capabilities. These options ensure your ML models have the resources to handle real-time data processing without hiccups.
Running ML Models on QuantVPS
Machine learning models like LSTM (Long Short-Term Memory) and reinforcement learning algorithms (e.g., DQN, PPO) are computationally demanding. They require significant processing power to analyze large datasets in real time. QuantVPS rises to the challenge with high-performance CPUs (3.5GHz+ clock speeds) and NVMe storage, which ensures fast I/O performance for handling vast amounts of historical and tick-level financial data.
NVMe storage, in particular, is a game-changer for ML trading. Unlike traditional SSDs, NVMe drives can manage the high I/O requirements of loading model weights and historical datasets without bottlenecks. This means your models can operate with the responsiveness needed for profitable decision-making. For traders working with Python or C++ to develop their algorithms, QuantVPS also offers Linux-based VPS options. By using a lightweight operating system, these setups allocate more resources directly to your trading algorithms, maximizing efficiency.
Backtesting and Performance Metrics
Before putting real money on the line, every machine learning (ML) trading strategy must undergo thorough testing against historical data. Backtesting helps simulate how a strategy would have performed in the past, shedding light on its profitability, behavior during market stress, and required capital. This step is a critical checkpoint to ensure a model is ready for live deployment. By combining backtesting with performance metrics, traders can gauge whether their ML strategies are robust enough for real-world trading.
Backtesting Methods for ML Strategies
Two main approaches dominate ML strategy backtesting: vectorized and event-driven.
- Vectorized backtesting relies on array operations through tools like NumPy and Pandas, offering speed and efficiency for early-stage research and prototyping.
- Event-driven backtesting, on the other hand, processes data one step at a time, simulating live trading conditions more accurately. This method accounts for factors like slippage, margin requirements, and execution timing.
There are pitfalls to watch out for, though. Look-ahead bias - using future data inappropriately - can distort results. To avoid this, use functions like .shift() to ensure decisions are based only on past data. Another common issue is survivorship bias, which occurs when historical datasets exclude companies that were delisted or went bankrupt, leading to inflated returns. To counteract this, use point-in-time databases that include failed companies for a more realistic analysis.
Walk-forward analysis is a must for ML models. Instead of testing on a static dataset, this method retrains and validates the model on rolling data windows, mirroring how it would adapt to new market conditions. Tools like Zipline (for production-ready, event-driven testing), Backtrader (for local flexibility), and Pyfolio (for risk and performance analysis) are popular for backtesting ML strategies.
"The flexibility to test many ideas can lead to strategies that appear robust in hindsight but fail in live trading." - Michael Brenndoerfer
A simulation of 1,000 random strategies showed that 8.4% achieved a Sharpe ratio above 1.0 purely by chance. This highlights the importance of rigorous validation on out-of-sample data to avoid overfitting and false confidence.
Performance Metrics for Strategy Evaluation
Backtesting establishes a strategy's viability, but performance metrics are what truly measure its effectiveness. While raw returns are important, they don’t tell the whole story. Risk-adjusted metrics are crucial for understanding whether the profits justify the risks taken.
The Sharpe ratio is a key metric, measuring excess return per unit of volatility. For instance, a reinforcement learning strategy using Proximal Policy Optimization (PPO) achieved an annualized return of 21.3% with a Sharpe ratio of 1.67, significantly outperforming a Buy & Hold strategy, which returned 12.1% with a Sharpe ratio of 0.85.
Another vital metric is maximum drawdown, which tracks the largest peak-to-trough decline in account value. This helps traders understand worst-case scenarios. For example, LSTM-based models in the Indian stock market delivered 15% higher returns compared to traditional moving average strategies. However, even high returns lose value if drawdowns are severe enough to force an exit from the market.
ML models require both predictive metrics (like accuracy, precision, and recall) to assess signal quality and financial metrics (such as annualized return, win rate, and profit factor) to evaluate economic outcomes. An ML model with just 57% accuracy can be effective if it beats the random 50% baseline. For regression models predicting exact prices, metrics like Mean Absolute Error (MAE) and Root Mean Square Error (RMSE) are used to measure prediction accuracy.
One effective technique is thresholding. Instead of acting on every positive signal (e.g., a probability of 0.5), setting a higher threshold like 0.6 can filter out low-confidence trades. In one study, raising the threshold from 0.5 to 0.55 improved the Sharpe ratio from 3.5 to 6.5, even though trade frequency decreased. Additionally, always subtract realistic costs - like slippage (e.g., 0.6 points) and commissions (e.g., $1.00 per trade) - to calculate net profit accurately.
"Commonly reported backtest evaluation metrics like the Sharpe ratio offer little value in predicting out of sample performance." - Thomas Wiecki, Andrew Campbell, Justin Lent, and Jessica Stauth
Research found that standard Sharpe ratios had an R² < 0.025 for predicting future performance, while non-linear ML classifiers analyzing backtest behavior achieved R² = 0.17. The lesson? Use multiple metrics and focus heavily on out-of-sample validation for better predictions.
Refining Models Through Testing
Backtesting isn’t a one-and-done task - it’s an ongoing process of refinement. Using separate training, validation, and test sets is crucial to avoid overfitting. Preprocessing steps must respect temporal boundaries, meaning only historical data available at the time should be used.
Renaissance Technologies, a leading quantitative hedge fund, executes up to 100,000 trades daily using systematic methods. Their success is rooted in rigorous testing protocols that account for transaction costs, market impact, and execution realism. If you test 1,000 strategies on the same dataset at a 5% significance level, expect around 50 false positives due to statistical noise. To address this, tools like the Deflated Sharpe Ratio help correct for biases caused by multiple testing and data snooping.
As markets evolve, models can drift away from their original performance. Set up automated alerts to monitor key metrics, like win rate or Sharpe ratio, and take corrective action if they drop below acceptable thresholds. Often, the predicted edge of an ML model is smaller than the cost of execution, which is why prioritizing financial metrics like risk-adjusted returns and maximum drawdown is critical when deciding on deployment.
Conclusion
Machine learning has reshaped the way traders design and implement automated strategies. Its strength lies in uncovering patterns within complex, high-dimensional data - whether from SEC filings, earnings call transcripts, or even satellite images - that traditional rule-based systems simply can't handle. By transforming massive amounts of unstructured financial data into actionable insights, machine learning enables a more systematic, data-driven approach to trading.
To successfully apply these techniques, a structured workflow is essential: gathering and cleaning data, creating meaningful financial features, and selecting the right algorithms. These might include supervised learning for predicting prices, reinforcement learning to refine strategies, or unsupervised learning to uncover hidden risk factors. As Stefan Jansen, author of Machine Learning for Algorithmic Trading, explains:
"The ultimate goal of the ML4T workflow is to gather evidence from historical data that helps decide whether to deploy a candidate strategy in a live market and put financial resources at risk".
Equally important is the infrastructure supporting your models. High-performance VPS environments provide the low-latency, always-on reliability, and computational power needed to run machine learning models in real time. With round-trip latency between major exchanges nearing the theoretical limit of eight milliseconds, even the smallest delays can impact performance.
When testing strategies, tools like Zipline or Backtrader help simulate realistic trading conditions. Always account for transaction costs in your backtests to ensure accuracy. Once tested, deploying your strategies on a dependable VPS ensures they operate smoothly, whether you're using a simple Random Forest model or a sophisticated deep reinforcement learning system. Reliable infrastructure minimizes risks like latency spikes or downtime, which could compromise your trading edge.
FAQs
How do I choose between regression and classification for trading?
When you're working with trading models, the choice between regression and classification depends on what you're trying to predict.
- Regression is your go-to for predicting continuous variables, like estimating future stock prices or returns. It focuses on delivering exact numerical values, which is ideal for precise forecasting.
- Classification, on the other hand, is best for categorical outcomes. For example, you might use it to determine whether a stock price will go up or down, or to classify market conditions into categories like "bullish" or "bearish." This approach supports decision-making by simplifying complex data into clear categories.
The choice between these methods hinges on your trading strategy. If you need specific, detailed forecasts, regression is the better fit. But for binary or categorical decisions, classification takes the lead. Many trading systems actually blend both approaches, tailoring their use to the task at hand and the nature of the available data.
What’s the safest way to avoid look-ahead bias in ML backtests?
To keep your machine learning backtests free from look-ahead bias, it's crucial to maintain a clear boundary between training and testing data. Treat the process as if you're working with real-time data - only use information that would have been available at that moment. Avoid incorporating any future data when assessing your models. This approach preserves the reliability of your results and provides a more accurate picture of how the model would perform in real-world scenarios.
When should I use reinforcement learning instead of supervised learning?
When you need to train an agent to make decisions step by step in an unpredictable environment, reinforcement learning is your go-to approach. This method allows the agent to learn through trial and error by receiving rewards, helping it improve over time. It's especially useful for tasks like developing trading strategies, where constant adjustments and long-term optimization are crucial.


