
Day trading success boils down to one key principle: focus on high-probability setups instead of chasing every price movement. These setups rely on structured, repeatable strategies backed by statistical odds, helping traders manage risk and improve their chances of consistent gains.
Key Takeaways:
- High-Probability Setups: Combine factors like confluence zones, higher timeframe confirmation, and clear entry triggers.
-
Market-Specific Insights:
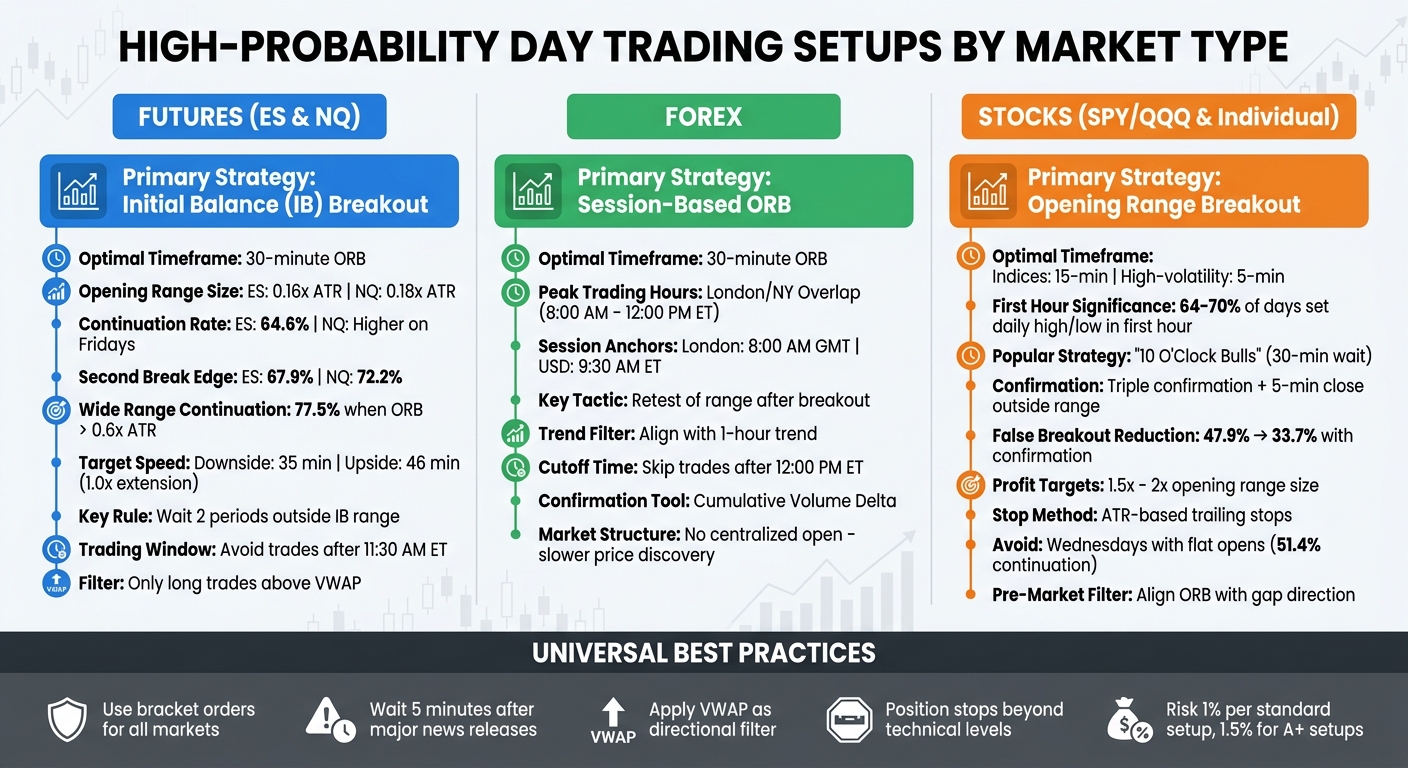
- Futures: Use Initial Balance Breakouts and monitor ATR-based ranges.
- Forex: Focus on session overlaps and retests for breakouts.
- Stocks: Leverage opening range strategies and pre-market gap analysis.
- Risk Management: Position sizing, stop-loss placement, and daily loss limits are critical to long-term success.
- Execution Tips: Use bracket orders, avoid trading during high-impact news, and maintain discipline.
Whether trading futures, forex, or stocks, the formula remains the same: stick to proven strategies, manage your risk, and execute with precision.
Core Elements of High-Probability Setups
High-probability setups aren't about chasing the "perfect" indicator or pattern. Instead, they focus on combining independent signals to boost the chances of success. Here’s how traders can refine their approach by understanding and mastering key elements.
How to Identify Decision Spots
Decision spots are critical price levels where the market is likely to pause, reverse, or pick up momentum. These levels often trigger reactions from institutional players and algorithms. To spot them, start by analyzing key levels on higher timeframes, such as daily or 4-hour charts, before drilling down to shorter intraday intervals.
"My stops weren't random - they hit at the EXACT points where big money defends key levels. I'd see a perfect 5-minute breakout and go all-in, only to get stopped out at major daily or weekly levels I never checked."
– Brian Walsh, Day Trader
The strongest decision spots emerge when multiple timeframes align. For example, a weekly moving average overlapping with daily support and a 4-hour retracement creates a solid decision zone. Brian Walsh, a day trader, learned this the hard way - losing $81,000 by ignoring higher timeframe levels. After adopting a multi-timeframe checklist in January 2025, his win rate surged from 38% to 70.6%, recovering $37,960 in just six months. Recognizing these spots is essential before combining them with entry triggers.
Using Confluence Zones
Confluence zones occur when several technical signals align to strengthen the case for a trade. Instead of relying on a single indicator, confluence involves stacking evidence from multiple tools. For instance, a Fibonacci retracement level that aligns with structural support, confirmed by bullish price action and a volume increase, creates a robust confluence zone.
"Confluence isn't about perfection, it's about stacking evidence to increase probability."
– Justin Trading
Studies reveal that using at least three distinct technical tools can significantly improve success rates compared to relying on one. High volume across timeframes often signals institutional activity. The key is to combine independent variables, such as structure (Fibonacci), trend (EMAs), and price action (reversal candles), rather than overlapping indicators that measure the same thing. To avoid overwhelming your analysis, stick to four to six high-impact tools. A deeper understanding of fewer tools often beats cluttered charts. These confluence zones lay the groundwork for precise entry triggers.
Entry Triggers and Confirmation Techniques
Even the best confluence zone needs a clear entry trigger to confirm that the level is holding. Entry triggers include reversal candlestick patterns (like pin bars, engulfing patterns, and doji formations), structural shifts such as "Change of Character" (ChoCh) or "Break of Structure" (BoS) on lower timeframes, momentum divergence (using RSI or MACD), and volume spikes that suggest institutional involvement.
A solid trade setup requires at least three factors: direction, location, and trigger. Using three to four independent factors helps cut through market noise without overcomplicating decisions. Only enter once the candle closes or the structure shifts to minimize the risk of false breakouts. Timing entries with high-volume periods, such as the New York Open (9:30–10:00 a.m. ET) or the institutional flow window (10:00–11:30 a.m. ET), can further increase your chances of success.
Day Trading Setups by Market Type
High-Probability Day Trading Setups Comparison: Futures vs Forex vs Stocks
Adapting your trading strategy to each market's characteristics is key to identifying high-probability setups. Futures, forex, and stocks all utilize the Opening Range Breakout (ORB) method, but each market requires specific timeframes, filters, and execution strategies. Let’s break down how this approach works across these markets.
Futures Trading Setups
Futures markets, such as the E-mini S&P 500 (ES) and Nasdaq 100 (NQ), are known for their liquidity and structured trading hours, making them ideal for capitalizing on early momentum. A popular strategy here is the Initial Balance (IB) Breakout, which uses the first 60 minutes of trading to define a range. A price break beyond this range often signals institutional activity.
Run 24/7 while you sleep. Keep bots, platforms, and trade copiers online on a dedicated VPS.
Low-latency VPS hosting for your trading platform.
From $59.99/mo
For ES, the 30-minute ORB tends to provide clearer signals than shorter timeframes, with a continuation success rate of 64.6%. NQ, on the other hand, typically requires wider stops due to its opening range being 0.18x ATR, compared to ES’s 0.16x ATR. A standout feature in futures trading is the "Second Break Edge": if the first breakout fails, the second breakout tends to succeed 67.9% of the time for ES and 72.2% for NQ.
"The opening hour establishes the initial consensus of value, and when this consensus is rejected by subsequent trading, strong directional moves often follow."
– MarketProfile.info
To improve accuracy, apply the "2 Period Rule": wait for the price to hold outside the IB range for at least two 30-minute periods before entering. Only take long trades if the price remains above VWAP, and avoid initiating trades after 11:30 AM ET, as low-volume moves tend to dominate during late mornings. Fridays are particularly favorable for NQ, with higher continuation rates compared to other days.
Wide opening ranges don’t necessarily mean choppy trading. When the ORB exceeds 0.6x ATR, the continuation rate for ES jumps to 77.5%. Interestingly, downside targets are hit faster than upside ones - a 1.0x extension typically takes 35 minutes to the downside versus 46 minutes to the upside. Staying disciplined and sticking to predefined criteria is essential to capitalize on these opportunities.
While futures have structured trading sessions, forex requires a different approach due to its 24-hour operation.
Forex Trading Setups
Forex trading thrives on precise timing, particularly during the London/New York overlap from 8:00 AM to 12:00 PM ET, when volume and directional moves peak. Since forex lacks a centralized open, traders anchor their ranges to key session starts, such as 8:00 AM GMT for London and 9:30 AM ET for USD pairs.
The 30-minute ORB is effective in forex, reflecting the slower price discovery process compared to stock markets. Using VWAP as a filter and confirming breakouts with a retest of the range often leads to better risk-to-reward outcomes.
Aligning trades with the 1-hour trend can help avoid counter-trend traps. If no breakout occurs by 12:00 PM ET, it’s best to skip the trade, as institutional momentum tends to wane by midday. Tools like Cumulative Volume Delta can confirm whether aggressive buyers or sellers are driving the breakout. Following these guidelines ensures you maximize your edge in forex trading.
Unlike futures and forex, stock markets reveal sentiment quickly at the open, requiring unique strategies.
Stock Trading Setups
The stock market’s open at 9:30 AM ET is a high-energy period driven by overnight orders and institutional activity. For indices like SPY and QQQ, the 15-minute ORB is standard, while high-volatility individual stocks often use 5-minute ranges. Research shows that 64% to 70% of trading days establish their daily high or low within the first hour.
The "10 O'Clock Bulls" strategy waits 30 minutes to define a range before entering on an upside breakout. For individual stocks, pre-market gaps provide valuable context - only trade ORB setups that align with the gap direction. Use a triple confirmation approach: enter when the price breaks the high or low established by the initial breakout move.
"The ORB is a framework, not a signal. It tells you where the first battle between buyers and sellers took place."
– GrandAlgo
To confirm intent, wait for a 5-minute close outside the range before entering. This reduces the risk of false breakouts, lowering double-breakout rates from 47.9% to 33.7% on the 30-minute timeframe. Profit targets should be set at 1.5x to 2x the opening range size, with ATR-based trailing stops to account for volatility. Avoid Wednesdays with flat opens, as they show lower continuation rates of 51.4%. By sticking to your trading plan and criteria, you can filter out setups with low potential in stocks.
Risk Management and Trade Execution
Protecting your capital and executing trades with precision are what set successful traders apart from those who consistently lose money. The key lies in disciplined risk management and flawless execution.
Setting Stop Losses and Profit Targets
When placing stop losses, let the market structure guide you rather than relying on arbitrary numbers. Stops should be positioned just beyond critical technical levels, such as swing highs, swing lows, or the opening range boundaries.
To adjust for market volatility, you can use volatility-based stops guided by the Average True Range (ATR). For instance:
- Use 1.5x ATR for scalping.
- Opt for 2.0x ATR for standard day trades.
- Go with 3.0x ATR for trend-following.
For example, on NQ futures, a 2.0x ATR stop might translate to 8–10 points (about $160–$200 per contract), while on ES, it could be 4–5 points (roughly $200–$250 per contract).
When setting profit targets, use fixed reward-to-risk ratios like 1.5R, 2R, or 3R, where "R" represents your initial risk. A common strategy is to take partial profits at 1R and adjust your stop to breakeven, then let the rest of the position ride to 2R or 3R. For example, if you risk $100 on a trade, your first profit target would be $100, followed by $200 or $300 for the remainder.
"The edge isn't in the setups. The edge is in consistent 1% losses and letting your winners run to 2R and 3R." – TradeDisciple
During high-impact news events like FOMC announcements or inventory reports, tighten your stops to 1.0x ATR. This protects against sudden market gaps that could result in significant losses.
With stops and targets firmly in place, the next step is calculating the right position size to match your risk tolerance.
Position Sizing and Risk Control
Position sizing is a straightforward calculation, but many traders get it wrong. Use this formula:
Position Size = (Account Risk % × Account Size) / (Stop Loss in Dollars).
For example, if you have a $25,000 account and risk 1% ($250) with a stop loss of 5 points on ES (equal to $250 per contract), you would trade one contract.
Capital preservation is critical. A 50% drawdown requires a 100% gain to recover, while a 75% loss demands a staggering 300% rebound. This highlights the importance of managing risk carefully.
For funded trading accounts, base your risk calculations on your drawdown buffer rather than the full account balance. For instance, with a $50,000 funded account and a $2,500 trailing drawdown limit, risk 1–2% of the $2,500 (about $25–$50), not the entire $50,000.
Adjust your risk based on the quality of your trade setups:
- Risk 0.75% for mid-confidence trades (70–79% confluence).
- Risk 1% for standard setups (80–89%).
- Go up to 1.5% for high-conviction "A+" trades with strong confirmation.
Risk levels should also vary by instrument. For example, volatile assets like Bitcoin futures might warrant 0.5–1% risk, while more stable indices like ES can handle 1–2%.
Set a daily loss limit at 2–3% of your account. If you hit this limit or experience three consecutive losses, stop trading for the day. This "kill switch" prevents emotional decisions and revenge trading during volatile periods.
Trade Execution Best Practices
Once your risk parameters are set, disciplined execution ensures you maintain your edge. Use bracket orders, which automatically attach a stop loss and profit target to your entry. This removes emotion from the process and ensures consistency. Many trading platforms, such as NinjaTrader, Sierra Chart, and TradeStation, support this feature.
Choose your order type based on market conditions:
- Limit orders provide price control and minimize slippage but may not fill during fast moves.
- Market orders guarantee immediate execution but come with a higher risk of slippage.
- Stop-limit orders, placed just above breakout levels, confirm momentum before executing.
Stay online and closer to execution. Choose a VPS location for CME futures, New York markets, London FX, API trading, and more.
Host your platform near the market route that matters.
From $59.99/mo
During volatile markets, widen your stops to avoid being shaken out by noise. However, reduce your position size to keep your total dollar risk unchanged. For example, if your usual stop on ES is 4 points (with $200 risk per contract) and volatility doubles, you could switch to an 8-point stop with a smaller position size to maintain the same risk.
Avoid entering trades during major news releases like CPI, NFP, or FOMC minutes. Wait at least 5 minutes after the announcement for the market to stabilize. Tools like Depth of Market (DOM) and Footprint chart platforms can help you track resting orders and identify aggressive market activity or signs of exhaustion.
"The goal is not to trade more. The goal is to trade better." – Joshua Soriano, Writer, Quant Matter
Finally, pre-calculate position sizes for different stop distances. This eliminates the need for on-the-spot math during fast-moving markets. A reference sheet listing how many contracts you can trade with 10-tick, 15-tick, or 20-tick stops at your preferred risk percentage can be incredibly helpful.
Common Mistakes and How to Improve
Even the best trading systems can falter when execution and discipline go awry. Errors in risk management, planning, or mindset can drain both your capital and confidence, turning promising setups into a string of losses.
Avoiding Premature Entries and Over-Trading
Jumping into trades without proper confirmation is a fast way to lose money. Many traders rush into positions as soon as the price touches a support level or nears a breakout zone, only to face reversals. False breakouts happen about 35–45% of the time in major futures markets like the E-mini S&P 500. This means nearly half of breakout attempts fail if you don’t wait for confirmation.
To reduce the risk of premature entries, wait for a candle to fully close outside the range or ensure that breakout volume is at least twice the average. For instance, on a 5-minute chart, wait for a full candle close beyond the range and confirm that volume is at least 2x the average before entering.
Over-trading often stems from FOMO (fear of missing out) or boredom during slow markets. To combat this, set a daily trade cap - like six trades per day - and focus only on high-quality setups using best indicators for day trading and a strict checklist. Here’s why this matters: three consecutive 5% losses require a 15.8% gain to recover, while three 1% losses need only a 3.1% gain to break even. Keeping losses small ensures you stay in the game longer.
"Day‑trading mistakes are recurring lapses in risk control, execution, planning, or psychology that quietly chip away at both capital and confidence." – John McDowell, Lead Content Strategist, TradingSim
Systematic backtesting can help validate your setups, giving you the confidence to avoid impulsive decisions.
Backtesting and Validating Your Setups
Testing your strategies on historical data helps you build trust in your setups. Start by defining clear entry and exit rules, stop-loss levels, and position sizing formulas. Vague guidelines like "buy when it looks strong" won’t cut it. Instead, use specific criteria like: "Go long when price closes above VWAP, RSI is above 50, and volume exceeds 1.5x the 20-period average."
The golden rule of backtesting is to record every trade that meets your criteria - no cherry-picking. Skipping trades that don’t look good distorts your results and can lead to false confidence. Aim for at least 100 trades for moderate reliability and 200+ trades for stronger statistical confidence.
Don’t forget to account for spreads, commissions, and swap fees in your backtest. A strategy with a 0.3R expectancy might turn unprofitable once real costs are factored in. Use out-of-sample testing by dividing your data into two parts: 70% for development and 30% for validation. If your strategy works on unseen data, you’ve likely found a real edge.
"The fastest traders aren't guessing - they're repeating what they've already tested." – FX Replay
For day traders, minute-by-minute or tick-level backtesting is more effective than end-of-day tests. This approach simulates real-time market conditions, including news spikes and execution timing, helping you develop the muscle memory needed for live trading.
Once your setup is validated, the next challenge is sticking to your trading plan consistently.
Following Your Trading Plan
A trading plan is meaningless if you abandon it when emotions take over. Spend 15–30 minutes before the market opens reviewing higher timeframe trends, marking key levels (like the prior day’s high/low or VWAP), and noting any red-flag news events. This preparation creates a "session plan" that keeps you focused on quality trades instead of impulsive ones.
Use bracket orders to automatically attach stop-loss and take-profit levels to your trades. Set a max daily loss limit, such as 1.5% of your account, and follow a "two-loss" rule - stop trading after two consecutive losses. This approach caps your daily drawdown and helps you avoid revenge trading.
If emotions like anger or fear start to interfere, step away from your desk to regain composure. Only return when you’re calm. After each session, dedicate 10–20 minutes to reviewing your trades. Log the reasons for each entry, whether you followed your rules, and rate your emotions on a scale of 1–5. This helps you identify patterns in your behavior.
| Item | Example Rule |
|---|---|
| Max Risk per Trade | 0.5% of account |
| Max Daily Loss | 1.5%, then stop trading |
| News Filter | Avoid trades 5 min before/after red-flag news |
| Trade Window | 9:45 AM – 11:30 AM ET |
"The goal is not to trade more. The goal is to trade better." – Joshua Soriano, Writer, Quant Matter
Consistency is the cornerstone of successful day trading. Stick to your plan - even when it feels monotonous or you’re tempted to take "just one more trade."
Conclusion
High-probability setups aren't about chasing perfection - they're about consistently applying a proven strategy across futures, forex, and stock markets. The key to trading success lies in syncing your strategy with current market conditions, managing risk with precision, and keeping emotions out of the equation.
In today's heavily automated markets, every edge you have needs to be backed by solid data. With algorithms driving over 85% of price discovery in major futures contracts like the E-mini S&P 500, your goal isn't to predict tomorrow's market moves. Instead, it's about trading in the moment using tools like Volume Profile, VWAP alignment, and order flow imbalances. Intraday setups, in particular, help you avoid the risks of overnight gaps while leveraging statistical advantages that build up over hundreds of trades.
"By shifting to intraday futures trading strategies, you remove the burden of predicting what will happen tomorrow. You only trade what is happening right now." – QuantLabsNet
To execute with precision, your trading platform and infrastructure must meet the demands of your strategy. Even the most sophisticated technical analysis is useless without reliable tools. In futures markets where margins are tight, having a VPS with sub‑1ms latency can be the difference between hitting your entry point or facing slippage that eats into your edge. Pairing structured setups - like confluence zones and entry triggers - with low-latency data feeds and fast execution ensures your trades are based on accurate, real-time signals.
The formula for success is straightforward: rigorously test your setups, stick to your plan during both active and quiet periods, and invest in a high-performance trading infrastructure. Consistency, not complexity, wins the game. By combining precise strategies with reliable technology, you set yourself up for steady intraday trading success.
FAQs
How do I know a setup is truly high-probability?
A high-probability setup occurs when multiple reliable technical signals and favorable market conditions come together. Look for situations where at least three factors align, such as trend confirmation (using tools like EMA or VWAP), breakout signals, or momentum indicators. The best setups also include well-defined entry and exit rules, strict risk management practices, and fit the current market environment - whether it's trending or range-bound. This alignment can help boost consistency in your trading approach.
What’s the best ORB timeframe for futures, forex, and stocks?
The ideal Opening Range Breakout (ORB) timeframe largely depends on your trading approach. For futures trading, the 5-minute ORB stands out as a dependable choice. It often breaks with strong momentum and has a solid continuation rate, making it a favorite among traders seeking quick and consistent opportunities.
On the other hand, the 15-minute ORB is another popular option. It captures the early volume and price discovery phase, offering a blend of sensitivity and steadiness. This timeframe is particularly useful for those aiming to catch broader market movements.
To sum it up, the 5-minute ORB is preferred for its reliability in fast trades, while the 15-minute ORB suits traders looking for more extended moves.
How do I size positions with ATR-based stops?
To determine position sizes using ATR-based stops, start by deciding how much of your total equity you're willing to risk on a single trade (as a percentage). Next, calculate the stop distance by multiplying the Average True Range (ATR) by a specific multiple that aligns with your strategy. Finally, divide the dollar amount you're risking by the ATR-based stop distance. This method helps maintain consistent risk management, even when market conditions fluctuate.


