
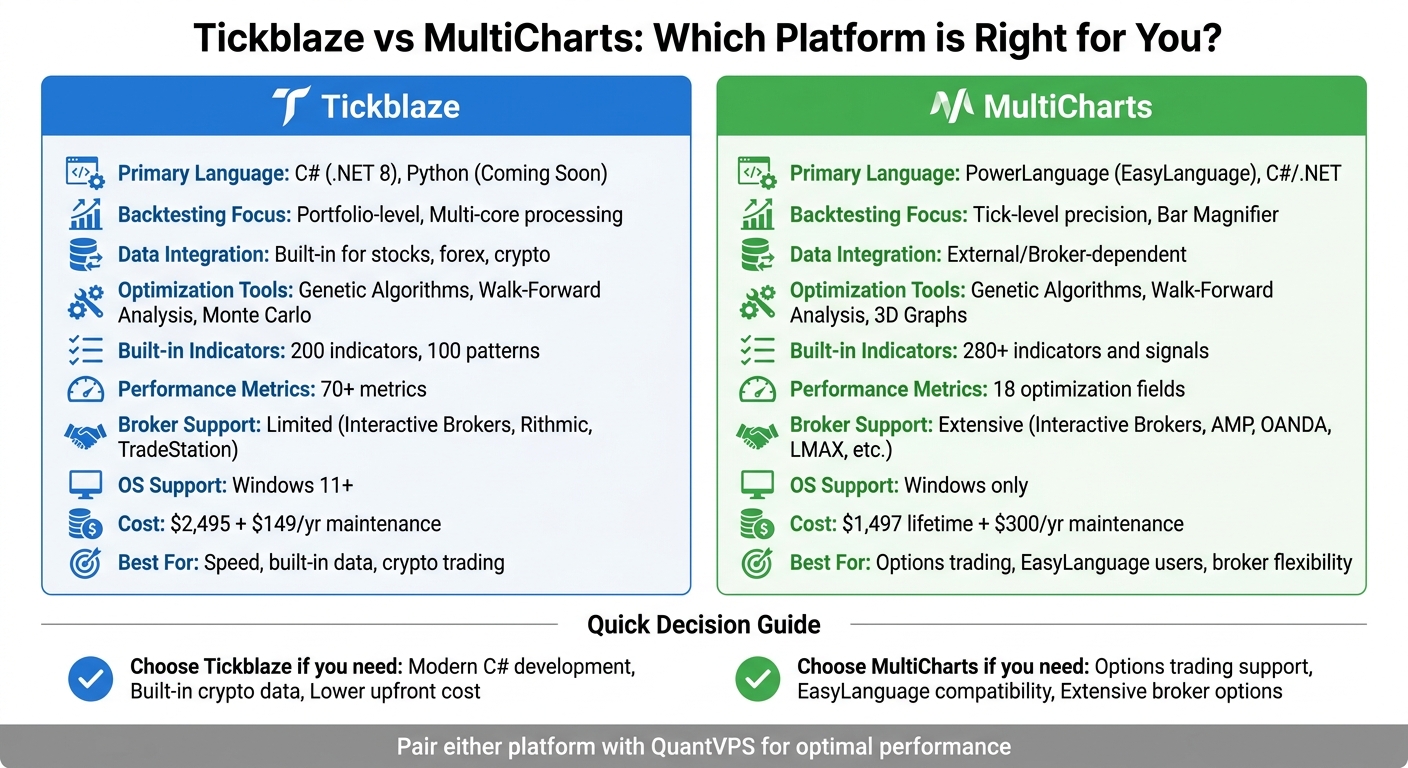
When it comes to strategy development and backtesting, Tickblaze and MultiCharts are two standout platforms, each with distinct advantages. If you're deciding between them, here's what you need to know:
- Tickblaze: A modern hybrid platform designed for manual and algorithmic trading. It excels in portfolio-level backtesting, supports C# (.NET 8) (with Python integration coming soon), and offers tools like Walk-Forward Analysis and Genetic Algorithms. It includes built-in data for stocks, forex, and crypto, but lacks support for options and fixed income. Pricing starts at $2,495 with a $149 annual maintenance fee after the first year.
- MultiCharts: Known for precision backtesting with features like tick-level data and Bar Magnifier. It supports PowerLanguage (EasyLanguage) and .NET, making it ideal for traders familiar with TradeStation scripts. It offers extensive broker support but requires external data feeds and has limited crypto capabilities. Pricing starts at $1,497 for a lifetime license, with $300 annual maintenance fees.
Quick Comparison
| Feature | Tickblaze | MultiCharts |
|---|---|---|
| Primary Language | C# (.NET 8), Python (Coming Soon) | PowerLanguage, C#/.NET |
| Backtesting Focus | Portfolio-level, Multi-core | Tick-level, Bar Magnifier |
| Data Integration | Built-in for stocks, forex, crypto | External/Broker-dependent |
| Optimization Tools | Genetic, Walk-Forward, Monte Carlo | Genetic, Walk-Forward, 3D Graphs |
| Cost | $2,495 + $149/yr maintenance | $1,497 + $300/yr maintenance |
Bottom Line: Choose Tickblaze for speed, built-in data, and crypto support. Opt for MultiCharts if you need options trading, extensive broker compatibility, or are already familiar with EasyLanguage. Pair either platform with a VPS for optimal performance.
Tickblaze vs MultiCharts Feature Comparison for Trading Strategy Development
Tickblaze Platform Overview
Tickblaze is a hybrid trading platform designed for both manual and automated trading. It features two distinct environments: a Standard Desktop for manual trading and a Strategy Desktop for backtesting, optimization, and automated execution. This dual setup allows users to seamlessly transition between chart analysis and systematic testing.
The Strategy Desktop enables portfolio-level backtesting across multiple symbols, asset classes, and time zones. Its multi-core backtesting engine is built to handle large datasets efficiently, speeding up analysis.
Tickblaze Features
Tickblaze supports strategy development using .NET 8 and C# 12.0, with Python 3 integration planned for the future. The platform provides 18 script types, including tools for custom indicators, optimization algorithms, and risk management modules. For those less familiar with coding, the no-code Strategy Wizard simplifies the process of setting entry/exit conditions and position sizing rules.
With 200 indicators and 100 patterns preloaded, users can test strategies right out of the box. Data integration is highly versatile, offering:
- The built-in Tickblaze Feed for historical equities data
- Direct connections to providers like Interactive Brokers, Polygon.io, DTN IQFeed, and Databento
- Custom data imports via text files or the Connectivity SDK
An automatic backfill feature detects and downloads missing historical data whenever the Strategy Desktop is launched, reducing manual data management.
Tickblaze’s optimization tools include Walk-Forward Analysis, Genetic Algorithms, Monte Carlo simulations, and brute-force methods. The platform provides over 70 performance metrics, such as MAE/MFE, profit distributions, and 3D optimization graphs. Its modular Algo Engine separates signal generation from execution logic, standardizing money management across multiple strategies.
The platform supports trading in equities, futures, forex, and cryptocurrencies. However, it does not currently offer options or fixed income markets. Broker connections include major names like Interactive Brokers, Rithmic, Trading Technologies, Binance, and Kraken. Additionally, Tickblaze provides free delayed and end-of-day data for stocks and futures, as well as real-time data for forex and crypto.
What Tickblaze Does Well
Tickblaze excels in portfolio-level backtesting, delivering quick insights through its multi-core processing capabilities. This efficiency saves traders significant time.
"Tickblaze accelerates quant research and deployment at a pace I've never seen. What takes a team weeks internally, Tickblaze delivers in days - with cleaner workflows and less overhead." – Former VP, Two Sigma
Run 24/7 while you sleep. Keep bots, platforms, and trade copiers online on a dedicated VPS.
Low-latency VPS hosting for your trading platform.
From $59.99/mo
Its flexible data integration options cater to a variety of trading needs, whether using retail data providers, institutional sources like Databento, or proprietary data imported via the SDK. The automatic backfill feature minimizes manual data handling, while the extensive library of indicators and patterns allows traders to start testing strategies immediately. For those new to coding, the Strategy Wizard provides a user-friendly entry point.
Tickblaze Drawbacks
One downside is the cost: the Hybrid Plan for strategy development is priced at $2,495 (approximately $208 per month), with an additional $149 annual maintenance fee starting in the second year. The Standard Plan for manual trading costs $1,995.
The reliance on C# adds a learning curve, even with resources like Tickblaze Academy. Python support, though promised, is not yet available. The platform’s lack of options and fixed income support may deter traders focused on those markets. Additionally, Tickblaze has specific hardware requirements, including Windows 11, an Intel Core i7 (11th Gen or later), and 16GB of RAM, which may necessitate system upgrades for some users.
Next, we’ll explore MultiCharts to see how its features and limitations compare.
MultiCharts Platform Overview
MultiCharts, introduced in 2005, was designed as a broker-agnostic alternative to TradeStation. This means traders aren't tied to a specific broker or data feed, offering compatibility with providers like Interactive Brokers, CQG, and Rithmic. This flexibility is a key advantage over proprietary platforms that limit users' options. It also allows for a variety of programming approaches suited to different levels of trading expertise.
The platform supports two programming environments: PowerLanguage for those less experienced with coding and MultiCharts .NET for developers familiar with C# or VB.NET. PowerLanguage ensures nearly full compatibility (99%) with TradeStation's EasyLanguage, simplifying the transition for traders with pre-existing strategies. For advanced developers, the .NET version - launched in 2012 - offers more extensive customization options.
MultiCharts accommodates trading in futures, stocks, and forex across its supported brokers. However, cryptocurrency support remains limited and typically requires third-party tools or routing through Interactive Brokers. It comes equipped with over 280 indicators, signals, and drawing tools, providing a robust foundation for technical analysis right out of the box.
The platform's backtesting engine uses tick-level data and a feature called Bar Magnifier, which examines intra-bar price movements to simulate realistic order fills. This approach minimizes look-ahead bias and assumptions based on bar-close prices, leading to more accurate backtest results. Similar to Tickblaze, MultiCharts prioritizes precision in backtesting to refine strategy performance. Additionally, the platform boosts calculation speeds by compiling code into binary.
"MultiCharts is not flashy, not cheap, and not for casual traders. But for its target audience - professional systematic traders - it delivers unmatched precision, reliability, and flexibility." – BrokersDB Editorial
MultiCharts Features
MultiCharts offers several optimization methods to enhance strategy development:
- Exhaustive search for strategies with a few parameters
- Genetic algorithms for efficiently managing hundreds of parameters
- 3D optimization graphs to visually identify stable performance zones
The genetic optimizer is particularly useful, finding near-optimal solutions much faster than brute-force testing. This complements Tickblaze's optimization tools while employing a different approach.
The platform also includes Walk-Forward Analysis, which tests strategy robustness using out-of-sample data. Monte Carlo simulations further evaluate how strategies might perform under various market conditions, helping traders avoid overfitting their models. For those preferring Python-based environments, you can also build and backtest trading strategies using Backtrader.
To handle large datasets, MultiCharts employs multi-threading, distributing optimization tasks across all CPU cores. Its 64-bit architecture supports portfolio-level testing across multiple symbols simultaneously. Traders can even define custom fitness functions using the SetCustomFitnessValue keyword, optimizing for specific goals like maximizing profit while minimizing drawdowns.
Additional tools include a Market Scanner for real-time monitoring of thousands of symbols based on custom criteria and the QuoteManager module, which allows traders to fine-tune data sources and session intervals to align with specific exchange hours. External DLLs written in other programming languages can also be integrated for added functionality.
The optimization report is packed with 18 performance fields, which can be filtered and sorted to identify the best parameter combinations. Recent updates, such as those in Version 16, introduced features like .xlsx export for reports (no Microsoft Excel required) and new drawing tools like Sine Lines and Cyclic Lines.
What MultiCharts Does Well
MultiCharts has earned accolades from Technical Analysis of Stocks & Commodities magazine, winning awards in 2022, 2023, and 2024. Key strengths include its unparalleled backtesting accuracy and the freedom to choose from a wide range of brokers and data feeds. This broker-agnostic setup is especially valuable for traders who already have established brokerage relationships or need access to niche markets.
The platform supports a variety of brokers for futures (e.g., AMP Futures, Dorman Trading, Optimus Futures, Phillip Capital), forex (e.g., FXCM, OANDA, LMAX), and data feeds (e.g., Rithmic, CQG, dxFeed, IQFeed). PowerLanguage simplifies strategy development with its English-like syntax, allowing traders to create strategies by combining pre-built signals - like pairing a "Channel Breakout" entry with a "Profit Target" exit - without writing new code. For those who need more control, the .NET version unlocks the full potential of C# and VB.NET.
"High calculation speeds are possible because code is compiled, not interpreted. Your code is translated into binary language (0 and 1), which automatically results in a dramatic increase in performance." – MultiCharts
The platform's reliability and stability make it a favorite among professional systematic traders. Its tick-level simulation and Variable Tick Resolution feature ensure efficient performance by using different data resolutions for various strategy components.
MultiCharts Drawbacks
One of the most notable downsides is the pricing. A lifetime license costs $1,497, which includes one year of updates. After that, users pay an annual maintenance fee of about $300. Alternatively, traders can opt for an annual lease ($497–$600 per year) or a monthly subscription (around $59 per month). On top of this, data feed expenses - such as IQFeed, which typically costs $80 to $120 per month - can add up.
MultiCharts is Windows-only, meaning Mac users need to use virtualization tools like Parallels to run the software. There's no native support for macOS, Linux, or mobile devices, which can be a disadvantage compared to cloud-based platforms that work across multiple systems.
The platform also has a steep learning curve, especially for advanced features. Some users have criticized its dated interface and reported occasional bugs in simulation mode, as well as issues with data loading and replay accuracy. Customer support has faced complaints about slow response times and billing problems.
Cryptocurrency trading is another weak spot. Unlike Tickblaze, which connects directly to major crypto exchanges like Binance and Kraken, MultiCharts relies on workarounds through Interactive Brokers or third-party bridges. Additionally, the platform lacks native support for options and fixed-income markets, limiting its appeal for traders focused on those areas. These factors highlight both the strengths and limitations of MultiCharts, setting the stage for a detailed comparison with other platforms.
Tickblaze vs. MultiCharts: Side-by-Side Comparison
This side-by-side comparison breaks down the key features of Tickblaze and MultiCharts. Both platforms excel in backtesting and strategy development but cater to different needs. Tickblaze markets itself as a modern, free option with built-in data and an emphasis on speed and portfolio-level testing. MultiCharts, on the other hand, highlights precision, broker flexibility, and professional-grade reliability.
Tickblaze is free for retail traders, with an annual maintenance fee of $149 kicking in after the first year. MultiCharts, however, requires a $1,497 lifetime license (including one year of updates) or a $600 annual lease, plus $300 annually for continued support and external data subscriptions. Here’s a quick look at how they stack up:
Feature Comparison Table
| Feature | Tickblaze | MultiCharts |
|---|---|---|
| Primary Language | C# (.NET 8), Python (Coming Soon) | PowerLanguage (EasyLanguage), C#/.NET |
| Backtesting Focus | Speed, Multi-core, Portfolio-level | Precision, Tick-level, Bar Magnifier |
| Data Integration | Built-in delayed and end-of-day, Forex, Crypto | External/Broker-dependent |
| Optimization Tools | Genetic, Walk-Forward, 3D Graphs | Genetic, Walk-Forward, 3D, Monte Carlo equity-curve simulations |
| Built-in Indicators | Nearly 200 indicators, 100 patterns | Over 300 indicators and studies |
| Performance Metrics | Over 70 metrics | 18 optimization fields |
| Broker Support | Limited (Interactive Brokers, Rithmic, TradeStation) | Extensive (Interactive Brokers, AMP, OANDA, LMAX, etc.) |
| OS Support | Windows 11 or later | Windows only |
| Cost | Free for retail ($149/yr maintenance) | $1,497 Lifetime or $600/yr Lease |
Stay online and closer to execution. Choose a VPS location for CME futures, New York markets, London FX, API trading, and more.
Host your platform near the market route that matters.
From $59.99/mo
Tickblaze Advantages and Disadvantages
Tickblaze offers built-in delayed and end-of-day data for stocks and futures, as well as real-time data for forex and crypto. This eliminates the need for third-party data subscriptions. For beginners, the "Strategy Wizard" provides a visual interface to create strategies without coding, while advanced users can leverage C# with .NET 8 (Python support is on the way).
The platform’s multi-core backtesting engine maximizes CPU usage, making it incredibly fast for large datasets. Its "Strategy Desktop" supports testing and trading multiple strategies across various asset classes and time zones in one unified space. Additionally, its hybrid setup separates manual trading (Standard Desktop) from automated trading (Strategy Desktop), giving users flexibility.
That said, Tickblaze has its limitations. It supports only a few brokers, and as a newer platform, it lacks a long-established reputation. It also requires Windows 11 or later and recommends high-performance hardware, like an Intel Core i7 (11th Gen or newer) and 16GB of RAM, for smooth operation.
MultiCharts Advantages and Disadvantages
MultiCharts has earned multiple "Best Trading Software" awards from Stocks & Commodities magazine, cementing its reputation as a top-tier platform. Its broad broker support includes Interactive Brokers, AMP Futures, OANDA, and LMAX, making it a versatile choice for traders with diverse needs or existing brokerage relationships.
The platform’s backtesting is known for its precision, thanks to features like "Bar Magnifier" technology and tick-level simulation, which help produce more realistic results. PowerLanguage is highly compatible with TradeStation’s EasyLanguage, making it easy for traders to transition their strategies. For developers, MultiCharts’ .NET version supports C# and VB.NET, allowing integration with external libraries, databases, and even machine learning tools.
However, MultiCharts is not without drawbacks. It has a steep learning curve and a somewhat outdated interface. Ongoing costs for data feeds can add up, and its Windows-only availability may limit some users. Cryptocurrency trading is also less straightforward, often requiring broker workarounds. Some users have reported occasional bugs in simulation mode and data loading issues.
VPS Hosting for Better Performance
Why Trading Platforms Need VPS Hosting
When it comes to strategy development and backtesting, your local system can quickly become a bottleneck. Both Tickblaze and MultiCharts demand powerful setups, especially when working with large datasets or running complex portfolio optimizations. Unfortunately, home setups often fall short due to common issues like latency, interruptions, or hardware limitations.
Think about it: power outages, Wi-Fi drops, or even accidental shutdowns can bring your automated strategies to a halt. On top of that, backtesting tasks can hog your CPU, leaving your computer sluggish and unusable for anything else. These challenges make it clear why a VPS (Virtual Private Server) is the smarter choice.
A VPS eliminates these hurdles by providing dedicated resources, high-performance hardware, and round-the-clock uptime, all independent of your local setup. For traders, especially those using high-frequency or automated strategies, low-latency trading infrastructure is a game-changer. A VPS located near major exchanges - like Chicago for CME Group - can reduce network latency to as low as 0.4ms, ensuring faster order execution and minimal delays in data feeds. That’s a huge advantage over the much slower residential internet connections most home setups rely on.
QuantVPS for Tickblaze and MultiCharts
A dedicated VPS like QuantVPS is designed to handle the specific needs of demanding trading platforms. It tackles the hardware and connectivity issues that often plague local systems, offering a reliable infrastructure for uninterrupted performance.
QuantVPS provides sub-0.52ms connectivity to the CME from its Chicago datacenter, making it ideal for futures traders using Tickblaze or MultiCharts. With a 99.999% uptime SLA, your strategies stay active 24/7 - even if your personal computer is off.
The hardware is built for performance. Plans feature AMD EPYC and Ryzen processors, DDR5 RAM, and NVMe M.2 SSDs, all of which are perfect for handling heavy workloads like multi-core backtesting and portfolio optimization. For instance, Tickblaze's "Multi-Core" mode can utilize 100% of the VPS’s CPU cores, allowing you to process large datasets quickly without slowing down your local machine. Similarly, MultiCharts users benefit from ample resources to manage multiple charts, tick-level simulations, and external data feeds simultaneously.
QuantVPS also prioritizes security. Features like DDoS protection, custom firewall rules, and secure remote desktop access ensure that your trading environment remains safe. You can even manage strategies remotely via a secure gateway, with multi-monitor RDP support to replicate your local setup. To put its capacity into perspective, as of May 3, 2026, over $88 billion was traded in a single week across QuantVPS servers, showcasing its ability to handle serious trading volume.
With QuantVPS, both Tickblaze and MultiCharts run seamlessly, giving you the tools and stability to refine your strategies without compromise. Whether it’s speed, reliability, or power, this VPS solution has you covered.
Which Platform Should You Choose?
Main Points to Remember
Tickblaze and MultiCharts are both powerful tools for backtesting and strategy development, but they cater to different types of traders. Tickblaze is free for retail users during the first year (with a $149 annual maintenance fee afterward) and supports modern programming languages like C# (.NET 8) and Python 3. It’s a solid choice for developers who are comfortable coding and want to work with stocks, futures, forex, and crypto. However, it doesn’t currently support options or fixed-income trading. Tickblaze also provides built-in delayed and end-of-day data for stocks and futures, along with real-time data for forex and crypto.
On the other hand, MultiCharts operates on a subscription model and uses PowerLanguage, which is compatible with EasyLanguage. This makes it a better fit for traders who are already familiar with trading-specific scripting. MultiCharts supports options trading, which is a significant advantage if your strategies involve this asset class. It’s also known for its strong optimization capabilities and portfolio backtesting that accounts for correlation effects. However, you’ll usually need to source your own data, and the platform has a steeper learning curve.
"MultiCharts is what serious systematic traders pick when they want optimization horsepower and portfolio backtesting that actually works." - Quant Trading Tools
For those interested in automated trading for beginners, MultiCharts offers pre-built signals that can be combined without writing new code. Tickblaze, meanwhile, includes a Strategy Wizard for beginners and uses a hybrid architecture that separates discretionary trading from quantitative research. Additionally, Tickblaze provides broker connections tailored to its supported asset classes. These distinctions can help you decide which platform better suits your trading needs.
Platform and Hosting Recommendations
When choosing between these platforms, consider your coding skills, the asset classes you trade, and your budget. Tickblaze is ideal if you prefer modern programming languages, need cost-effective software, or trade across multiple asset classes (excluding options). MultiCharts is the better choice if you require options trading, already use EasyLanguage scripts, or need advanced optimization for complex portfolio strategies.
To get the most out of either platform, pair it with QuantVPS to eliminate hardware limitations. Both Tickblaze and MultiCharts demand significant computing resources for multi-core backtesting, and QuantVPS provides the power you need. Their hardware features AMD EPYC and Ryzen processors, DDR5 RAM, and NVMe SSDs, ensuring fast performance. With ultra-low latency connectivity and a 100% uptime guarantee, QuantVPS helps you overcome local hardware and connectivity issues, enabling you to develop, test, and deploy your strategies with ease.
FAQs
Which platform is easier to learn if I’m new to coding?
Tickblaze is often a better starting point for beginners because of its straightforward design, which simplifies the learning process. It allows users to script in Python and C#, offering plenty of resources and a supportive community to help along the way. On the other hand, MultiCharts demands knowledge of PowerLanguage or comparable tools, which can be a hurdle for those just starting out. Thanks to its intuitive interface, Tickblaze is a more approachable option for anyone new to coding.
What data do I need to buy to backtest reliably on each platform?
For reliable backtesting, having access to high-quality historical market data tailored to your specific asset classes is crucial. Tickblaze simplifies this by offering integrated delayed and end-of-day data for stocks and futures, along with real-time data for forex and crypto. On the other hand, MultiCharts requires you to either import data or connect to supported providers to ensure accurate historical data. Whichever platform you use, clean and precise data is the foundation for effective backtesting and strategy validation.
How do I choose between speed (portfolio tests) and accuracy (tick tests)?
When deciding between speed (portfolio tests) and accuracy (tick tests), it all boils down to your trading goals and the type of strategy you're working with.
- Portfolio tests prioritize speed, making them great for testing strategies across multiple assets and timeframes. However, they might overlook some finer market details.
- Tick tests, on the other hand, are all about precision. They provide detailed data for strategies where exact order execution is critical. The trade-off? They're slower and demand more resources.
Your choice should align with your strategy's specific needs and the resources you have at your disposal.


