
Swing trading requires precision and speed to identify opportunities in a crowded market. Stock screeners simplify this process by filtering thousands of stocks based on specific criteria, such as technical indicators, volume, and fundamentals. Here’s a quick look at five top tools for swing traders:
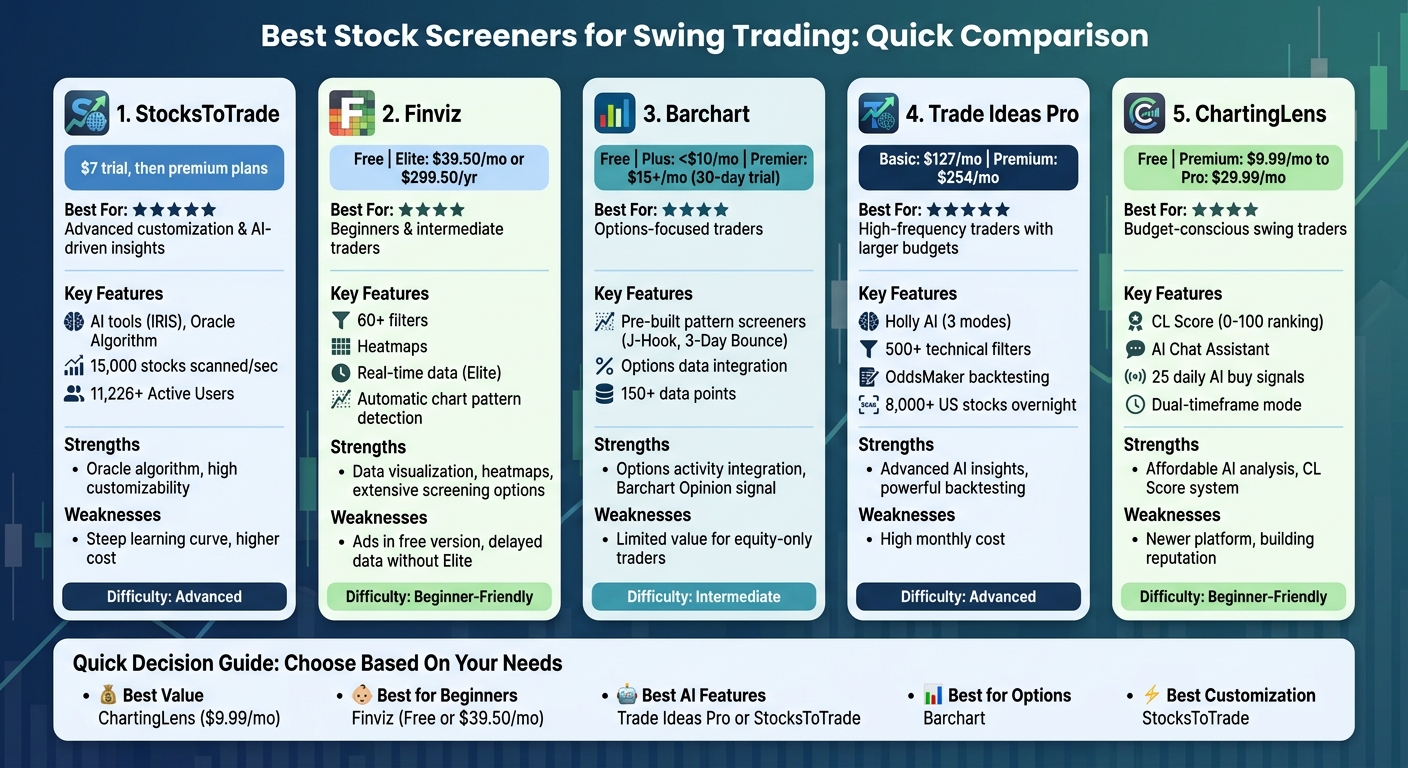
- StocksToTrade: Advanced customization, AI tools like IRIS, and Oracle Algorithm for high-probability trade ideas. Pricing starts at $7 for a trial.
- Finviz: User-friendly interface with over 60 filters, heatmaps, and real-time data in the Elite plan ($39.50/month).
- Barchart: Pre-built pattern screeners and options data integration. Pricing starts at $0 with a Premier option under $10/month.
- Trade Ideas Pro: AI-driven insights with Holly AI and real-time alerts. Premium plans cost $127–$254/month.
- ChartingLens: Affordable AI-powered chart analysis and CL Score ranking system. Starts at $0, with Premium at $9.99/month.
Quick Comparison
| Screener | Key Feature | Price Range | Best For |
|---|---|---|---|
| StocksToTrade | AI tools, Oracle Algorithm | $7 trial, premium plans | Advanced customization |
| Finviz | Heatmaps, 60+ filters | $0–$39.50/month | Beginners and intermediate traders |
| Barchart | Pattern screeners, options data | $0–$15+/month | Options-focused traders |
| Trade Ideas Pro | AI insights, real-time alerts | $127–$254/month | High-frequency traders |
| ChartingLens | AI charting, CL Score system | $0–$9.99/month | Budget-conscious swing traders |
Each tool offers unique features tailored to different trading styles and budgets. Choose one that aligns with your needs, whether you prioritize AI-driven insights, affordability, or advanced technical filters.
Stock Screener Comparison for Swing Trading: Features, Pricing & Best Use Cases
1. StocksToTrade
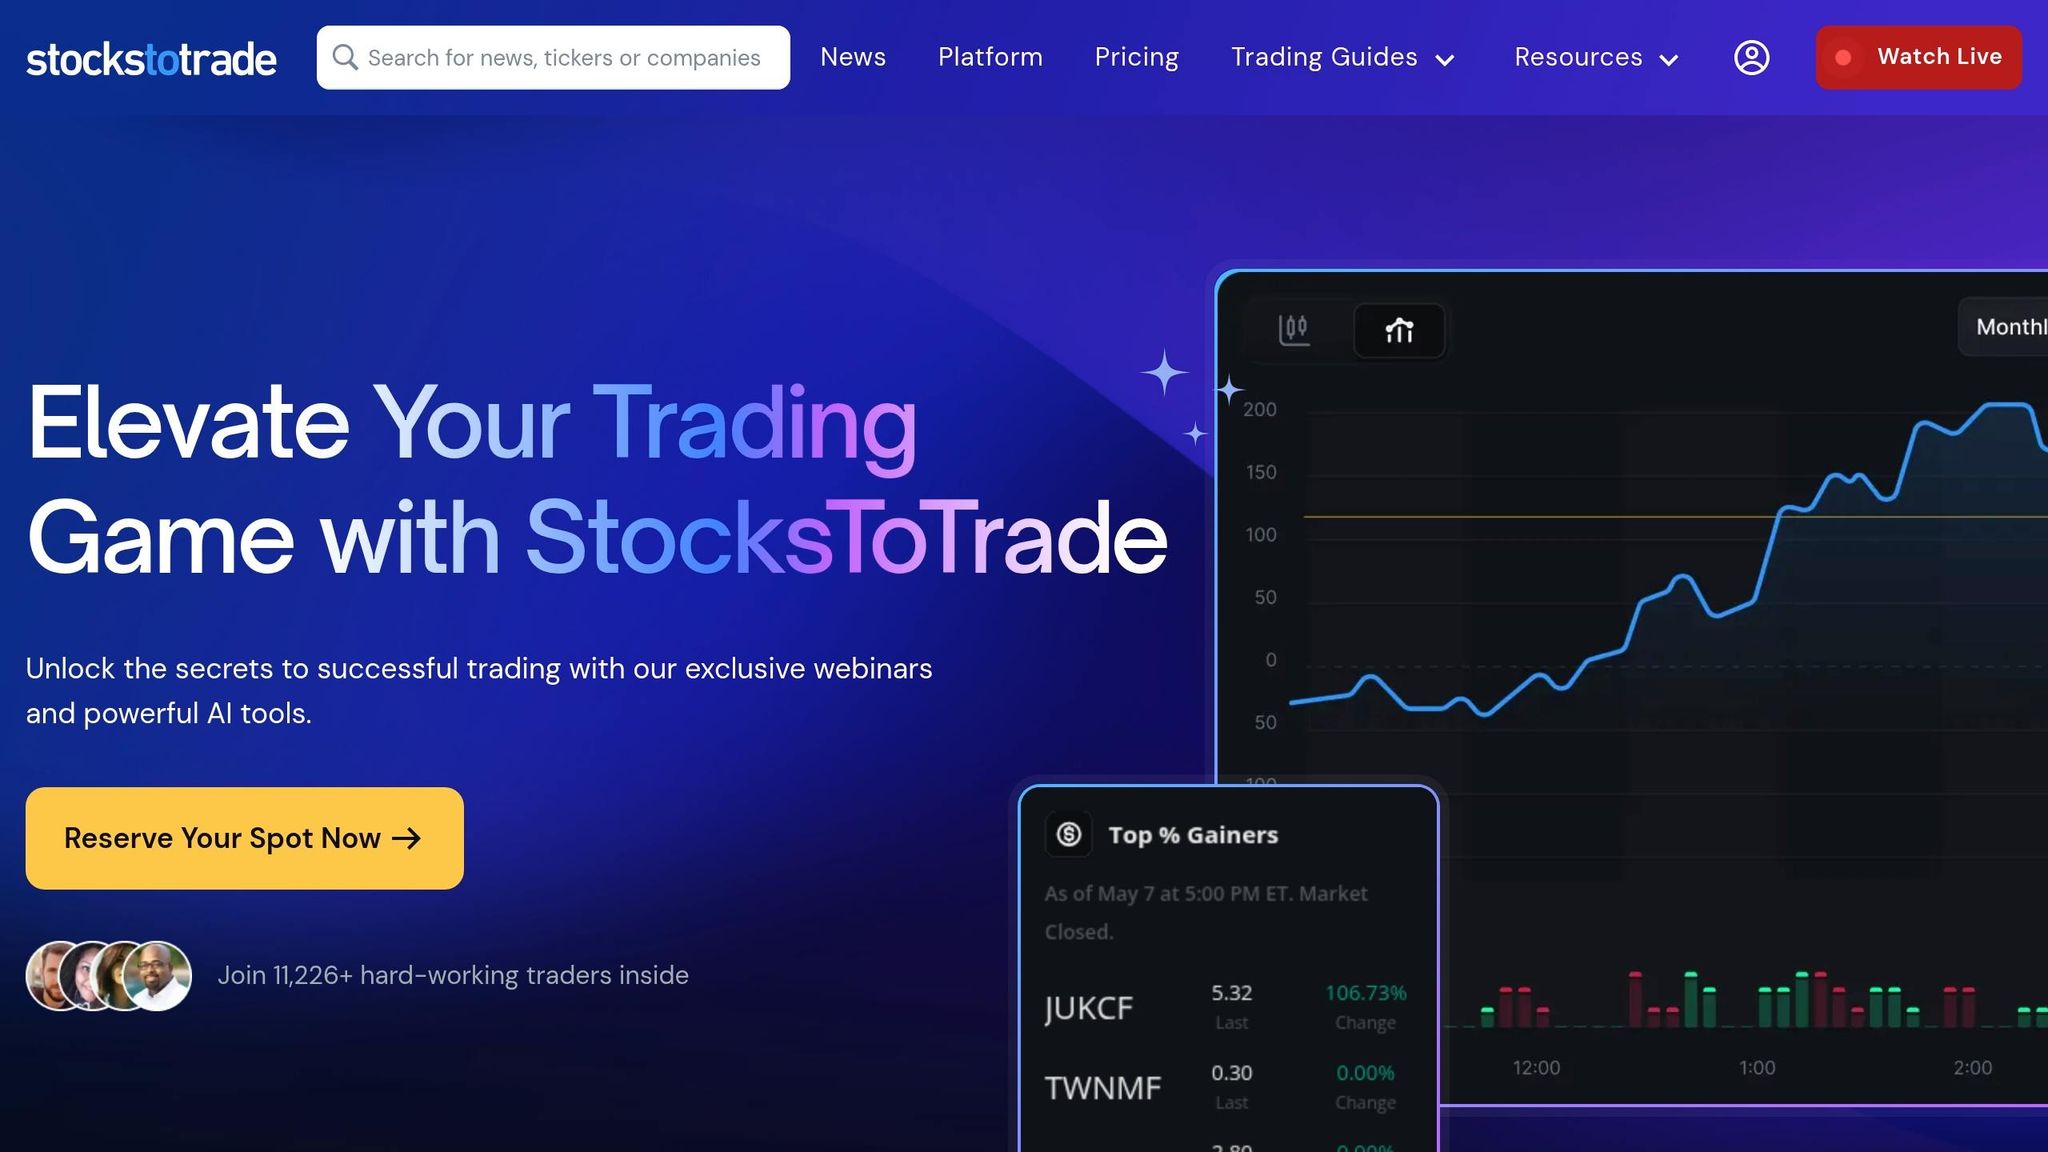
StocksToTrade markets itself as a platform created by traders, for traders, offering deep customization that goes far beyond standard stock filtering. Tim Bohen, Lead Trainer at StocksToTrade, describes it as an essential tool in his trading routine, stating: "StocksToTrade is an irreplaceable part of my trading day... because it's an insanely customizable screener that lets me scan with any parameters I want". With over 11,226 active users and the ability to process approximately 19,000 stocks weekly, it’s clear this platform is designed to cater to serious traders. Let’s break down what makes StocksToTrade stand out for swing trading.
Technical Filters
StocksToTrade comes equipped with pre-built scans tailored for swing trading setups, such as stocks near 52-week highs and low-float stocks. Its Oracle Algorithm is a standout feature, scanning 15,000 stocks every second and generating 20 trade opportunities daily at market open, all with a 5-to-1 risk-reward ratio. This ensures traders get a curated list of candidates that meet strict criteria. On top of that, you can filter by trending sectors, key support levels, and technical indicators like moving averages, Bollinger Bands, and RSI.
But the platform doesn’t stop at technical analysis. It also includes a wealth of fundamental data to support decision-making.
Fundamental Filters
StocksToTrade integrates real-time SEC filings, company profiles, and news directly into its interface. For even deeper insight, the TipRanks add-on (available for $8.95/month or $89.50/year) provides detailed ratings from analysts, insiders, and hedge funds, categorizing stocks from "Strong Buy" to "Strong Sell". Traders can track Form 4 filings for insider buying or 13D/G filings for institutional investments - both of which often signal potential multi-day price moves. Additionally, the platform highlights related companies within the same industry, making it easier to spot sector trends or identify lagging stocks.
To further enhance its capabilities, StocksToTrade incorporates advanced AI tools.
AI Features
The platform’s AI-powered screener, IRIS, is a game-changer. Trained on over a decade of trading data, IRIS can quickly analyze SEC filings, pinpoint strong fundamentals, and automatically mark support and resistance levels on charts. It even provides entry, exit, and position sizing recommendations. Each night, IRIS compiles a watchlist of top swing setups, and you can type in any ticker to get a real-time score. Meanwhile, the Oracle tool delivers algorithm-driven chart analysis and actionable trade signals for the most tradable stocks of the day.
Pricing
StocksToTrade offers a 14-day trial for $7, making it accessible for traders to test its features. Additional tools include Level 2 Data ($29/month or $345/year), Breaking News Chat ($49/month or $490/year), and Small Cap Rockets ($50/month or $500/year). For users who sign up, Oracle trade alerts are included at no extra cost. This pricing reflects the platform’s focus on delivering targeted, actionable insights for swing traders.
Run 24/7 while you sleep. Keep bots, platforms, and trade copiers online on a dedicated VPS.
Low-latency VPS hosting for your trading platform.
From $59.99/mo
2. Finviz
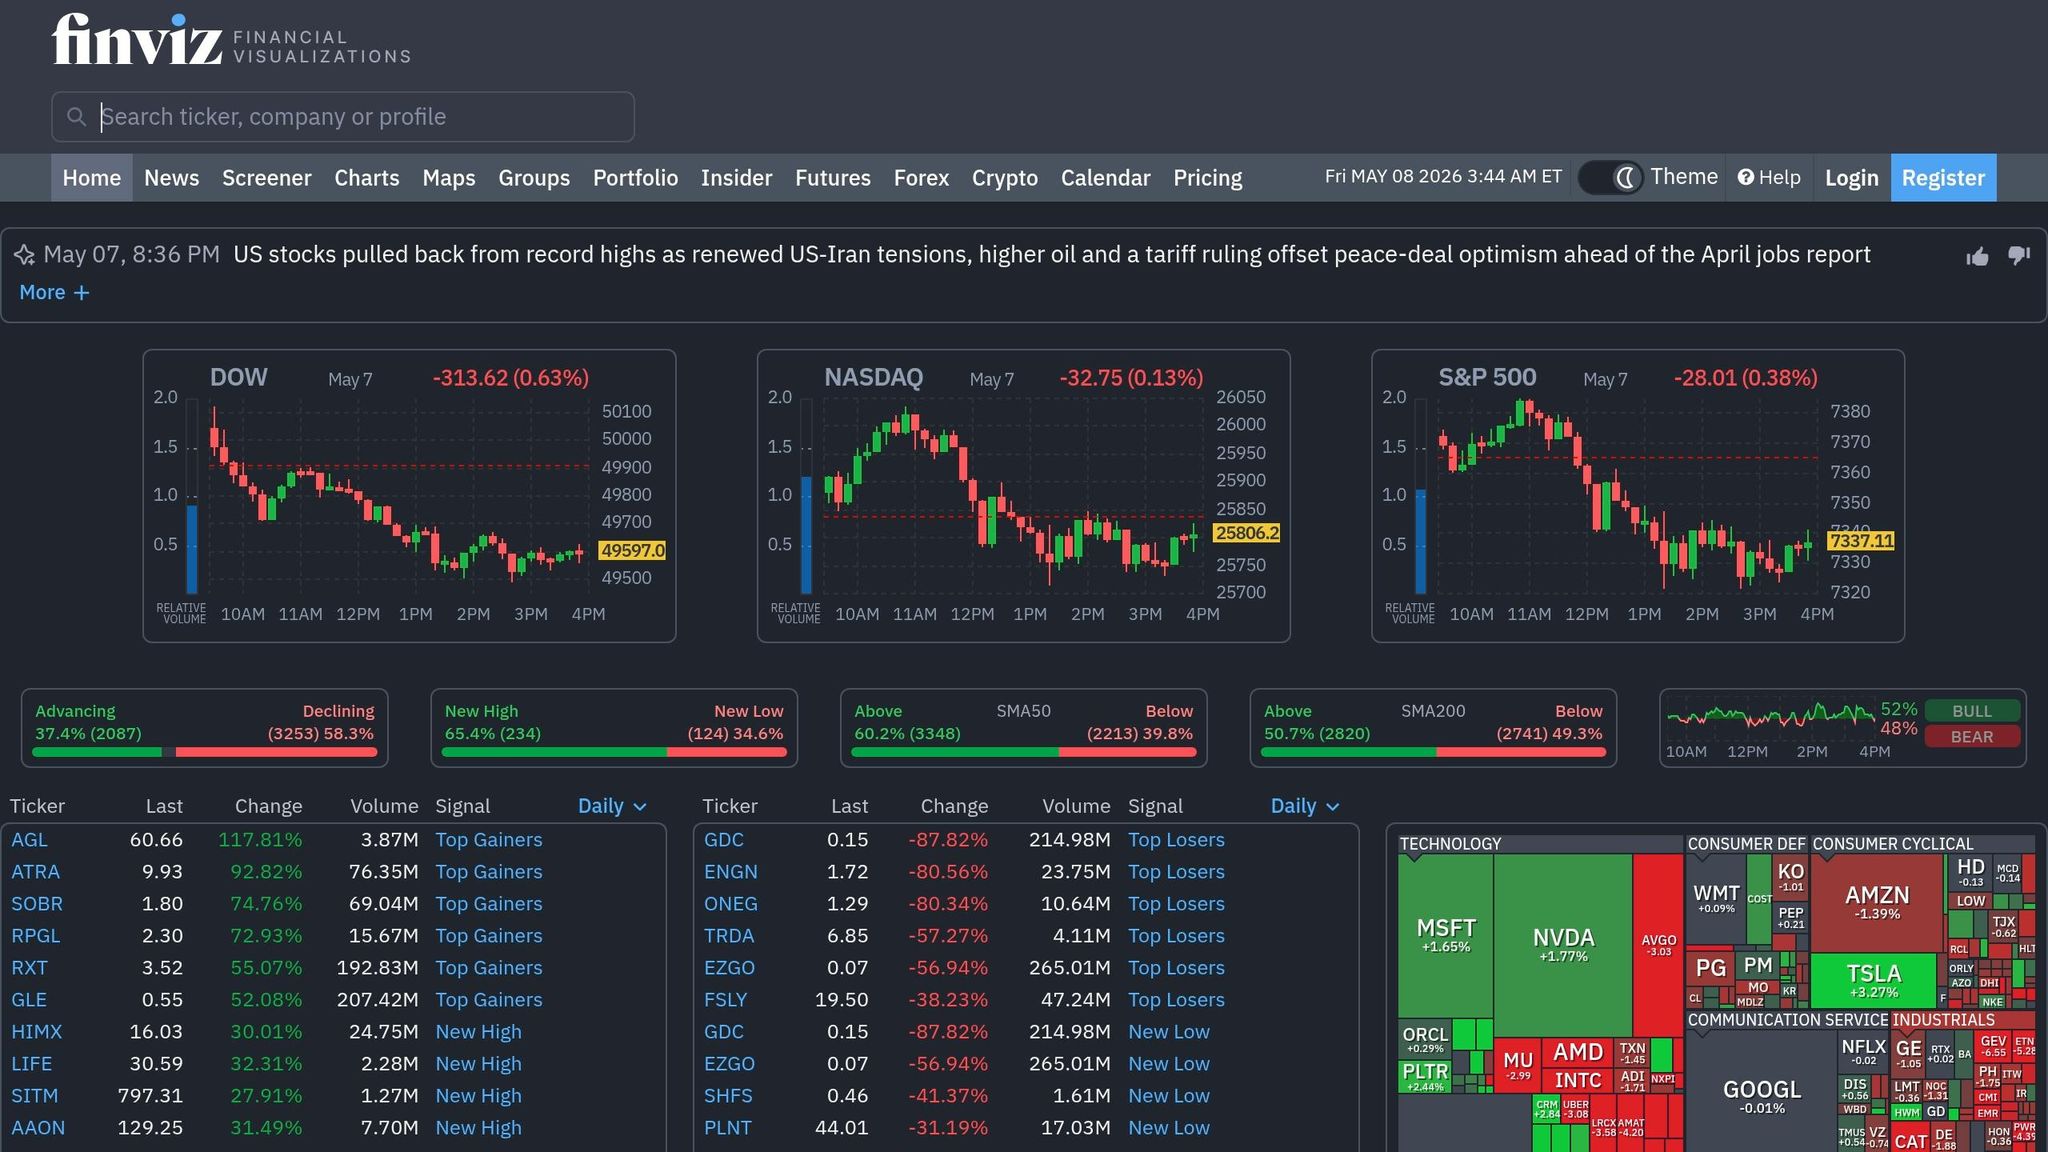
Finviz is a go-to platform for swing traders who need a quick and efficient way to filter stocks. Its visually appealing interface and over 60 screening criteria make it a favorite among users, earning high ratings for ease of use and functionality. Blain Reinkensmeyer, Managing Partner at StockBrokers.com, highlights its strengths: "The FINVIZ.com stock screener stands out for its large selection of fundamental stock criteria and overall functionality, and it can present fundamental data visually". These features underscore its strong technical filtering tools.
Technical Filters
Finviz simplifies the process of identifying potential setups by offering filters based on key indicators like RSI, SMAs (20-, 50-, and 200-day), and ATR. It also automatically detects chart patterns, providing traders with a faster way to spot opportunities. The platform's "Signals" dropdown flags conditions such as unusual volume, overbought/oversold levels, and breakouts, which are particularly helpful for swing traders.
One standout feature is the "Relative Volume" (RVOL) filter, which highlights stocks showing unusual trading activity compared to their three-month average. This can help pinpoint stocks with high swing trade potential. Additionally, traders can analyze performance changes across various timeframes, from one week to ten years, and use the "hover-to-view" feature to preview chart thumbnails by simply hovering over a ticker.
Fundamental Filters
Finviz complements its technical tools with over 30 fundamental metrics, allowing traders to evaluate a stock's financial health. These metrics include earnings growth, P/E ratios, PEG, and Debt/Equity, along with ownership data that reveals insider and institutional activity. For those targeting short-squeeze opportunities, the Short Float filter is particularly valuable. By focusing on stocks with 15–20% or higher short interest and combining this with bullish chart patterns, traders can uncover promising setups.
The "Earnings Date" filter is another useful tool, helping traders avoid - or strategically plan for - volatile earnings announcements. Combining fundamental data with technical indicators, like pairing positive EPS growth with an oversold RSI, can enhance the screening process and improve trade selection.
Pricing
Finviz offers both free and premium options to cater to different trader needs. The free plan is ideal for swing traders who rely on end-of-day data. It includes delayed quotes (15-minute delay for NASDAQ, NYSE, and AMEX), access to over 60 filters, and the platform's signature heatmaps.
For more active traders, Finviz Elite provides additional features at $39.50 per month or $299.50 per year (about $24.96 per month when billed annually). This plan includes real-time data, pre-market scanning, advanced charts, backtesting trading strategies, email alerts, and CSV export capabilities. Compared to professional day-trading scanners, which often cost between $118 and $228 per month, Finviz Elite is a more budget-friendly option. While the free version is ad-supported and lacks export functionality, it remains an excellent choice for end-of-day research.
3. Barchart
Barchart simplifies swing trade detection with its pre-built pattern screeners and integrated options data. These tools are designed to save time and make identifying potential trades easier. For instance, it offers ready-made screens for setups like the J-Hook pattern (an uptrend interrupted by a brief dip before resuming), 3-Day Bounce (stocks showing bullish momentum after a short pullback), and Moving Average Crosses such as Golden Cross and Death Cross signals. These pre-configured screeners eliminate the need to create complex filter combinations, making trade identification more efficient. Once a screener is applied, traders can refine their selections further using detailed technical filters.
Technical Filters
Barchart's Barchart Opinion combines 13 technical indicators into a single buy/sell signal, offering a quick way to assess a stock's momentum. For example, filtering for stocks with a "100% Buy" signal sustained for over a month can highlight stocks with ongoing momentum. Another useful metric is Weighted Alpha, which measures price appreciation over the past year, giving more weight to recent performance. This helps traders identify current market leaders. After running a screen, the Flipcharts feature allows users to cycle through full-page charts of the results, making it easy to visually confirm setups like breakouts or pullbacks.
What sets Barchart apart is its integration of options data. Traders can filter for unusual options activity, implied volatility rank, and open interest alongside technical indicators. This is especially helpful for swing traders who use options data to confirm their stock trading strategies.
Fundamental Filters
Barchart also offers more than 150 data points for custom screening, covering metrics like sales growth, cash flow, shareholder equity, and market cap (ranging from micro to mega). Its Value Investing Screener uses criteria inspired by Warren Buffett and Benjamin Graham to identify companies with strong fundamentals. For swing or position traders, combining these fundamental metrics with technical triggers - such as pairing strong cash flow with a Golden Cross - ensures that both the company's financial health and price momentum align with the trade.
Pricing
Barchart's pricing options cater to different levels of trader needs. The free account allows users to save one custom screener and limits results to 20 stocks. For under $10 per month, Barchart Plus removes these restrictions, offering access to all screener results for stocks, ETFs, and funds, along with 10 saved custom screeners and watchlists. For more advanced users, Barchart Premier provides unlimited custom screeners, downloads of up to 5,000 results, and automated screener emails sent at key times like market open or close. Premier also includes a 30-day free trial, letting traders explore its full capabilities before committing.
4. Trade Ideas Pro
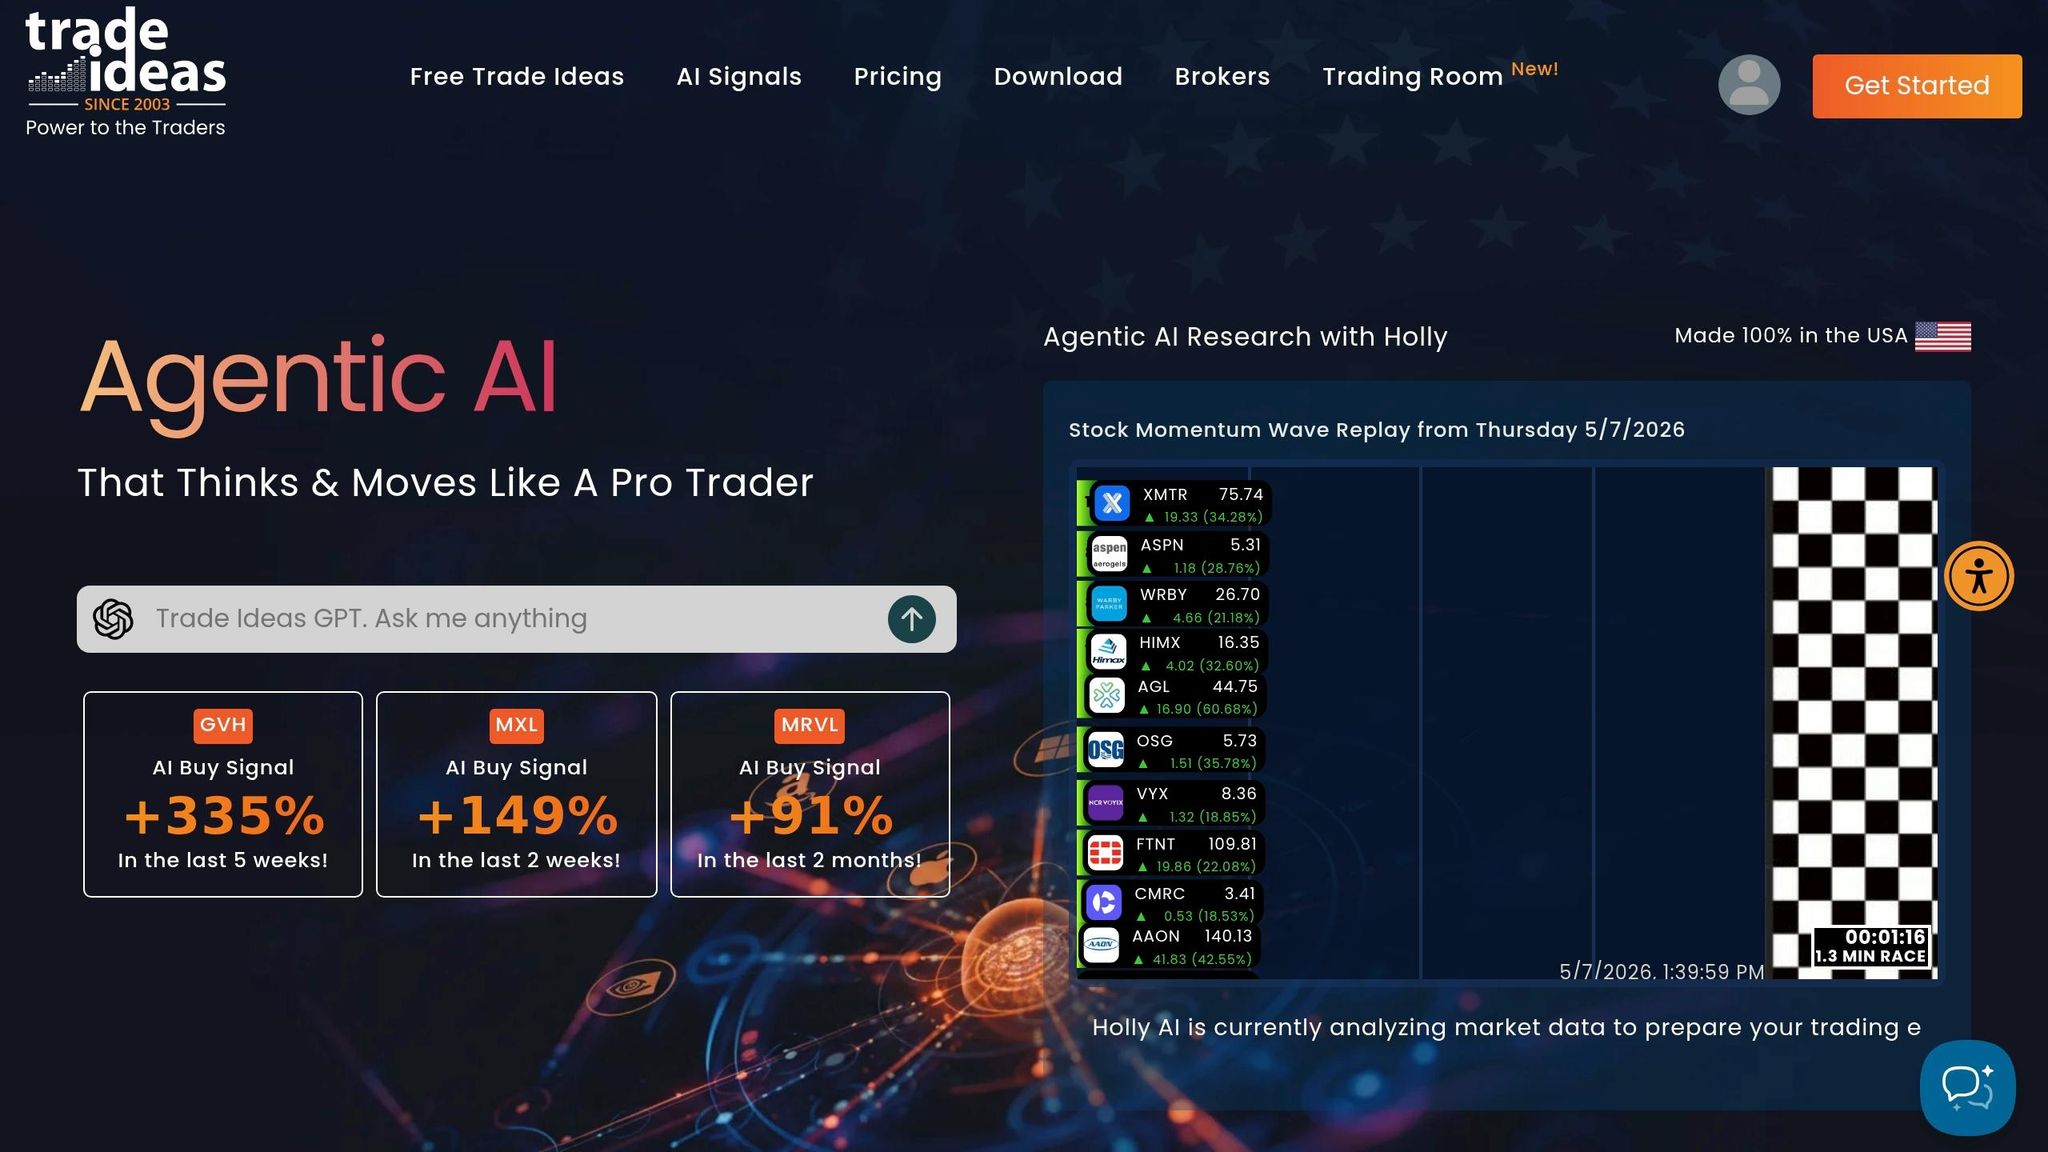
Trade Ideas Pro is a platform that takes swing trading to the next level by combining advanced technical filters with AI-driven insights. It’s specifically designed for swing traders, offering a mix of AI-powered analysis and practical technical and fundamental filters to speed up decision-making. At the heart of this platform is the Holly AI system, which scans over 8,000 US stocks overnight and evaluates more than 300 pre-built strategies to deliver focused trade ideas. Premium users gain access to three distinct AI modes: Holly Grail (focused on conservative strategies with high win rates), Holly 2.0 (geared toward momentum-based trades), and Holly Neo (targeting aggressive trades with high potential returns). Steven Hatzakis, Director of Online Broker Research at StockBrokers.com, highlights:
"What makes Trade Ideas unique is how its AI, 'Holly,' chooses a path forward each day based on updated backtesting results."
AI Features
The platform’s AI tools are designed to provide actionable insights in real time:
- TI Wave dynamically adjusts EMA bands and provides clear "B" (buy) and "S" (sell) signals, helping traders navigate volatile markets.
- Smart Risk Levels automatically map support and resistance levels on charts, simplifying trade management.
- The OddsMaker backtesting engine allows traders to test strategies and alerts without needing to code, helping identify what works and what doesn’t.
- Brokerage Plus connects AI signals directly to brokers like Interactive Brokers, E*TRADE, and TradeStation, enabling automated trading.
These AI-driven features integrate seamlessly with the platform’s technical filters, offering a well-rounded toolkit for traders.
Technical Filters
Trade Ideas Pro includes over 500 technical filters and alert types. Traders can create custom scans like "Sweetness" for breakout stocks or "Poised" for reversals using highly specific filters. Visual tools such as Stock Races and Dynamic Top 10 lists provide real-time insights into which stocks are gaining momentum, making it easier to time entries during active trading sessions. Additional features include Fibonacci retracements, RSI divergence, low float breakouts, and alerts for unusual volume activity. These tools are complemented by fundamental data for a more complete trading analysis.
Fundamental Filters
Along with its technical capabilities, the platform offers basic fundamental filters. These include earnings dates and tools for analyzing industry competitors, helping traders align technical setups with key market catalysts.
Stay online and closer to execution. Choose a VPS location for CME futures, New York markets, London FX, API trading, and more.
Host your platform near the market route that matters.
From $59.99/mo
Pricing
Trade Ideas Pro offers two pricing tiers:
- TI Basic: $127/month or $89/month when billed annually. This tier includes real-time data and access to the 500+ technical filters.
- TI Premium: $254/month or $178/month annually ($2,136/year). This tier unlocks Holly AI, Money Machine, OddsMaker, Smart Risk Levels, and automated trading capabilities.
For swing traders, the Premium tier is essential since features like Holly AI and OddsMaker are not included in the Basic plan. Additional options, such as Weekly Swing Picks, provide five curated trade ideas delivered weekly via email. The platform also includes a paper trading simulators, which is highly recommended for testing Holly AI signals before committing real funds. These pricing plans cater to traders at different levels, offering tools to improve precision and streamline the trading process.
5. ChartingLens
ChartingLens combines screening, charting, and AI analysis, making it a go-to platform for swing traders. Every day, the platform scans over 2,000 stocks using technical and fundamental criteria, then ranks them with its proprietary CL Score. This score, ranging from 0 to 100, evaluates technical momentum, volume patterns, and AI signal strength. By integrating multiple tools into one platform, ChartingLens simplifies the process of identifying high-potential swing trades. Its dual-timeframe mode is particularly useful, allowing traders to apply technical criteria across two timeframes simultaneously. For instance, you can require a bullish MACD signal on both daily and weekly charts to ensure trend alignment. This seamless integration of features sets the stage for a closer look at its technical, fundamental, and AI-driven tools.
Technical Filters
ChartingLens offers a variety of essential technical filters like MACD crossovers, Stochastic zones, ADX for measuring trend strength, and RSI levels. Swing traders can refine their searches by focusing on stocks within a specific range of their 52-week highs (e.g., –5% to –20%) or by proximity to key moving averages like the 50-day or 200-day. For more targeted strategies, you can customize filters, such as looking for stocks with RSI values between 40 and 60. Results are integrated directly with interactive charts, making it easy to transition from screening to planning trades.
Fundamental Filters
The platform also includes 12 fundamental filters to help narrow down stock choices. These cover metrics like sector, market cap, P/E ratio, EPS growth, dividend yield, beta, debt-to-equity ratio, and profit margin. Additionally, ChartingLens tracks the activity of over 30 institutional investors - such as Warren Buffett and Michael Burry - by analyzing SEC 13F filings. This feature offers insights into where major market players are focusing their investments. By combining technical and fundamental data, traders can align short-term opportunities with broader market trends.
On top of these tools, ChartingLens uses AI to further enhance its trade signals.
AI Features
The platform generates 25 new AI-driven buy signals daily, each complete with entry and exit targets and confidence scores. Its AI Chat Assistant provides real-time chart analysis and automatically draws support and resistance levels. Sarah K., a day trader, shares her experience:
"I've used a lot of platforms over the years and features like the AI Chat auto-drawing support and resistance and the plain-English backtester are things I've never seen anywhere else."
Another standout feature is the AI Strategy Backtester, which allows users to describe a trading strategy in plain English. The AI then builds and tests the strategy using historical data, delivering performance metrics like win rate and Sharpe ratio - all without requiring coding knowledge. Premium users can also access the "Find Best Timeframe" feature, which compares strategy performance across intervals like 15-minute, 1-hour, 4-hour, and daily charts.
Pricing
ChartingLens offers a Free tier ($0/month) that includes unlimited live charts, over 15 indicators, drawing tools, watchlists, price alerts, and limited access to AI Chat, AI Buy Signals, and the Stock Screener. For $9.99/month, the Premium tier unlocks additional features like unlimited AI Chat with live web search, unlimited backtests, auto chart pattern detection, multi-chart layouts, Bar Replay, trendline alerts, email notifications, and unlimited screener results. As of May 8, 2026, two new tiers - Plus ($19.99/month) and Pro ($29.99/month) - were introduced, with existing $9.99 subscribers automatically upgraded to the Pro tier at no additional cost.
Pros and Cons
Every stock screener has its own set of advantages and drawbacks. StocksToTrade shines with its Oracle algorithm and high level of customization. However, it has a steep learning curve and comes with a higher price tag, though you can try it out for $7. Finviz is praised for its data visualization tools and heatmaps. Investopedia even named it "the best screener for swing traders" due to its extensive screening options, real-time and pre-market data, backtesting, and alerts. That said, the free version includes delayed data and is cluttered with ads.
Barchart appeals to swing traders who use options strategies, thanks to features like implied volatility tracking and unusual options activity. On the flip side, equity-focused traders may not find its options-heavy features as useful. Trade Ideas Pro offers AI-driven insights through its Holly engine and includes powerful backtesting tools, but it comes at a steep monthly cost of $127–$254. Lastly, ChartingLens provides affordable AI chart analysis and a unique CL Score ranking system for just $9.99 per month. However, as a newer platform, it lacks the track record of more established tools.
Here’s a quick breakdown:
| Screener | Primary Strength | Primary Weakness | Price Range |
|---|---|---|---|
| StocksToTrade | Oracle algorithm & customizability | Steep learning curve | Premium (Trial $7) |
| Finviz | Heatmaps & trend identification | Ads and delayed data in free version | $0 - $39.50/mo |
| Barchart | Options activity integration | Limited value for equity-only traders | $0 - $15+/mo |
| Trade Ideas Pro | AI insights via Holly engine | High cost | $127 - $254/mo |
| ChartingLens | AI charting & CL Score system | Still building reputation | $0 - $9.99/mo |
Choosing the right tool depends on your trading style. For example, professional-grade screeners like Finviz and Trade Ideas Pro are better suited for desktop-based analysis, as most lack dedicated mobile apps. If you’re a casual trader, free tools may meet your needs. On the other hand, active traders can benefit greatly from real-time data and advanced features like AI-driven signals. Matching your budget and trading habits to the right screener is key to optimizing your swing trading strategy.
Conclusion
Choosing the right stock screener boils down to your specific trading style and needs. For beginners and intermediate swing traders, Finviz is a standout choice. Its easy-to-use data visualization, heatmaps, and robust free tier make it appealing - though upgrading to the $39.50/month Elite version is necessary for real-time data.
If you're working with a tighter budget, ChartingLens offers excellent value at just $9.99/month. It combines AI-powered analysis with its CL Score ranking system, which is tailored for swing traders. As Will Kopec, Founder of ChartingLens, explains, the platform is "purpose-built for the swing trading workflow at a price point that makes sense for the trade frequency".
For advanced traders who prioritize real-time AI signals, platforms like Trade Ideas Pro are a better fit. However, swing traders, who tend to place fewer trades, may find the premium price less practical. Another high-end option, StocksToTrade, provides professional-grade tools and offers a $7 trial to test its features.
Ultimately, the best stock screener is the one that aligns with your trading habits. Swing traders holding positions for days or weeks will find affordable tools like Finviz and ChartingLens sufficient for their needs. On the other hand, high-frequency traders might benefit from investing in premium platforms. Whether you prefer intuitive visualizations, AI-driven alerts, or deep technical filters, pick a screener that complements your trading strategy and frequency.
FAQs
What filters matter most for swing trading?
Swing trading relies on spotting technical setups and momentum indicators on daily and weekly charts. Key factors to watch include moving averages, RSI levels (like below 30 or above 70), spikes in volume, and how prices behave near support or resistance levels. These filters allow traders to zero in on stocks that show potential for notable movement over a span of days to weeks.
Do I need real-time data for swing trades?
Real-time data plays a key role in swing trading. It enables you to identify and respond to short-term price movements and chart patterns as they happen. This immediacy helps you take advantage of opportunities before they slip away. Without access to up-to-the-minute information, delays could negatively affect your trading decisions.
How can I validate a screener setup before risking money?
To make sure your screener setup works as intended, start by backtesting your criteria with historical data. This lets you see how your filters would have performed in the past - without risking any money. Many platforms also offer simulation or paper trading tools, where you can test your screener in live market conditions without using real funds. By pairing backtesting with paper trading, you can confirm your setup is both effective and dependable before committing any capital.


