24/7 Network Operations Center for Your Trading VPS

Engineers watch every trading VPS, route and datacenter 24/7, 365 days a year, with AI-assisted detection and triage.

View live status
  • Six layers of visibility
  • Avg. first reply under 10 min
  • 99.999% SLA on every plan
Network Operations Center: On watch. 24/7.An illustration of our monitoring workflow.
99.999%

Monthly server & network SLA

The same care. Every plan.

  • Around-the-clock monitoring
  • AI-assisted detection
  • Engineer-led response
Explore our uptime commitment

Always watching, ready to act: six layers of monitoring on every trading VPS.

Your trading workspace depends on more than a running server. We monitor the hardware, network paths, and facility signals behind it, with one operations team connecting the dots.

Six layers of visibility.

Every QuantVPS Edge location feeds the same monitoring workflow, so infrastructure issues reach the people who can act on them.

Server health telemetry
CPU, memory, disk I/O, and hypervisor health across the fleet.
Network path monitoring
Latency and packet loss along carrier and exchange routes.
DDoS detection & mitigation
Traffic filtering and attack detection at the network edge.
Hardware health
Disk, memory, and thermal signals that flag degraded components.
Fleet anomaly detection
Changes from normal behavior, surfaced for engineer review.
Escalation & alerting
Severity-based alerts that reach the right on-call team.

We watch the infrastructure. Your strategies, trading platform, and broker connections remain yours to manage.

How we protect your server

AI-assisted monitoring.
Human-led response.

AI supplements our engineers and support team. It helps surface issues and focus triage, so people can respond faster and keep you informed.

  1. Infrastructure signals
    • Server health
    • Network paths
    • Hardware
  2. 24/7 AI-assisted detection

    Surface signals and focus triage

  3. NOC engineers

    Investigate and coordinate, 24/7

  4. Rapid response

    Act, verify and follow through

An illustration of our monitoring and response process.

Rapid response, people behind every decision: detect, investigate, recover, communicate.

Detection is the start. A clear operating sequence takes an alert through investigation, recovery, and communication.
QuantVPS engineer working on connections at an open server rack

The team behind the telemetry

Real people.
Ready to respond.

Around-the-clock operations, on-site engineering, and an escalation path when your infrastructure needs attention.

  1. Detect

    Automated monitoring

    Server, network, and hardware signals surface abnormal behavior. AI-assisted detection helps the team identify what needs attention.

  2. Triage

    Human-led decisions

    A NOC engineer reviews the alert, determines the scope, and follows the appropriate escalation path.

  3. Resolve

    Restore service

    Engineers coordinate routing changes, hardware work, or recovery. Redundant paths and automatic failover are used where available.

  4. Report

    Keep you informed

    Follow public service updates and incident history on our status page. Eligible service credits are available under the SLA.

15-minute first-reply target for critical issues.

Measured from a complete support request. Response time is not a resolution guarantee. See the SLA for scope and service-credit eligibility.

Service updates, in the open.

Current availability, published incidents, and regional subscriptions.

Open the status page

We run the infrastructure. You run the strategy.

The NOC watches the systems that host your workspace. Your trading decisions and external connections remain yours to manage.

What the NOC covers

Server and hypervisor health, hardware, facility systems, carrier paths, DDoS signals and fleet anomalies. Engineers investigate alerts, coordinate recovery and publish service updates.

What stays with you and your broker

Your strategies, platform configuration, broker login, exchange access and order decisions. Monitor those connections and use broker-side risk protections. Review the SLA coverage and exclusions.

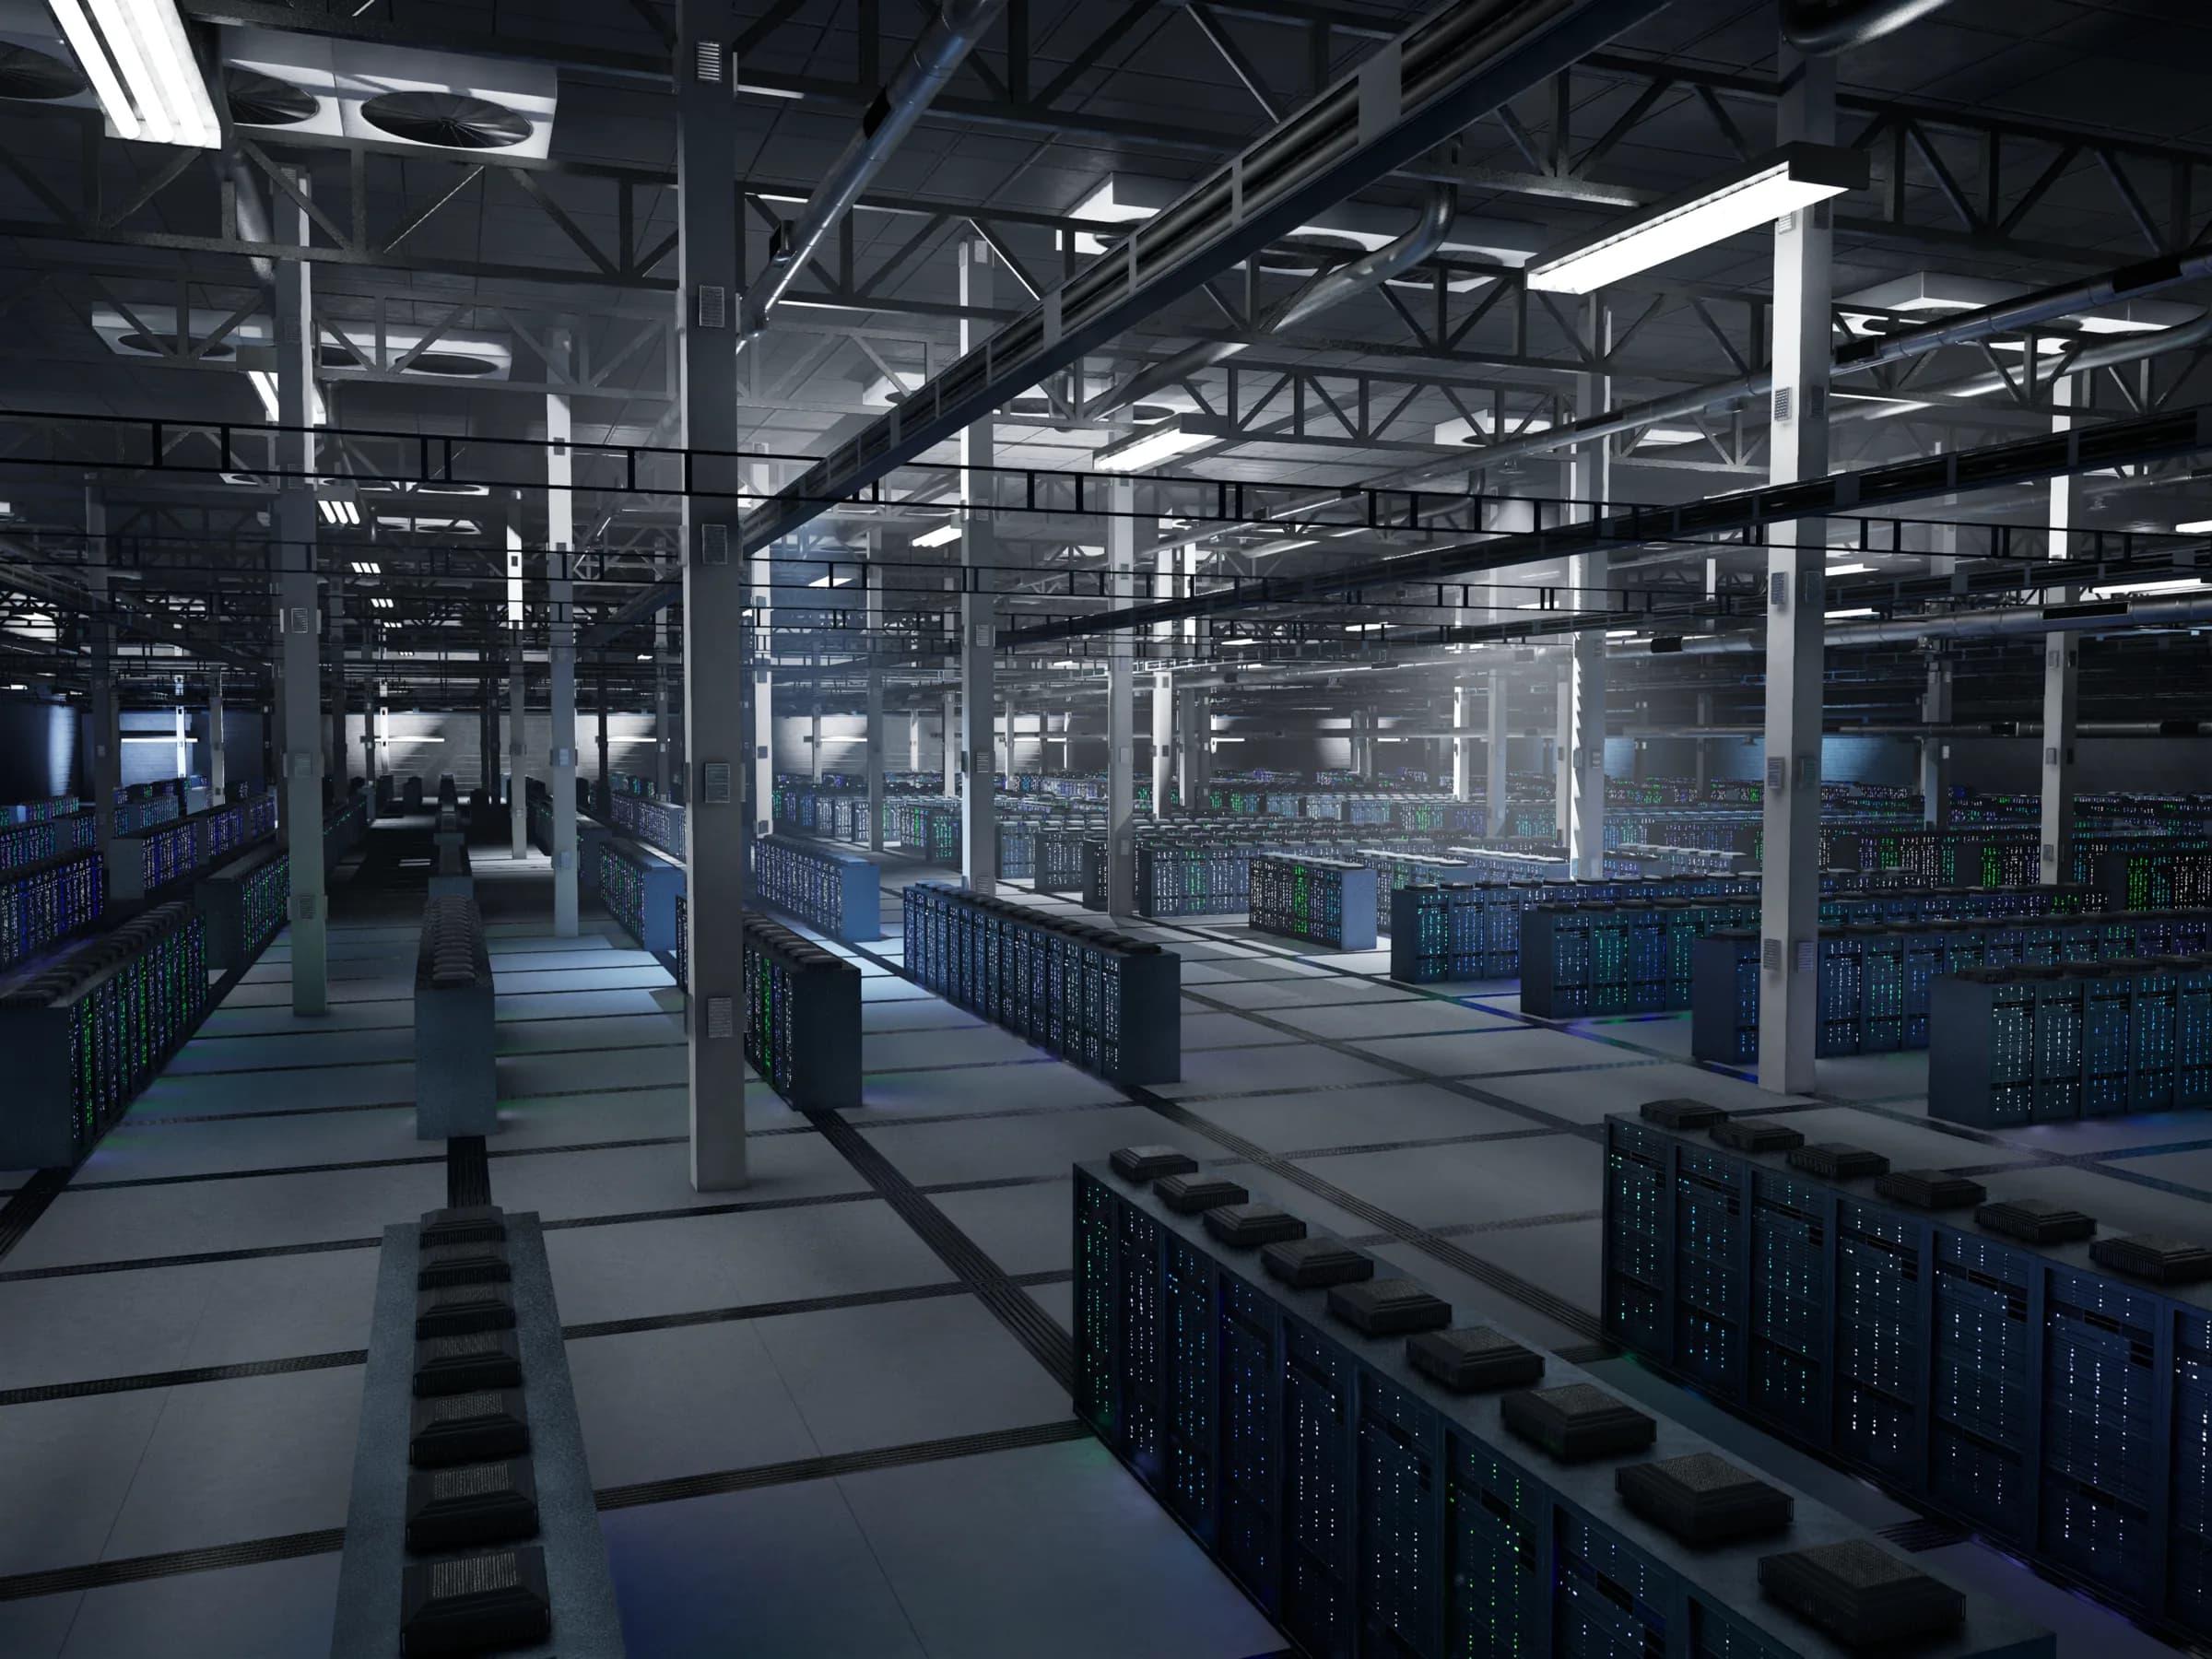
Datacenter floor with rows of server racks housing the QuantVPS fleet

Resilience, built in

The floors and racks behind your trading.

Redundant power, cooling, and network paths. Watched around the clock.

Explore our datacenter infrastructure

Fault tolerance below the software.

  • SOC 2 Type II certified facilities
  • 2N power redundancy with on-site generators
  • Fault-tolerant (2N) power and cooling with multi-carrier network
  • 24/7 on-site security and biometric access
See facility access controls

Trading VPS monitoring FAQ.

Sound familiar?5 common ones

Ever missed a setup because you were away from your desk?

Your platform keeps running. Log back in from any device.

If any of these sound familiar, a trading VPS is the fix.

Server health (CPU, memory, disk, hypervisor), network paths to carriers and exchanges with latency and packet-loss probes, DDoS signals, hardware health, and fleet-wide anomalies, across all eight datacenters, around the clock. See how DDoS filtering protects your server.

No. AI-assisted monitoring runs around the clock to help flag potential issues and speed up triage. It supplements our NOC engineers and support team, who investigate alerts, make operational decisions, coordinate recovery, and keep customers informed.

Average first response under 10 minutes. The SLA sets a 15-minute first-reply target for critical issues, measured from a complete support request. Engineers investigate and coordinate recovery; this is not a guaranteed resolution time.

Current service health and published incident history are available on our status page, with subscriptions for updates. If a covered availability commitment is missed, you can request a service credit under the SLA.

The NOC covers the server, network, and facility. Your platform and broker connection remain yours to watch, and resource and uptime data are visible in your dashboard without a support ticket.

Check current service health and incident history at status.quantvps.com. Subscribe there for notifications, and use your dashboard for your server’s uptime data.
See all FAQ

Answers on servers, latency, access, security and support.