
RSI divergence is a powerful tool in technical analysis that helps traders spot potential trend reversals or continuations. It occurs when price movements and the RSI (Relative Strength Index) indicator move in opposite directions, signaling shifts in market momentum. Here's what you need to know:
- Bearish Divergence: Price hits higher highs, but RSI shows lower highs. This often signals weakening upward momentum and a possible downward reversal.
- Bullish Divergence: Price makes lower lows, but RSI forms higher lows. This suggests fading downward pressure and a potential upward reversal.
- Hidden Divergence: Indicates trend continuation rather than reversal. Bullish hidden divergence shows higher price lows with lower RSI lows, while bearish hidden divergence shows lower price highs with higher RSI highs.
To effectively use RSI divergence:
- Compare price peaks and troughs with RSI movements.
- Confirm signals with tools like volume, candlestick patterns, or trendline breaks.
- Apply disciplined risk management, such as stop-loss placement and position sizing.
- Combine RSI divergence with other indicators like moving averages or Fibonacci retracements for stronger setups.
While RSI divergence can signal early market shifts, it has limitations. False signals can occur in choppy markets, and divergence in strong trends may lead to minor corrections rather than full reversals. Patience, confirmation, and a strategic approach are key to leveraging RSI divergence effectively in trading.
3 Indicators You Can Use to Identify Divergence Signals
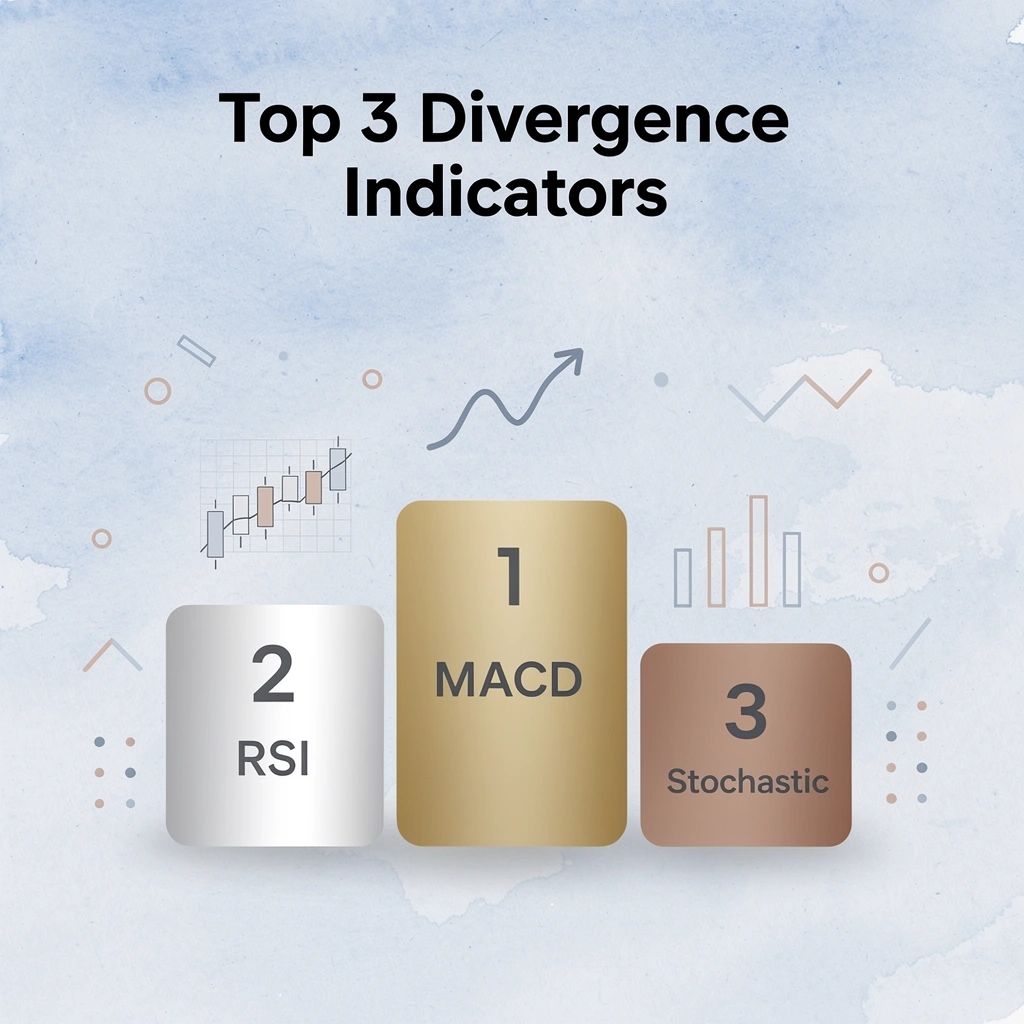
Three indicators dominate divergence-based trading strategies: RSI, MACD, and Stochastic. According to TradingSim's analysis of divergence trading setups, these tools read the same underlying tension between price and momentum through different lenses.
"RSI, MACD, and Stochastic — the three dominant indicators — each read the same underlying tension between price and momentum through different lenses." — TradingSim, Divergence Trading Analysis
🎯 Key Point: Not all divergence indicators are created equal — RSI, MACD, and Stochastic each offer a unique perspective on the same price-momentum conflict, giving traders multiple confirmation angles.
| Indicator | What It Measures | Best Used For |
|---|---|---|
| RSI | Relative price strength over time | Overbought/oversold divergence signals |
| MACD | Moving average convergence/divergence | Trend momentum shifts and reversals |
| Stochastic | Price position within a range | Short-term momentum divergence |
🔑 Takeaway: Mastering all three indicators gives traders a significant edge — each tool captures divergence signals from a different angle, making your analysis far more reliable than relying on a single indicator alone.
MACD The Two-Line Conversation
The MACD tracks the relationship between a faster and a slower moving average. When price climbs to a new high, but the MACD lines form a lower peak, momentum is fading: a bearish divergence. Conversely, price printing lower lows while MACD trends upward signals that selling pressure is exhausting, giving a bullish divergence read before the reversal becomes obvious.
What do the three MACD components reveal about momentum?
TradingView's divergence trading scripts documentation explains that the MACD consists of three components: the 12-period EMA, the 26-period EMA, and a 9-period signal line. The distance between the two main lines matters as much as their direction: wider gaps indicate stronger momentum, while narrowing gaps often precede a crossover.
What do overbought and oversold RSI readings actually signal?
The RSI moves between zero and 100. Readings above 70 indicate overbought territory, and readings below 30 indicate oversold conditions. When price makes lower lows, but RSI forms higher lows, you have a bullish RSI divergence—a sign that selling momentum is weakening. This structural disagreement between price action and the oscillator often signals an early reversal.
Why does manual divergence detection create gaps across timeframes?
Most traders identify divergence by manually inspecting charts and comparing RSI readings with price swing points. When signal frequency increases across multiple timeframes, manual approaches create gaps. Our trading VPS keeps your algorithms running continuously, so your system responds immediately when RSI forms a higher low against a falling price, rather than hours later.
Stochastic Momentum Confirmation in a Tighter Range
The Stochastic Oscillator uses two lines within a 0 to 100 range. Readings above 80 signal overbought conditions; readings below 20 signal oversold. When price rises to a new high but the stochastic peaks trend lower, that bearish divergence carries weight, particularly when both stochastic lines agree on direction—a confirmation layer RSI alone does not provide.
Why do divergence signals look different in live conditions?
Divergence signals look clean in hindsight, but they're messy in real time. A price chart showing three clean lower lows against three clean RSI higher lows is easy to trade after it happens. In real-world conditions, those swing points are unclear, and filtering discipline helps separate good signals from noise. According to the Just2Trade Blog's 2025 analysis of divergence trading, between 30% and 40% of apparent divergence signals fail without proper filtering—meaning the indicator you choose is only half the equation.
Which indicator fits your trading style?
Run 24/7 while you sleep. Keep bots, platforms, and trade copiers online on a dedicated VPS.
Low-latency VPS hosting for your trading platform.
From $59.99/mo
No single indicator wins across all conditions. MACD measures momentum shift over longer swings, RSI gives faster reads on short-term exhaustion, and Stochastic adds confirmation when two lines agree on direction, which matters more than speed. Your choice depends on how you define a valid swing point, how many confirmations you require before entering, and how much noise your system can tolerate.
Does your timeframe favor slower or faster signals?
If you trade longer time periods where swing points are far apart and momentum shifts slowly, MACD's structure works well. For faster-moving markets where overbought and oversold conditions change quickly, RSI and Stochastic respond with less delay and give earlier signals, though you may encounter slightly more false positives.
What does price-momentum disagreement actually tell you?
Each indicator shows the same basic truth: when price and momentum disagree, the market is telling you something worth paying attention to. The question is whether you're disciplined enough to wait for that disagreement to resolve before acting.
RSI - Divergence Strategy (All You Need To Know)
Types of RSI Divergence
This section delves deeper into how regular and hidden RSI divergence can signal either trend reversals or continuations, helping traders make more informed decisions.
RSI divergence comes in two main forms, each with its own implications for market movement. Recognizing these patterns can help traders anticipate whether a trend is weakening or likely to persist.
Regular Divergence
Regular divergence serves as a potential warning for trend reversals. It occurs when the price action and RSI momentum move in opposite directions, signaling that the current trend may be losing steam.
- Bearish regular divergence happens when prices hit higher highs, but the RSI forms lower highs. This suggests that while prices are climbing, the momentum behind the move is weakening. It’s often a sign that buying pressure is fading, which could lead to a downward reversal.
- Bullish regular divergence appears when prices make lower lows, but the RSI creates higher lows. This indicates that even though prices are falling, selling pressure is easing. This pattern often hints at a potential bottom and an upcoming upward reversal.
Regular divergence highlights diminishing momentum, making it a cue for traders to consider exiting or adjusting their positions.
Hidden Divergence
Hidden divergence, on the other hand, points to trend continuation rather than reversal. It typically shows up during pullbacks in a strong trend, signaling that the trend is likely to resume.
- Bullish hidden divergence occurs when prices form higher lows while the RSI makes lower lows. This pattern is common during temporary corrections in an uptrend and suggests that the pullback may be ending, with the upward trend set to continue.
- Bearish hidden divergence takes shape when prices create lower highs while the RSI forms higher highs. Seen during brief rallies in a downtrend, this pattern signals that the bounce is temporary and the downward trend will likely persist.
Hidden divergence often provides opportunities to either add to existing positions or enter new ones in alignment with the dominant trend.
Comparing Divergence Types
Here’s a quick comparison of the two divergence types to refine your trading approach:
| Divergence Type | Price Pattern | RSI Pattern | Signal | Best Used For |
|---|---|---|---|---|
| Regular Bearish | Higher highs | Lower highs | Trend reversal (downward) | Exiting long positions or initiating shorts |
| Regular Bullish | Lower lows | Higher lows | Trend reversal (upward) | Exiting short positions or initiating longs |
| Hidden Bearish | Lower highs | Higher highs | Trend continuation (downward) | Adding to short positions during rallies |
| Hidden Bullish | Higher lows | Lower lows | Trend continuation (upward) | Adding to long positions during dips |
Regular divergence signals a mismatch between price extremes and RSI, often hinting at a trend reversal. Hidden divergence, however, reflects temporary corrections within a strong trend, offering traders a chance to align with the prevailing momentum.
How to Spot RSI Divergence on Charts
To identify RSI divergence, traders compare the price's peaks and troughs with the highs and lows of the RSI (Relative Strength Index). This comparison can reveal potential changes in market momentum.
Step-by-Step Guide for Finding Divergence
- Step 1: Open the price chart and add a 14-period RSI, which oscillates between 0 and 100.
- Step 2: Look for clear swing highs and lows in the price movement.
- Step 3: Use horizontal lines or drawing tools to mark the corresponding peaks and valleys on the RSI chart.
-
Step 4: Compare the price swings with RSI movements:
- Bearish divergence: When the price forms higher highs, but the RSI shows lower highs, it may signal weakening momentum.
- Bullish divergence: When the price forms lower lows, but the RSI shows higher lows, it suggests strengthening support.
To confirm the divergence, draw trendlines on both the price and RSI charts. If the trendlines slope in opposite directions, it strengthens the divergence signal.
Confirmation Signals to Validate Divergence
Once you’ve spotted divergence, it’s important to confirm the signal to avoid acting on false indications. Here are some tools to validate divergence:
- Volume: In bullish divergence, rising volume supports the signal by indicating strong buying interest. Conversely, falling volume during bearish divergence suggests fading momentum.
- Candlestick Patterns: Specific patterns, like bullish hammer formations following a bullish divergence, can act as additional confirmation.
- Trendline Breaks: When a downtrend line is broken after spotting bullish divergence, it reinforces the likelihood of a trend reversal.
Trading Strategies Using RSI Divergence
Incorporating RSI divergence into your trading approach can be highly effective, especially when paired with solid risk management and precise timing. The goal is to create a structured plan that leverages these signals while safeguarding your capital.
Adding RSI Divergence to Your Trading Plan
Timing matters when trading with RSI divergence. Always wait for additional confirmation before making a move. For bullish divergence, consider entering long positions once the price breaks above the recent swing high, setting your stop-loss just below the divergence low. For bearish divergence, short positions can be entered when the price dips below the recent swing low, with stops placed just above the divergence high. Stick to a risk limit of 2% of your total capital per trade and aim for a risk-to-reward ratio of at least 1:2.
Position sizing should align with the strength of the divergence signal. If the divergence is strong and supported by multiple confirmation signals, you can allocate a larger position size. For weaker signals, reduce your exposure to minimize risk.
Exiting trades effectively requires a combination of profit targets and trailing stops. Start by setting your profit target near key support or resistance levels. Then, use trailing stops to capture additional gains if the trend continues in your favor. This strategy ensures you lock in profits while staying positioned for larger moves when divergence signals lead to major trend shifts.
Combining RSI Divergence with Other Tools
RSI divergence becomes even more powerful when combined with additional technical tools and methods.
Moving averages add context to divergence signals. For example, bullish divergence near a key moving average like the 200-period MA can indicate a stronger reversal, as the moving average often acts as dynamic support. Similarly, bearish divergence near resistance provided by a moving average strengthens the case for a downward trend.
Support and resistance levels are invaluable when analyzing divergence. Bullish divergence at a well-established support zone creates high-probability long setups, while bearish divergence at resistance levels often signals reliable short opportunities. These levels act as natural turning points, increasing the chances of successful trades.
Fibonacci retracements pair well with RSI divergence. Bullish divergence forming near the 61.8% or 78.6% Fibonacci retracement levels frequently signals significant bottoms, while bearish divergence at Fibonacci resistance often marks key tops. This combination helps pinpoint precise entry and exit points.
Multiple timeframe analysis is a powerful way to validate divergence signals. For instance, a 4-hour bullish divergence gains more credibility if the daily chart shows oversold conditions and the weekly trend remains intact. By aligning signals across timeframes, you can filter out false setups and improve trade accuracy.
Using QuantVPS for RSI-Based Trading
To implement these strategies effectively, you need a reliable trading infrastructure, and QuantVPS offers the tools to support your RSI-based trading.
Real-time execution is essential, as market conditions can change rapidly. QuantVPS provides ultra-low latency (0-1ms), ensuring your orders are executed quickly at optimal prices once divergence signals are confirmed.
Uninterrupted monitoring is crucial for spotting opportunities across multiple markets. With QuantVPS's 100% uptime guarantee, your trading systems remain active 24/7, scanning for RSI divergence patterns across different timeframes and instruments. The Dedicated Server plan even supports up to six monitors, making it easier to keep an eye on multiple markets simultaneously.
Stay online and closer to execution. Choose a VPS location for CME futures, New York markets, London FX, API trading, and more.
Host your platform near the market route that matters.
From $59.99/mo
Platform compatibility ensures seamless integration with your preferred trading software. Whether you rely on MetaTrader for forex or NinjaTrader for futures, QuantVPS supports all major platforms. Its high-performance CPUs and NVMe storage handle complex calculations and charting with ease, even when running multiple indicators.
DDoS protection and automatic backups safeguard your trading systems and data. These features ensure uninterrupted service during critical market moments, protecting your strategies when divergence signals emerge. With dedicated resources, QuantVPS maintains consistent performance, even during periods of high market volatility.
Global accessibility allows you to trade from anywhere while maintaining optimal connection speeds to major financial hubs. This flexibility is particularly useful for capitalizing on divergence signals that occur during different market sessions, enabling you to trade effectively across various time zones.
Common Mistakes and Best Practices
Understanding the typical missteps traders make with RSI divergence can help you avoid unnecessary losses and develop a more disciplined approach to this technical analysis tool.
Limitations of RSI Divergence
RSI divergence comes with its own set of limitations that traders need to keep in mind. One of the main drawbacks is its lagging nature. Since it requires at least two swing points to form, RSI divergence is based on historical price movements. By the time the divergence becomes apparent, the price move may already be underway, leaving less room for profit.
False signals are another common issue, especially in sideways or choppy markets. During low-volatility periods, RSI might show divergence while prices are merely consolidating, not setting up for a significant reversal.
Context is crucial. Divergence signals in strong trending markets often fail because the dominant momentum remains intact. For instance, a bearish divergence in a bull market might lead to only a minor pullback, while bullish divergence in a bear market might result in a brief bounce rather than a full reversal.
Additionally, the reliability of divergence signals diminishes over time. The longer it takes for the price to confirm a divergence, the weaker the signal becomes. A pattern that looks promising at the start of the week can lose its significance if subsequent price action contradicts it.
Being aware of these limitations is crucial before diving into the common pitfalls traders face.
Common Mistakes to Avoid
Building on these limitations, here are some common mistakes traders often make - and how to avoid them.
- Relying solely on divergence: Treat divergence as an alert, not a standalone signal. Always confirm it with other indicators before committing capital.
- Ignoring market conditions: Acting on bullish divergence during a market downturn or bearish divergence in a strong bull market often leads to poor results. Always consider broader market trends, sector performance, and economic factors before making a move.
- Entering too early: Premature entries before proper confirmation can lead to unnecessary losses.
- Misreading timeframes: A divergence on a lower timeframe, like a 15-minute chart, can be misleading if higher timeframes show a conflicting trend. Always align signals across multiple timeframes.
- Forcing patterns: It’s easy to see divergence where none exists, especially when eager to find trading opportunities. This confirmation bias can lead to poor trades based on weak analysis.
Best Practices for RSI Divergence Trading
To trade RSI divergence effectively, consider these best practices to enhance your strategy and discipline.
- Use multiple confirmation signals: Combine RSI divergence with other technical tools like volume patterns, candlestick formations, or support/resistance levels for stronger setups. For example, a bullish divergence paired with a hammer candlestick at a support zone is far more reliable than divergence alone.
- Position sizing and risk management: Limit your risk to 1-2% of your capital per trade to protect your account from large losses.
- Strategic stop-loss placement: For bullish divergence, place stops slightly below the divergence low to account for market noise. For bearish divergence, set stops just above the divergence high.
- Set realistic profit targets: Instead of aiming for massive moves, focus on nearby resistance levels in bullish setups or support levels in bearish ones. You can always add to a winning position if the trend continues.
- Keep a trading journal: Document your trades with screenshots, entry/exit points, and your reasoning. Reviewing your journal helps you identify patterns in your successes and mistakes, speeding up your learning curve.
- Time your trades wisely: RSI divergence signals are often more reliable during high-volume trading sessions. Be cautious during low-volume periods, such as holidays, when price moves can be erratic.
- Calibrate your RSI settings: While the default RSI period is 14, experimenting with settings like 9 or 21 can yield better results depending on your timeframe and the asset you’re trading. Adjust overbought/oversold levels as needed for specific instruments.
- Exercise patience: Once you’ve entered a trade based on divergence, give the signal time to develop. Avoid exiting prematurely at the first sign of minor adverse movement.
Classic mistakes in searching for RSI divergence
Recognizing the right indicator is one thing. Using it without falling into predictable traps is another challenge entirely — the traps are specific enough that naming them directly saves real money.
⚠️ Warning: The most costly RSI divergence mistakes aren't random — they're predictable, repeatable errors that even experienced traders fall into without a clear framework to avoid them.
"The difference between a profitable divergence signal and a costly false entry often comes down to which traps a trader has learned to recognize by name." — Trading Psychology Principle
💡 Tip: Before acting on any RSI divergence signal, run a mental checklist against the most common mistakes — treating each trap as a named risk dramatically sharpens your decision-making accuracy.
| Classic Mistake | Why It Hurts | The Fix |
|---|---|---|
| Forcing divergence on weak trends | Leads to a false conviction | Require clear swing highs/lows |
| Ignoring timeframe context | Signals conflict across charts | Confirm on a higher timeframe first |
| Acting without confirmation | Premature entries, costly exits | Wait for price action to confirm |

When the market context is wrong
The failure point is usually context, not the signal itself. According to ACY Securities, RSI divergence signals fail around 70% of the time in ranging markets compared to trending conditions. A bearish divergence in a sideways chop zone is noise, not a reversal warning. Before acting on any RSI divergence, confirm that the price is trending. Without a trend, the signal loses most of its statistical weight.
Fundamental events worsen this problem. A textbook RSI divergence can form cleanly, only for a central bank announcement or earnings report to erase the setup in minutes. Check the economic calendar before entering any divergence-based position. If a high-impact event occurs within the next 24 to 48 hours, the signal is compromised regardless of how clean it looks.
The cost of acting too early
Wishful thinking is the most expensive habit in technical analysis. Traders spot two points where the price and the RSI oscillator appear to disagree and enter before the pattern confirms. Real divergence requires clear, separated price extremes and indicator extremes within the same time segment. When you pull the RSI high from one date range and the price high from a different, shorter range, you are not measuring divergence; you are constructing one.
The fix is a stricter rule: wait for a confirming signal before opening any position—such as a candlestick reversal pattern, a break of a trend line, or a rejection at a defined support or resistance level. LuxAlgo's research on divergence mistakes highlights that the RSI default period of 14 generates false divergence signals on shorter timeframes. A divergence between price highs and RSI highs spanning only three candles on a 5-minute chart is pattern recognition misfiring under time pressure, not a signal.
Early entries on unconfirmed divergence signals distort your read of the strategy. You start blaming the indicator when the real issue was execution timing. Traders who run algorithmic setups with strict entry conditions tied to confirmation signals rather than divergence alone isolate this variable and see the difference in their results within weeks.
Fixing divergence mistakes requires slowing down in a market that rewards speed, and that tension is where the next layer of this strategy becomes interesting.
Conclusion
RSI divergence is a valuable tool for spotting potential market reversals and trend continuations. In this section, we’ve broken down how traders can use this technique to uncover opportunities - whether it’s understanding the nuances between regular and hidden divergence or applying practical strategies across different market scenarios.
At its core, RSI divergence acts as an early warning system. When price movement and RSI momentum start heading in opposite directions, it’s often a clue that the current trend could be losing strength. But its true effectiveness lies in pairing these signals with confirmation methods, solid risk management, and a clear understanding of the broader market context. Let’s recap some of the essential points.
Key Points Summary
- RSI divergence offers a structured way to identify high-probability setups. By following the outlined process - like drawing trendlines on both price and RSI, then waiting for confirmation signals - you can bring more consistency to your trading decisions.
- Success with RSI divergence requires patience, discipline, and realistic expectations. The best traders focus on high-quality setups that align with their overall strategy and market conditions. Avoiding common mistakes, such as acting too early or ignoring market context, can significantly improve results.
- Reliable trading tools and real-time data are critical for executing your RSI divergence strategies effectively. Without consistent access to these resources, it’s harder to seize opportunities as they arise.
- RSI divergence works best as part of a broader trading approach. Combine it with other technical tools, sound money management, and multiple confirmation signals for a well-rounded strategy. Keeping a trade journal to analyze both wins and losses will help you refine your methods over time.
FAQs
What’s the best way to confirm RSI divergence signals and avoid false readings?
To make RSI divergence signals more reliable and reduce the chances of false readings, traders should pair RSI with other tools such as moving averages, volume analysis, or price action patterns. It’s also important to identify clear support and resistance levels and ensure the divergence aligns with the broader market trend.
Patience plays a crucial role here - wait for multiple confirming signals before making any moves. A careful analysis and disciplined approach can lead to better identification of trend reversals or continuations, ultimately enhancing your trading decisions.
What are the best ways to manage risk when trading with RSI divergence?
Managing risk effectively while trading with RSI divergence is key to maintaining long-term success. Begin by establishing specific stop-loss levels to safeguard your capital and minimize potential losses. This step acts as your safety net, ensuring no single trade jeopardizes your account.
Another important aspect is using position sizing strategies. By carefully controlling how much of your account is allocated to each trade, you can avoid overexposing yourself and maintain a balanced approach.
Equally important is having a clearly outlined trading plan. This plan should detail your entry and exit points, helping you navigate trades with precision. Make it a habit to review and refine your plan regularly, adjusting it to align with changing market conditions. Stick to your strategy to avoid emotional decisions, and always prioritize preserving your account over the temptation to chase quick profits.
What’s the difference between hidden divergence and regular divergence in trading, and how do they affect strategies?
Hidden divergence and regular divergence play distinct roles in analyzing market trends and shaping trading strategies. Regular divergence signals a potential trend reversal. It highlights weakening momentum, hinting that the current price direction might shift. This makes it a go-to tool for traders aiming to spot key turning points in the market.
In contrast, hidden divergence points to the continuation of an existing trend. It shows that, despite short-term price pullbacks, the trend remains strong. This makes it particularly effective for traders who favor trend-following strategies, as it helps confirm the market’s prevailing direction. While regular divergence is ideal for identifying reversals, hidden divergence keeps traders in sync with ongoing trends.


