Navigating the stock market requires reliable tools, and the good news is that some of the best charting platforms are completely free. Whether you’re a beginner or an experienced trader, these tools can help you analyze trends, track market movements, and refine your strategies. This guide covers five popular free platforms – TradingView, Yahoo Finance, StockCharts, Koyfin, and ProRealTime – highlighting their features and strengths. Here’s a quick breakdown:
- TradingView: Offers advanced tools, real-time data, and custom indicators powered by Pine Script®. Ideal for traders seeking detailed analysis and customization.
- Yahoo Finance: Simple charts for beginners with basic technical indicators and real-time U.S. market data.
- StockCharts: Provides intermediate-level tools and delayed data, suited for swing and position traders.
- Koyfin: Promising platform with growing popularity but limited information on features.
- ProRealTime: Free but lacks detailed documentation for U.S. traders.
If you’re looking for powerful tools and flexibility, TradingView stands out. For simplicity, Yahoo Finance is a solid choice. Each platform caters to different needs, ensuring there’s an option for every trader.
5 of the Best Free Charting Software & Websites 📈 📉
1. TradingView

TradingView provides a suite of professional-grade analysis tools wrapped in a user-friendly interface, making it a go-to choice for U.S. traders. Whether you’re a beginner or a seasoned investor dealing with stocks, options, or other securities on major U.S. exchanges, TradingView has something to offer. Let’s dive into its standout features and customization options.
Technical Indicators
TradingView boasts a massive library of technical indicators, many powered by its proprietary programming language, Pine Script®. These tools enable users to perform in-depth market analysis with precision.
Some of the standout Pine Script® indicators include:
- Range Oscillator (Zeiierman): Delivers dynamic oscillation analysis with adaptive range detection.
- Volume Surprise [LuxAlgo]: Flags unexpected trading activity that might indicate market shifts.
- Fair Value Gaps by DGT: Highlights institutional trading imbalances across multiple timeframes.
- Adaptive Volume Delta Map: Tracks buy and sell volume imbalances, helping traders spot institutional patterns.
For those focused on institutional trading strategies, these tools are invaluable. They visualize imbalance zones across charts, adapt to various timeframes, and offer insights into market behavior at different data resolutions.
Customization Options
What truly sets TradingView apart is its ability to be tailored to individual trading needs. Pine Script® allows users to create custom indicators, strategies, and even unique chart types, such as the Points and Line Chart, to uncover market insights that standard tools might miss.
Additional built-in libraries, like PriceFormatLibrary and LogNormalLibrary, make complex tasks – such as price formatting and statistical modeling for options and volatility – much more accessible.
For advanced traders, TradingView offers tools like the Simplified Percentile Clustering system, which uses percentile-based clustering for trend analysis, and the Dynamic Equity Allocation Model, which helps with portfolio management directly within the charting interface. These features make TradingView a strong contender among free charting platforms, offering tools that cater to both casual and professional traders alike.
2. Yahoo Finance
NEVER MISS A TRADE
Your algos run 24/7
even while you sleep.
99.999% uptime • Chicago, New York, London & Amsterdam data centers • From $59.99/mo

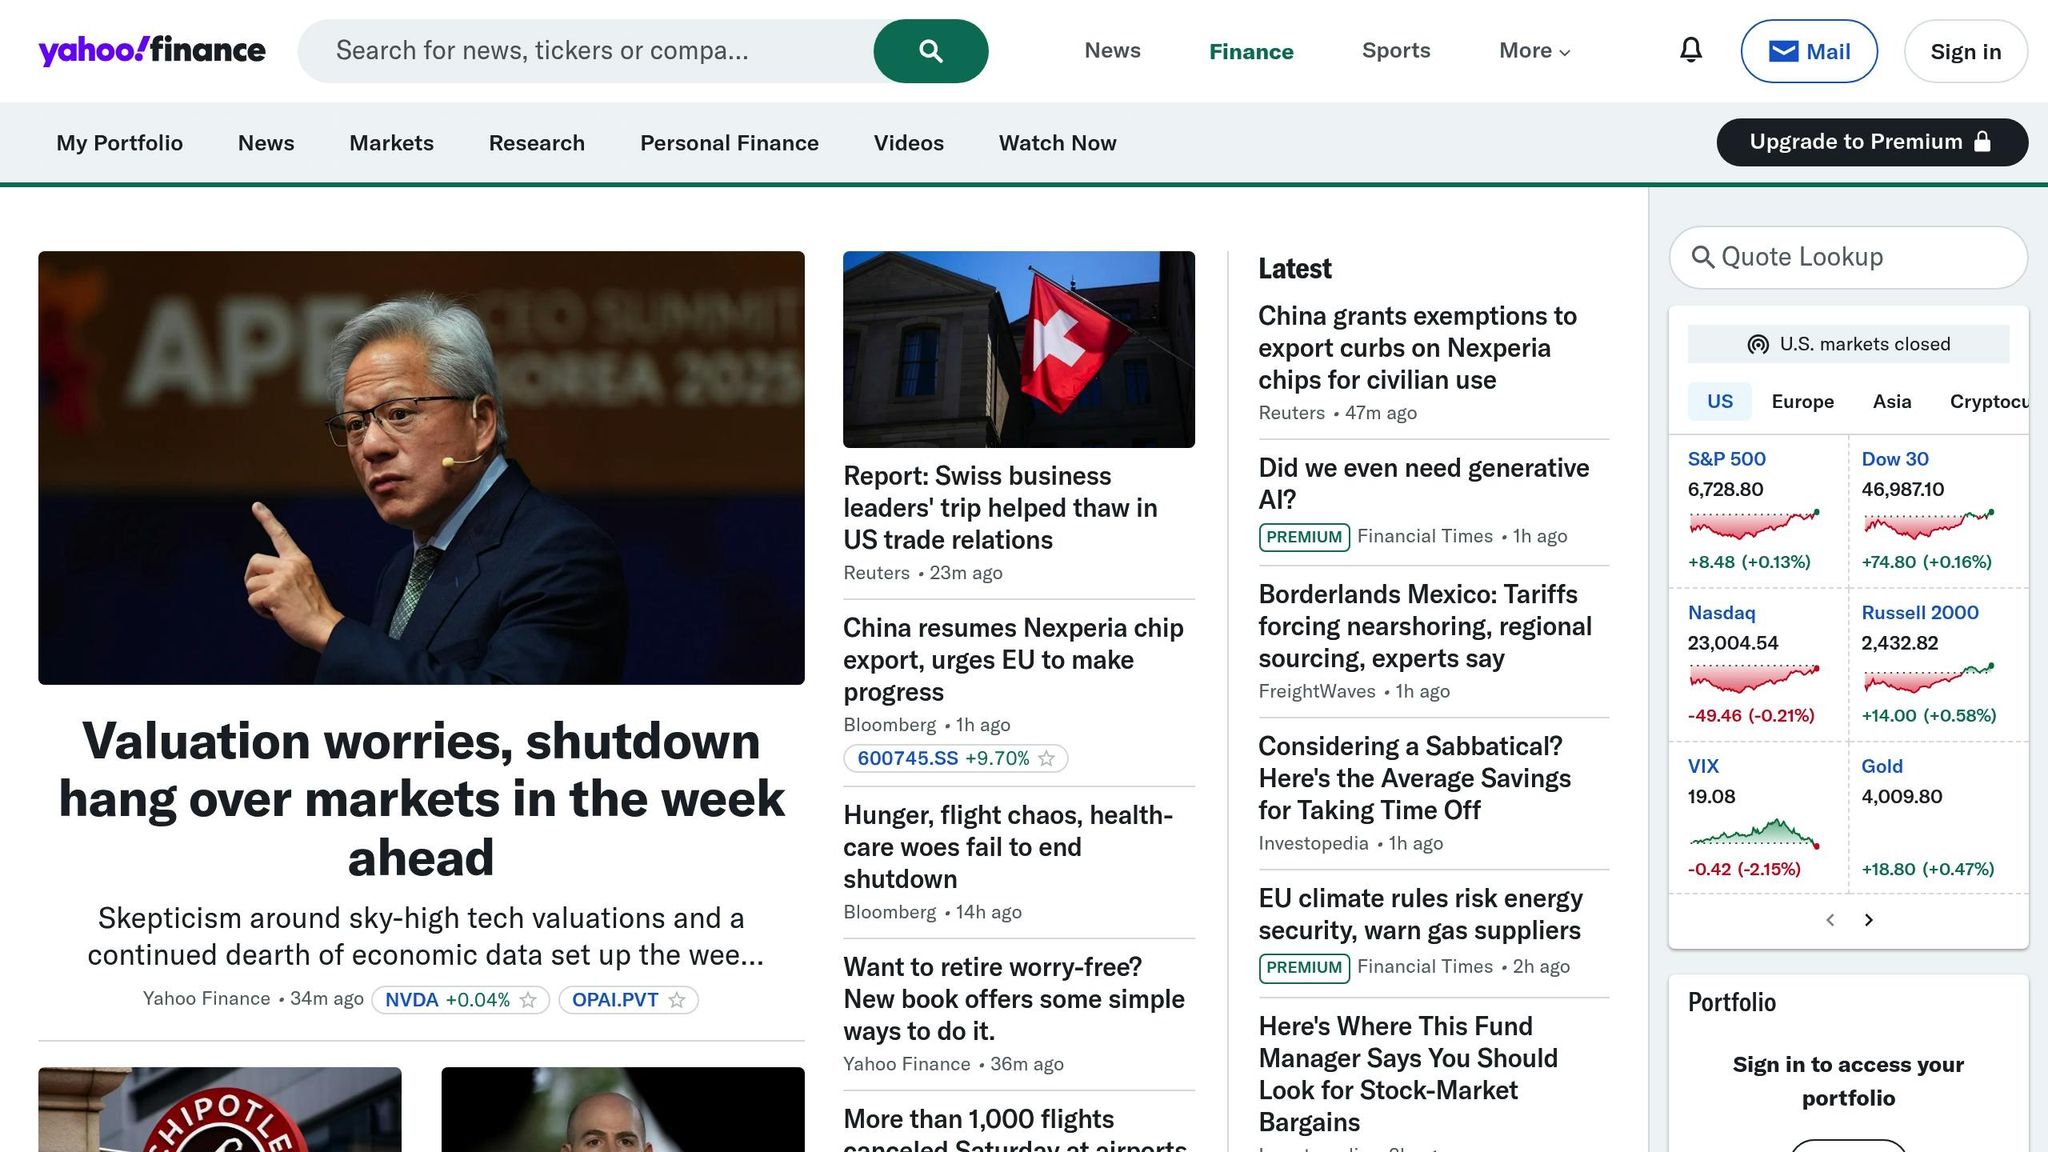
Yahoo Finance is a free platform that delivers market data and basic charting tools. Its user-friendly interface makes it easy to access financial charts and key market details, making it a great choice for beginners dipping their toes into market analysis. While it keeps things simple, it doesn’t offer the advanced technical customization found on some other platforms, which we’ll explore in the next section.
3. StockCharts

StockCharts is a web-based charting platform that provides a variety of tools for technical analysis, and best of all, it’s free to use.
Technical Indicators
The platform comes packed with a range of technical indicators to meet the needs of traders. You’ll find popular tools like moving averages, RSI, MACD, and Bollinger Bands, along with several other features to enhance your analysis. One standout aspect is the platform’s ability to deliver timely data, ensuring traders have the insights they need.
Real-Time Data
For U.S. markets, StockCharts provides data with a 20-minute delay. While this might not work for day traders, it’s perfectly suited for swing and position traders who don’t require second-by-second updates. This balance makes it a solid choice for those focusing on longer-term strategies.
4. Koyfin

Shifting from StockCharts’ extensive tools, let’s take a look at what Koyfin brings to the table.
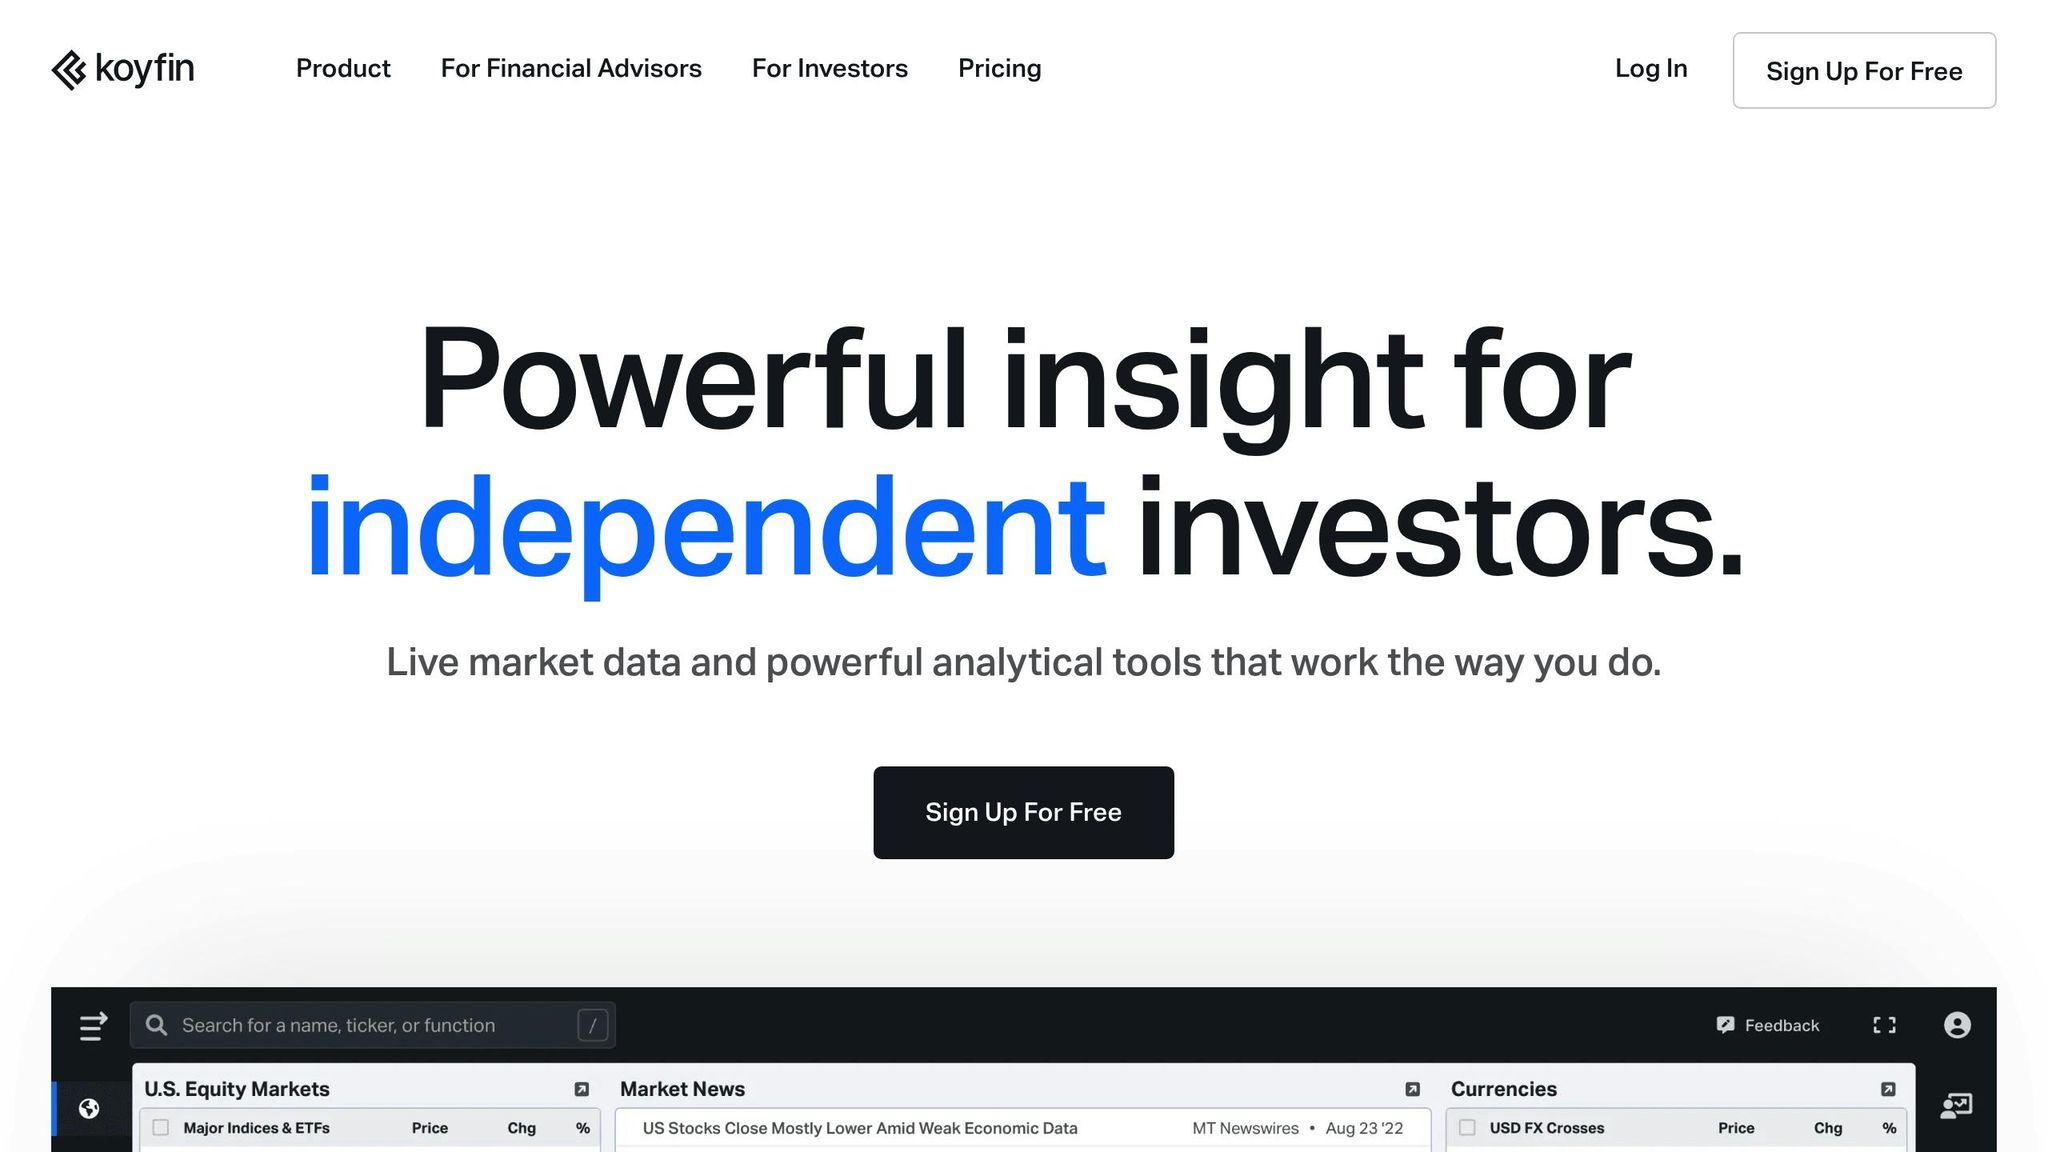
Koyfin is a free charting tool that has caught the attention of many users due to its potential. However, detailed information about its features – such as technical indicators, customization capabilities, market data coverage, and update frequency – remains scarce. At the moment, there isn’t much verified information available, but as more documentation emerges, we can expect a clearer picture of what this platform truly offers.
5. ProRealTime

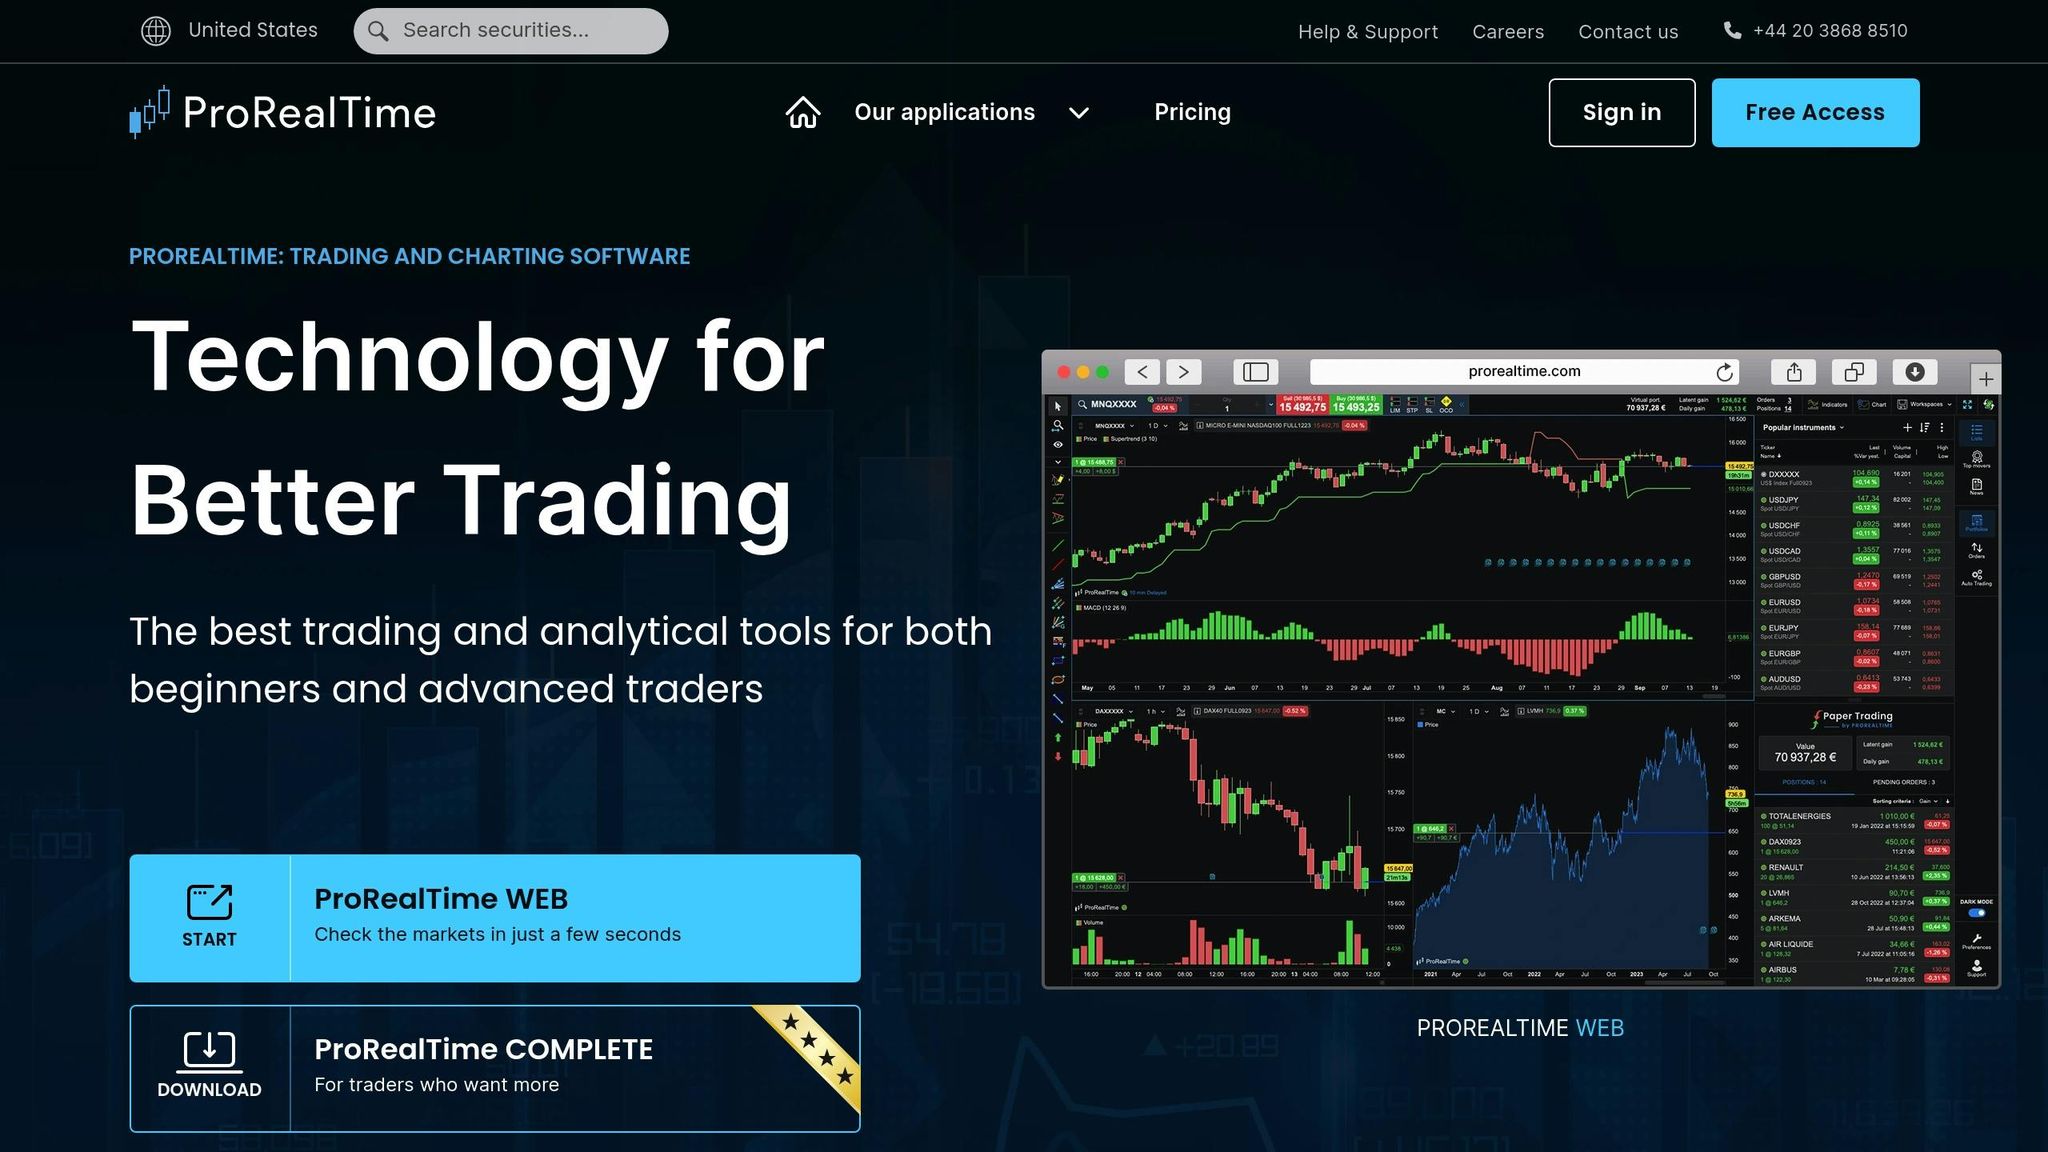
ProRealTime is another free charting platform worth mentioning, though it comes with some uncertainties. Information about its technical analysis tools, chart customization features, and data accuracy – especially for U.S. traders – is quite limited. The lack of detailed public documentation makes it challenging to determine how well it meets the needs of active traders in the market.
Platform Comparison: Advantages and Disadvantages
Building on the platform reviews mentioned earlier, it’s clear that TradingView takes the lead when it comes to free charting tools.
STOP LOSING TO LATENCY
Execute faster than
your competition.
Sub-millisecond execution • Direct exchange connectivity • From $59.99/mo
What sets TradingView apart is its powerful Pine Script® library. This feature allows traders to design and customize their own technical indicators and strategies. On top of that, the platform boasts a wide selection of community-created indicators, showcasing its strong focus on technical analysis. TradingView also delivers real-time data for key U.S. indices, individual U.S. stocks, cryptocurrencies, futures, and forex markets, catering to over 100 million users globally.
In contrast, alternative platforms lack verified information about their technical features. This distinction solidifies TradingView as the go-to option for traders who value in-depth and personalized market analysis.
Conclusion
TradingView is a standout platform, offering a wealth of technical tools and the ability to create custom indicators. Its Pine Script® library, along with a vast array of community-created indicators, makes it an excellent choice for traders looking to tailor their analysis to their specific needs.
On the other hand, Yahoo Finance provides straightforward charting capabilities and real-time U.S. market data, making it a solid option for those seeking simplicity. StockCharts caters to traders who require intermediate-level technical tools for their strategies.
While free charting tools are valuable for analysis, they can sometimes fall short during critical trading moments. Issues like slower load times, occasional downtime, or delayed data feeds during high-volume trading periods can hinder timely decision-making.
This is where having a reliable trading infrastructure becomes essential. QuantVPS delivers ultra-low latency VPS solutions starting at $41.99/month (billed annually), ensuring consistent performance. With lightning-fast 0-1ms latency and a 100% uptime guarantee, QuantVPS enables your trading platform to function seamlessly, so you can act quickly when opportunities arise.
FAQs
What makes TradingView unique among the free stock charting tools featured in the article?
TradingView is known for its easy-to-use and highly customizable charting interface, making it a go-to choice for both novice and seasoned traders. The platform offers an extensive collection of technical indicators, drawing tools, and real-time data, allowing users to perform detailed market analysis with ease.
What truly sets TradingView apart is its vibrant community. Users actively share trading ideas, strategies, and insights, creating an environment that promotes collaboration and continuous learning. With its sleek design and comprehensive toolset, TradingView delivers a seamless experience that stands out among free trading platforms.
Is Yahoo Finance a good option for beginners learning stock market analysis?
Yahoo Finance is a solid option for anyone new to the stock market. With its simple design and clear charts, it’s easy to navigate, even for casual investors. The platform offers free access to stock prices, basic charts, and market news – ideal for those who are just starting to understand the basics.
That said, Yahoo Finance is best suited for foundational analysis. It doesn’t offer the advanced tools or customizations that more experienced traders might need for detailed technical analysis. For beginners focused on grasping the essentials, it strikes a great balance between simplicity and functionality.
What challenges might arise when using free stock charting tools during periods of high trading activity?
Free stock charting tools often struggle to keep up during times of heavy trading activity. This can lead to slower performance as user demand spikes, along with restricted access to features like detailed analytics or real-time updates. In some cases, these platforms might even show delays in presenting data, which can pose challenges for traders making time-sensitive decisions.
If you depend on free tools, it’s crucial to be aware of these drawbacks. During critical trading periods, consider pairing them with dependable market information sources to ensure you’re not caught off guard.


