
Equity curve simulators are tools that help traders understand how their strategies might perform over time. They use statistical models, like Monte Carlo simulations, to project possible outcomes, including account growth, drawdowns, and streaks of wins or losses. This approach helps traders plan for both the ups and downs of trading by analyzing key factors such as win rate, reward-to-risk ratio, risk per trade, and trade frequency.
Key takeaways:
- Simulators show how randomness affects results, even with a strong strategy.
- They help test different risk levels (e.g., 1% vs. 2% risk per trade) and position-sizing strategies.
- Metrics like maximum drawdown, time underwater, and profit factor provide insights into a strategy’s resilience.
- Dynamic position sizing, such as reducing risk during drawdowns, can protect capital and improve long-term performance.
What Is an Equity Curve Simulator?
An equity curve simulator is a tool designed to model how your trading account might perform over time. By inputting key elements of your trading strategy - such as win rate, risk-reward ratio, and risk per trade - it generates thousands of simulated trade sequences. This gives you a range of possible outcomes, from the best-case to the worst-case scenarios. Think of it as a way to test your strategy in a controlled environment before risking real money.
Instead of offering a single outcome, the simulator uses Monte Carlo methods to randomize trade sequences. This creates thousands of unique equity paths, showing how factors like luck and variance might influence your results. The real value lies in shifting your focus from individual trades to the broader, long-term statistical performance of your strategy - a perspective that is essential for serious traders.
Core Components of Equity Curve Simulation
Four main inputs drive the accuracy and usefulness of an equity curve simulation:
- Win rate: This is the percentage of trades that end in profit, serving as a key driver of overall profitability.
- Risk-reward ratio: This measures the relationship between your average win and average loss, which influences how quickly you can recover from drawdowns.
- Risk per trade: Whether expressed as a percentage of your account or a fixed dollar amount, this determines the volatility of your equity and the depth of drawdowns.
- Number of trades: The size of the simulated sample matters. Running simulations with 500 to 1,000 trades provides a more reliable picture than using a smaller sample of 100 trades.
For accurate simulations, it's crucial to use reliable data. Pull figures from your trading journal or validated backtesting results - at least 100 real trades - to avoid skewed or misleading outcomes. Overestimating your win rate or ignoring small losses can lead to unrealistic projections that may fail under live trading conditions. Understanding these inputs helps refine your approach to risk management and position sizing, which are explored further in later sections.
Benefits of Using Equity Curve Simulators
These tools do more than just quantify risks - they also strengthen your mental preparation for trading. By visualizing potential losing streaks or significant drawdowns in a simulated setting, you can mentally prepare for the challenges of real-world trading. As TradeReview puts it:
"The real value of an equity curve simulator isn't in promising profits - it's in preparing you for the statistical gut-punches of trading, like long drawdowns and brutal losing streaks".
Additionally, simulators highlight vital survival metrics, such as the probability of ruin, which measures the likelihood of losing a significant portion of your account. This allows you to test different risk levels and see how small changes - like reducing your risk per trade from 2% to 1% - can smooth out your equity curve while maintaining long-term sustainability.
Key Metrics in Equity Curve Simulations
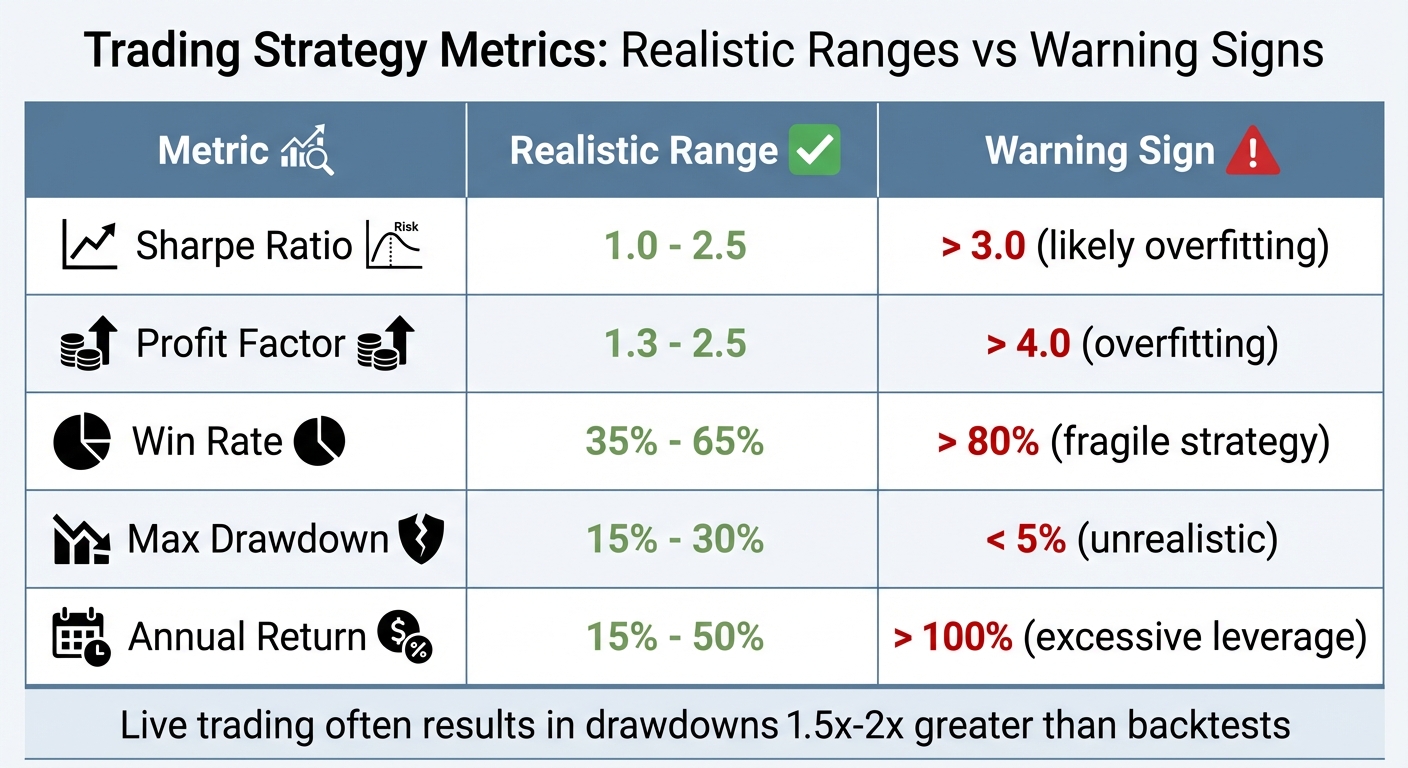
Trading Strategy Metrics: Realistic Ranges vs Warning Signs
Metrics for Risk and Performance Evaluation
After running your simulations, the next step is understanding which metrics matter most. Maximum Drawdown (Max DD) is a critical one - it highlights the largest peak-to-valley loss your account has experienced, essentially showing the "worst case" for your strategy. For perspective, a 50% drawdown requires a 100% gain to recover, while a 75% drawdown needs a staggering 300% gain. This makes Max DD a key indicator of your strategy's survivability.
Run 24/7 while you sleep. Keep bots, platforms, and trade copiers online on a dedicated VPS.
Low-latency VPS hosting for your trading platform.
From $59.99/mo
Time Underwater tracks how long your account stays below its previous peak, testing your patience and resilience as a trader. Then there's the Recovery Factor, calculated by dividing Net Profit by Maximum Drawdown. A Recovery Factor above 5.0 is considered strong.
Your Expectancy, which combines win rate with average trade size, needs to be positive. Likewise, your Average Profit per Trade must comfortably cover execution costs. For instance, if your average profit is $20 but you lose $15 to commissions and slippage, your strategy is on shaky ground. The Profit Factor (gross gains divided by gross losses) should ideally fall between 1.5 and 2.5; anything over 4.0 may indicate overfitting.
Risk-adjusted ratios provide a fair way to compare strategies. The Sharpe Ratio measures return against overall volatility, while the Sortino Ratio focuses only on downside risk, making it especially relevant for traders who embrace upside volatility. The Calmar Ratio compares annualized returns to Max DD; a value above 1.0 suggests your annual return exceeds your worst drawdown. For comparing strategies, rely on CAGR (Compound Annual Growth Rate) rather than average returns. For example, while the Vanguard Total Stock Market ETF had an average annual return of 10.01%, its actual CAGR was only 8.13%.
These metrics collectively help you fine-tune your strategy and assess its resilience under various conditions.
Scenario Comparisons for Better Insights
Monte Carlo simulations add another layer of analysis by generating thousands of potential outcomes, offering a range of probabilities rather than a single projection. These simulations provide three key probability bands: p95 (best 5%), p50 (median), and p5 (worst 5%). The median (p50) reflects the most likely outcome, while the worst-case (p5) scenario shows your survival limit. If the drawdown in this scenario is enough to wipe you out, your position sizing may be too aggressive.
| Metric | Realistic Range | Warning Sign |
|---|---|---|
| Sharpe Ratio | 1.0 - 2.5 | > 3.0 (likely overfitting) |
| Profit Factor | 1.3 - 2.5 | > 4.0 (overfitting) |
| Win Rate | 35% - 65% | > 80% (fragile strategy) |
| Max Drawdown | 15% - 30% | < 5% (unrealistic) |
| Annual Return | 15% - 50% | > 100% (excessive leverage) |
Keep in mind that live trading often results in drawdowns that are 1.5x to 2x greater than what you see in backtests, due to factors like slippage and evolving market dynamics. Use these insights to stress-test your strategy before committing real money.
Using Simulations to Improve Risk Management
Once you’ve nailed down the key metrics, equity curve simulators offer a valuable way to test your strategy before putting real money on the line. By running thousands of simulated trades, you can see how tweaking your risk percentage affects your account's long-term performance. This process helps you spot the maximum potential drawdown before it happens in live trading. It’s a way to fine-tune your risk settings with confidence.
The aim here isn’t to create a perfect strategy - it’s to ensure survival. Simulations highlight that even with a strong win rate, random streaks of losses can still hit hard. Watching your strategy handle a simulated 10-trade losing streak and still stay profitable builds the mental toughness you’ll need when facing rough patches in real trading.
Testing Different Risk Per Trade Levels
Armed with these insights, you can start fine-tuning your risk-per-trade percentages. This involves comparing different levels of risk to find the sweet spot for your strategy. For example, testing 1% risk versus 2% often reveals an interesting result: the 1% level significantly reduces drawdowns without drastically cutting into potential profits. Cutting risk in half doesn’t mean halving your returns - simulations often show a smoother equity curve with only a slight dip in overall profit.
You can run "what-if" scenarios by adjusting your risk percentage, such as lowering it from 2% to 1%, and observe how the equity curve becomes more stable. On the flip side, even small increases in risk can lead to disproportionately larger drawdowns. Running simulations with 500–1,000 trades ensures you get reliable results, but make sure to use verified data from your trading journal. Using inaccurate or hypothetical data can lead to misleading outcomes - garbage in, garbage out.
| Risk Per Trade | Typical Impact | Best For |
|---|---|---|
| 0.5% | Minimal drawdowns, slower growth | Conservative accounts, new traders |
| 1.0% | Balanced growth with manageable drawdowns | Most traders’ "sweet spot" |
| 2.0% | Faster growth but significantly deeper drawdowns | Experienced traders with high risk tolerance |
Adjusting to Market Volatility
Fixed risk parameters are a good starting point, but adapting to market conditions is equally important. Simulations often show that losses tend to cluster during periods of high volatility. For instance, while your average drawdown might hover around 15%, there could still be a 10% chance of it ballooning to 30% due to random trade sequences.
To manage this, consider adjusting your stop-loss distances and risk levels during volatile market conditions. Test your strategy in both trending and range-bound markets to ensure it holds up under different scenarios. Some traders even use equity curve controls, like applying a 20-period moving average to their equity curve. If the equity dips below the average, they pause trading or scale back position sizes until the strategy recovers.
These adjustments not only help cushion against volatility but also lay the groundwork for dynamic position sizing - a topic we’ll dive into next.
Dynamic Position Sizing Through Equity Curve Analysis
Dynamic position sizing takes risk management a step further by adjusting your trade sizes based on how your equity curve is performing. This method helps safeguard your capital during tough times while capitalizing on profitable streaks. The idea is simple: increase trade sizes when you're winning and scale back when you're not.
One effective technique is using a 20-period moving average on your equity curve. If your current equity is above this average, you trade at full size. If it's below, you reduce your positions or even pause trading altogether. This strategy minimizes the impact of losses during inevitable downturns.
Another approach is tiered drawdown scaling. For example, reduce your position size by 10% when your drawdown hits 5%, by 25% at 10%, and by 50% at 15%. You can calculate position sizes dynamically with this formula:
New Position Size = Original Position Size × (Current Equity / Starting Equity)
This gradual adjustment helps prevent severe account erosion during extended losing streaks.
"By protecting your capital during drawdowns, you enhance your ability to recover and thrive in the long term." - Quantfish Research
It's crucial to avoid increasing your trade sizes during a drawdown - this often leads to chasing losses. Instead, only scale up when your equity curve hits a new all-time high.
Monte Carlo Simulations for Position Sizing
Once you've defined your dynamic adjustments, Monte Carlo simulations can test their effectiveness. These simulations shuffle historical trade results into thousands of sequences, creating a variety of equity curve scenarios. This is critical because the order of wins and losses can significantly impact performance, even if the overall win rate remains the same.
For example, running 1,000 simulations of 100 trades with a 55% win rate and a 2:1 reward-to-risk ratio can reveal the likelihood of hitting a 10-trade losing streak. These simulations don’t just show the average outcome - they highlight the range of potential results, including worst-case scenarios. While the average maximum drawdown might be 15%, there's still a 10% chance of experiencing a 30% drawdown due to unfavorable trade sequences.
If simulations show a high probability of extreme drawdowns, you can adjust your risk per trade accordingly. Using fractional Kelly (typically half-Kelly) is a common way to balance growth with risk control. The Kelly Criterion calculates optimal position sizes based on your win rate and reward-to-risk ratio, but halving this value provides a safety buffer and reduces drawdowns.
Before applying any new position sizing rules, stress-test them with simulations across 500 to 1,000 trades. This ensures your strategy remains effective across different market conditions and isn't overly reliant on a specific trade sequence.
Best Practices for Position Sizing Adjustments
Automating these rules is key to ensuring they are executed consistently, especially during emotionally charged situations like drawdowns. Incorporating these rules into your trading system removes the temptation to make impulsive decisions, which often leads to poor outcomes.
To avoid frequent toggling, use buffer zones. For instance, require equity to exceed the moving average by 1% before restoring full position sizes. This prevents constant switching between full and reduced sizes during sideways equity movements. Adding a persistence rule - like only adjusting positions after three consecutive bars above or below the threshold - helps filter out noise and ensures you're reacting to real trends.
Stay online and closer to execution. Choose a VPS location for CME futures, New York markets, London FX, API trading, and more.
Host your platform near the market route that matters.
From $59.99/mo
Another helpful rule is to automatically reduce position sizes by 50% after five consecutive losses. This eliminates the risk of revenge trading or doubling down during losing streaks. Similarly, if market volatility spikes - such as a 50% increase in ATR - reduce your lot size by 30-40% to avoid being stopped out by market noise.
| Adjustment Method | When to Apply | Key Benefit |
|---|---|---|
| Moving Average Control | Equity drops below 20-period MA | Avoids trading during strategy cold streaks |
| Tiered Drawdown Scaling | At 5%, 10%, 15% drawdown levels | Gradual, structured risk reduction |
| Volatility-Based Scaling | When ATR or return volatility rises | Protects against large, unexpected market moves |
| Fractional Kelly | Ongoing, based on win rate/ratios | Balances growth with manageable drawdowns |
How to Simulate and Refine Trading Strategies
This process connects the dots between a theoretical trading strategy and its practical application, emphasizing risk management and execution under real-world conditions. Simulating equity curves helps you see how your strategy holds up under market pressures.
Step 1: Setting Up Simulation Parameters
Start by defining the key parameters for your simulation: win rate (the percentage of trades that are profitable), reward-to-risk ratio (the average profit compared to the average loss), and risk per trade (either a fixed dollar amount or a percentage of your account). These form the backbone of any simulation.
Next, determine the number of iterations - the total trades to simulate. Running between 500 and 1,000 trades provides a statistically reliable picture, while only simulating 100 trades might skew results due to random luck. For more advanced simulations, include factors like initial capital, trade frequency, and position-sizing rules (e.g., maximum allocation caps) to avoid excessive risk.
To ensure your simulation is grounded in reality, use data from at least 100 actual trades. For instance, if your trading journal shows a 52% win rate but you input 70% because it "sounds better", the results will be misleading and could lead to poor decision-making.
| Parameter | Description |
|---|---|
| Win Rate | The percentage of trades that result in a profit |
| Reward-to-Risk Ratio | The average profit per winning trade compared to the average loss |
| Risk Per Trade | The amount of capital risked per trade (in dollars or as a percentage) |
| Iterations | The total number of trades simulated in one run |
| Initial Capital | Starting balance of the trading account |
| Max Allocation Cap | A limit on position size to control exposure |
Step 2: Running and Analyzing Simulations
Once your parameters are set, run the simulations and focus on more than just the final profit. Pay close attention to volatility and drawdowns - these are where the real lessons lie. The "valleys" in your equity curve, showing peak-to-trough losses, reveal the emotional and financial challenges your strategy might bring.
"The real value of an equity curve simulator isn't in promising profits - it's in preparing you for the statistical gut-punches of trading, like long drawdowns and brutal losing streaks." - TradeReview
Metrics like Maximum Consecutive Losses are crucial. For example, even with a 55% win rate, there's a roughly 0.8% chance of a 6-trade losing streak in a short window. Over hundreds of trades, such streaks become almost inevitable. Monte Carlo simulations can show the full range of outcomes, including worst-case scenarios like a 30% drawdown, even if the average is closer to 15%.
Stress-test your strategy in different market conditions - trending versus range-bound markets - to ensure it remains stable when volatility shifts.
Step 3: Refining and Deploying Strategies
Use your simulation results to fine-tune your strategy before going live. For instance, test how increasing your win rate by 5% through stricter trade selection affects performance, or adjust your reward-to-risk ratio for better consistency. In July 2025, Kamil of Markets & Manners ran a Monte Carlo simulation on a strategy with a 40% win rate and a 2:1 reward-to-risk ratio. By using Half-Kelly position sizing, 76% of the simulations turned $1,000 into $1 million over 10 years. However, the same simulations highlighted potential drawdowns of 50–80% along the way.
If Full-Kelly sizing shows a 19% chance of account blowout, consider switching to Half-Kelly or another fractional sizing method. This reduces the risk of ruin while maintaining growth potential. Adjust your position sizes until the simulated drawdowns align with both your financial limits and your emotional tolerance. This approach prevents you from abandoning the strategy during tough periods, just before the winners arrive.
When you're ready to trade live, use a high-performance VPS like QuantVPS to ensure your execution mirrors the simulated results. Data centers such as Equinix LD4 (London), NY4 (New York), and TY3 (Tokyo) offer near-perfect uptime and millisecond-level trade execution speeds. This consistency is crucial - slippage and downtime can erode the edge you've worked so hard to develop. Add external safeguards like daily loss limits, volatility filters, and global drawdown stops to protect against unpredictable events that simulations can't fully account for.
"An equity curve simulator transforms abstract statistics into a felt experience. This mental rehearsal forges the discipline to execute your strategy flawlessly when real money - and real emotions - are on the line." - TradeReview
Conclusion
Equity curve simulators transform trading from guesswork into a precise, data-driven process. By running extensive simulations, traders can uncover their strategy's full statistical range - highlighting both typical patterns and outlier scenarios. This replaces emotional decision-making with a structured, disciplined approach.
These tools also allow you to thoroughly test risk parameters and dynamic position sizing strategies, giving a clear picture of how these choices impact your equity curve over time. To bridge the gap between simulations and live trading, a high-performance VPS like QuantVPS is essential. With 99.99% uptime and millisecond-level execution speeds, it ensures that slippage and downtime don't undermine the equity curve you've meticulously designed.
While equity curve simulators don't guarantee profits, they prepare you for the statistical ups and downs of trading. They help you craft strategies you can stick with, even during challenging periods. Pairing these simulations with reliable execution technology ensures that your live trading results align closely with your tested strategies. This disciplined approach keeps your trading strategy steady and effective across all market conditions.
FAQs
What inputs do I need for an equity curve simulator?
When setting up an equity curve simulator, several critical factors come into play to ensure accurate and realistic modeling. Here's what you need to consider:
- Starting capital: The amount of money in your trading account at the beginning of the simulation.
- Historical data: Used to determine win rates and how frequently trades occur based on past performance.
- Trade parameters: Includes details like how much risk you're taking per trade, your win/loss ratio, and specific profit or loss targets.
- Trade probability: Focuses on the likelihood of winning a trade and the associated risk-reward ratio.
- Trade frequency: Reflects how often trades are executed within a given timeframe.
- Additional costs: Factors in real-world expenses like commissions and slippage to make the simulation more accurate.
These inputs work together to create a realistic picture of how your trading strategy might perform over time.
How do I pick the right risk-per-trade percentage?
Selecting the right percentage of your capital to risk on each trade is a cornerstone of smart risk management. A good starting point? Keep it conservative - around 1-2% of your total capital per trade. This range helps protect your account from significant losses while still allowing room for growth.
Your decision should also align with your trading strategy's historical performance, particularly its drawdowns. Tools like equity curve simulators can be incredibly helpful here. They allow you to test various risk percentages, compare potential growth with possible drawdowns, and identify a balance that matches your personal risk tolerance.
As markets shift and your trading results change, it’s important to revisit and tweak this percentage. Flexibility ensures your approach stays aligned with both market conditions and your evolving performance.
How can I size down during drawdowns without killing returns?
When facing drawdowns, you can scale down your position size by setting equity thresholds or applying fixed percentage rules. This method helps you keep losses in check while still allowing room for potential recovery. By dynamically adjusting your positions based on your current equity, you strike a balance between managing risk and preserving opportunities for future growth.


