
Order Flow Imbalance (OFI) signals are a powerful tool for high-frequency traders to analyze real-time buying and selling pressure in financial markets. By tracking the difference between aggressive market orders and passive limit orders, OFI provides insights into short-term price movements and market dynamics - faster than traditional indicators.
Key Takeaways:
-
What is OFI?
A measure of the net difference between buy and sell orders, showing market pressure. -
Why it matters:
OFI helps traders predict short-term price changes, manage risk, and find arbitrage opportunities. -
How it works:
OFI is calculated as the sum of order volume multiplied by direction (+1 for buy, -1 for sell). Advanced methods include Normalized OFI (NOFI) and Multi-Level OFI (MLOFI). -
Practical use:
Positive OFI signals buying pressure; negative OFI signals selling pressure. Watch for imbalances exceeding 3:1 or absorption patterns for potential reversals. -
Tools:
Platforms like NinjaTrader and QuantVPS offer real-time OFI analysis with features like footprint charts and volumetric bars.
To succeed with OFI, traders need robust infrastructure for real-time data processing and execution. Low-latency hosting, high RAM, and fast network speeds are critical for handling the intense demands of high-frequency trading.
Order Flow Imbalance Strategy Using Orderflows Trader
Order Flow Imbalance: Core Concepts and Calculations
Order Book Events Impact on Order Flow Imbalance (OFI)
What Is Order Flow Imbalance?
Order Flow Imbalance (OFI) measures the difference between buying and selling pressure by analyzing order book events - like limit orders, market orders, and cancellations - over short timeframes. When OFI is positive, it indicates stronger buy-side liquidity, while a negative OFI points to sell-side dominance. In thinner markets, these imbalances can lead to sharper price movements, as short-term price changes often correlate directly with OFI.
"Order flow imbalance (OFI) is a fundamental microstructural variable quantifying the net difference between supply and demand in electronic financial markets." - Emergent Mind
Interestingly, the distribution of OFI often follows a power-law pattern, meaning extreme imbalance events happen more frequently than a standard normal distribution would predict. Below, we break down how OFI is calculated and why it's so valuable in high-frequency trading.
How to Calculate Order Flow Imbalance
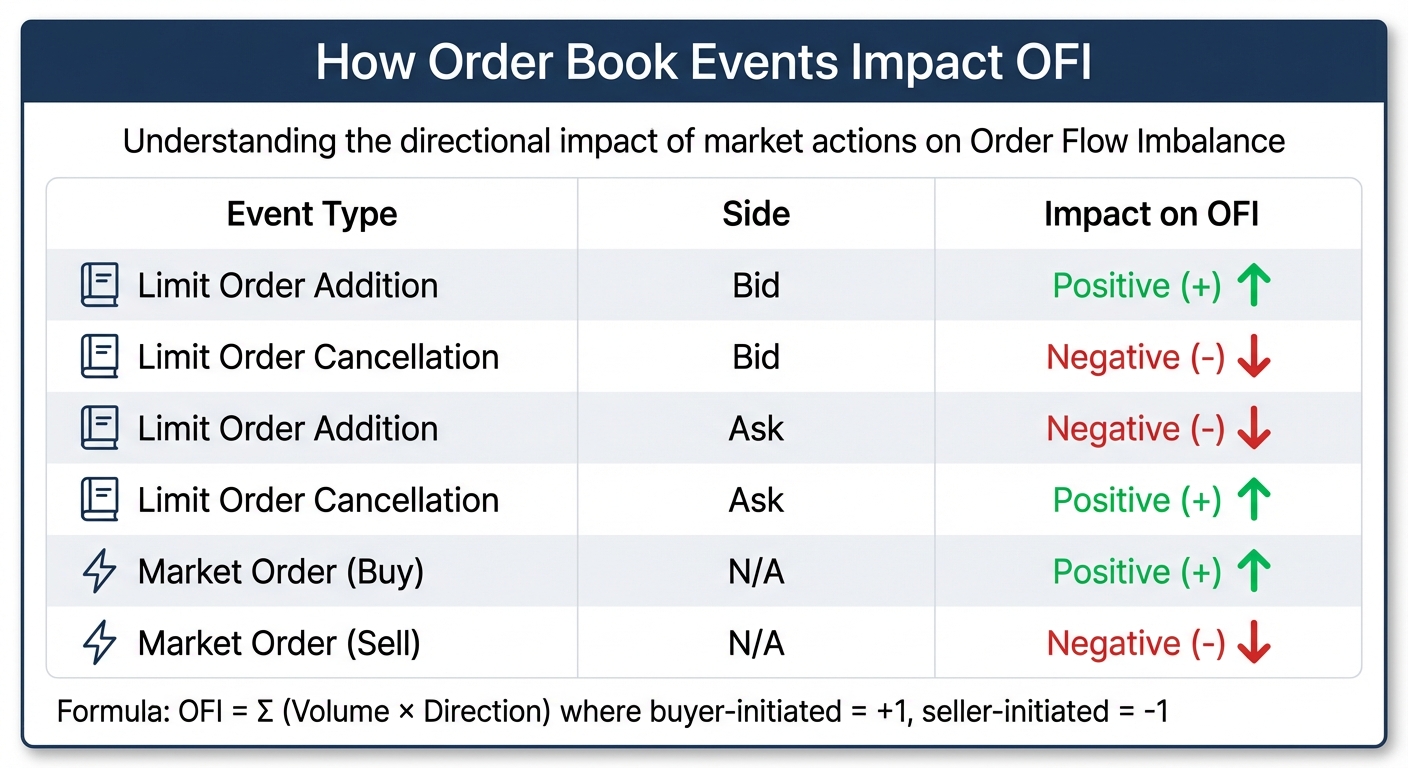
At its core, OFI is calculated using the formula: OFI = Σ (Volume × Direction). Here, buyer-initiated events are assigned a value of +1, while seller-initiated events are assigned -1.
The impact of various order book events on OFI can be summarized as follows:
| Event Type | Side | Impact on OFI |
|---|---|---|
| Limit Order Addition | Bid | Positive (+) |
| Limit Order Cancellation | Bid | Negative (-) |
| Limit Order Addition | Ask | Negative (-) |
| Limit Order Cancellation | Ask | Positive (+) |
| Market Order (Buy) | N/A | Positive (+) |
| Market Order (Sell) | N/A | Negative (-) |
To make OFI comparable across securities with varying trade volumes, traders often use Normalized OFI (NOFI), which divides the raw OFI by the total trade volume during the period. More advanced strategies include Multi-Level OFI (MLOFI), which accounts for imbalances across multiple price levels instead of focusing solely on the top-of-book. Additionally, some traders use "Stationarized OFI" (log-OFI) to better manage non-stationary order book activity, which can improve its alignment with mid-price changes.
Run 24/7 while you sleep. Keep bots, platforms, and trade copiers online on a dedicated VPS.
Low-latency VPS hosting for your trading platform.
From $59.99/mo
How to Read Order Flow Imbalance Signals
Positive vs. Negative OFI: What They Mean
Positive Order Flow Imbalance (OFI) reflects net buy-side pressure. This happens when aggressive buyers hit the ask, signaling upward pressure on prices. On the other hand, negative OFI shows net sell-side pressure, where aggressive sellers hit the bid, consuming buy-side liquidity and driving prices down.
"A significant imbalance in the order flow indicates the prevailing sentiment among traders. A higher number of buy orders compared to sell orders suggests a bullish sentiment." - Bookmap
The connection between OFI and price changes is often linear over short timeframes, described by the formula ΔP = β · OFI, where β is the price impact coefficient. However, the extent of the impact depends heavily on market depth. In markets with thin order books and low liquidity, even small imbalances can lead to sharp price movements. In contrast, highly liquid markets tend to absorb these imbalances more smoothly.
A notable signal to watch is when the volume on one side exceeds the other by three times or more at a specific price level. This often points to a significant imbalance worth acting on. Similarly, stacked imbalances across three or more consecutive price levels can indicate strong momentum and conviction in the market.
Another key pattern is absorption. When high OFI values occur without much price movement, it suggests large passive orders are absorbing the aggressive pressure. This often hints at a potential price reversal rather than a continuation. On the flip side, be cautious of large imbalances that appear and vanish quickly without execution, as these could be spoofing attempts meant to mislead traders about market sentiment.
Understanding these immediate effects of OFI provides a foundation for analyzing how these signals influence price movements over time.
Price Impact and Time Delays
Once you grasp the meaning of OFI signals, timing their impact becomes essential. While OFI is primarily a real-time indicator, its full effect on prices can unfold over seconds to minutes. This relationship is most reliable for timeframes ranging from 50 milliseconds to 5 minutes. Beyond these intervals, price changes may scale with the square root of the traded volume.
OFI signals also show positive autocorrelation, meaning they tend to predict a continuation of the current market pressure in the short term. High-frequency trading strategies should adapt their expectations based on real-time changes in market depth, as the price impact coefficient (β) decreases when liquidity is higher.
"Empirical work demonstrates that contemporaneous price changes over short horizons are linearly related to OFI with a stock- and time-varying impact coefficient β, often inversely related to the prevailing market depth." - Emergent Mind
The effectiveness of OFI as a predictive tool depends on the market environment. It tends to perform better in some conditions while being less reliable in others. Traders can improve their analysis by combining OFI data with volume profile insights. For example, imbalances near High-Volume Nodes (HVNs) often act as stronger support or resistance levels, offering valuable context for trading decisions.
Tools and Platforms for OFI Analysis
Software for OFI Analysis
Specialized tools like NinjaTrader 8's Order Flow + suite provide real-time insights into Order Flow Imbalance (OFI) using features such as volumetric bars, cumulative delta, market depth maps, and VWAP. These tools make it easier to identify aggressive order activity as it happens.
Footprint charts are another essential tool, offering a clear view of executed orders at specific price levels. They help traders identify "stacked imbalances", which occur when multiple buy or sell imbalances line up across consecutive price levels. These patterns often indicate strong market aggression. For example, if one side's volume is three times that of the other, it signals significant pressure.
The Depth of Market (price ladder) is invaluable for tracking real-time bids and asks, enabling quick order placement - an absolute must when milliseconds can make or break a trade. Similarly, Time & Sales (also known as "the tape") provides a detailed log of every executed trade, including price, volume, and time, offering insights into market momentum and pace.
For algorithmic traders, Freqtrade stands out as an open-source platform that supports order flow analysis. It allows customization of parameters like imbalance_ratio and stacked_imbalance_range for automated strategies. However, handling raw trade data with this tool requires significant memory and infrastructure, which can result in slower startup times if not properly managed.
"Successful OFI model implementation requires: Low-latency data processing, efficient database management, [and] real-time analytics capabilities." - QuestDB
These advanced software tools form the backbone of effective OFI analysis, especially when paired with high-performance hosting solutions to ensure optimal performance.
QuantVPS Hosting for High-Performance Trading
High-frequency trading thrives on ultra-low latency and high data throughput, and QuantVPS is designed to meet these demands. With latency as low as 0–1ms, optimized hardware configurations, and strategically located global data centers, QuantVPS ensures seamless operation for platforms like NinjaTrader, MetaTrader, and TradeStation.
The VPS Pro plan, priced at $99.99/month (or $69.99/month with an annual subscription), includes 6 cores, 16GB RAM, and 150GB NVMe storage, alongside network speeds exceeding 1Gbps. This setup is ideal for running 3-5 charts equipped with order flow tools. For traders with more intensive needs, the VPS Ultra plan, at $189.99/month (or $132.99/month annually), offers 24 cores, 64GB RAM, and 500GB NVMe storage, making it suitable for handling 5-7 charts with heavy data loads.
NVMe storage plays a critical role in processing the large datasets required for footprint charts and volumetric analysis. Combined with the proximity of QuantVPS's data centers to major exchange matching engines, this setup minimizes delays between signal generation and order execution. In high-frequency trading, where every millisecond counts, this can mean the difference between securing a profit and suffering from slippage. QuantVPS ensures that your algorithms are always a step ahead of the market.
Using Order Flow Imbalance in Trading Strategies
OFI-Based Trading Strategies
Making the most of Order Flow Imbalance (OFI) strategies starts with filtering out the noise. A good starting point is using a 3:1 imbalance ratio, which helps you focus on meaningful buying or selling pressure while ignoring insignificant fluctuations.
Stay online and closer to execution. Choose a VPS location for CME futures, New York markets, London FX, API trading, and more.
Host your platform near the market route that matters.
From $59.99/mo
Another effective approach is identifying stacked imbalances - situations where imbalances occur across multiple consecutive price levels. For instance, setting a stacked imbalance range to cover three levels can highlight zones where aggressive buying or selling is concentrated, giving you a clearer picture of market intent.
For those interested in statistical arbitrage, working with log-transformed OFI (log-OFI) instead of raw values can make a big difference. By transforming the data, you create a more stable relationship with mid-price movements, which improves the accuracy of predictive models. Some advanced traders also use Multi-Level OFI (MLOFI), which examines imbalances across multiple order book depths rather than just focusing on the top levels. This broader analysis can provide sharper insights into short-term price shifts.
Timing your trades is just as important. During a buy-side imbalance, placing buy orders slightly above the best bid can increase the likelihood of execution. Pair this with tight stop-losses to manage the fast pace of high-frequency scalping. Keep an eye on footprint charts; if you see high volume without corresponding price changes, it could signal trapped orders and a potential market reversal. Combining OFI signals with tools like VWAP touches or standard deviation bands often aligns with institutional trading patterns, creating setups with higher success rates.
To make these strategies work, you'll need a robust system capable of real-time execution.
Infrastructure Requirements for OFI Trading
Trading with OFI strategies isn't just about spotting the right signals - it also depends on having the right hardware to handle real-time data processing. As highlighted in earlier sections, order flow analysis requires a system that can manage large amounts of data without slowing down.
Unlike standard candlestick charts, processing raw trade data demands significantly more memory. To avoid delays, ensure your system has enough RAM. For simpler strategies involving one or two charts, a setup with 4 cores and 8GB of RAM is a good starting point. However, if you're working with more complex setups - like 3–5 charts that include footprint analysis, cumulative delta, and volumetric bars - you'll need at least 6 cores and 16GB of RAM.
For more demanding needs, consider using services like QuantVPS, which offer scalable hosting plans. These plans support 1–7 charts and can handle intensive data processing tasks. A network speed of over 1Gbps is crucial to ensure your system can process order book updates in real time without any bottlenecks. In high-frequency trading, where milliseconds matter, aligning your hardware with your strategy's complexity is non-negotiable.
Success in high-frequency trading comes down to optimizing both your strategy and the technology behind it. By ensuring your infrastructure matches your trading demands, you can execute strategies more effectively and stay ahead in the fast-paced world of order flow trading.
Conclusion
Order Flow Imbalance (OFI) signals offer high-frequency traders something that traditional technical indicators simply can't match: real-time insights into market behavior. As Hameral explains, "Order flow tools show what is happening right now". Unlike lagging indicators that reflect historical data, OFI uncovers the immediate buying and selling pressures that drive price changes - often before those changes fully unfold. This ability to anticipate rather than react is what sets proactive traders apart.
However, successfully leveraging OFI signals requires more than just understanding them. It demands cutting-edge infrastructure capable of keeping up with the market's lightning-fast pace. Processing thousands of order book events per millisecond calls for low-latency hosting, immense computational power, and network speeds exceeding 1Gbps. Without these critical components, even the most advanced OFI strategies can fall short as fleeting opportunities disappear.
Research has consistently shown a clear link between OFI and short-term price movements. Specifically, price changes over brief timeframes are linearly tied to OFI, with the strength of this relationship often inversely correlated to market depth. This measurable advantage, however, can only be harnessed with the right tools and infrastructure in place.
That’s where QuantVPS comes in. With features like NVMe storage, unmetered bandwidth, and network speeds over 1Gbps, QuantVPS ensures your system can handle the intense data loads of high-frequency trading without delays. By combining precise OFI signals with robust hosting solutions, traders gain the tools they need to stay ahead.
In high-frequency trading, success hinges on spotting opportunities early and acting fast. OFI signals provide the critical visibility, but it’s the right infrastructure that turns that visibility into actionable, profitable trades.
FAQs
What makes Order Flow Imbalance different from traditional technical indicators?
Order Flow Imbalance (OFI) captures the real-time difference between buy-side and sell-side activity in the order book. It provides a snapshot of supply and demand pressure by reflecting the actual flow of orders - whether it's limit orders, market orders, or cancellations. Because OFI reacts instantly to shifts in buying or selling intent, it's a powerful tool for anticipating short-term price changes and managing execution risk.
On the other hand, traditional technical indicators like moving averages, RSI, or MACD rely on historical price and volume data. These tools use formulas to smooth out or analyze past trends, which introduces a lag when it comes to real-time market activity. While they’re helpful for identifying broader trends, they’re not as precise or immediate, making them less effective for high-frequency trading strategies.
In essence, OFI delivers a live, order-driven perspective on market dynamics, whereas traditional indicators provide a lagging, price-focused view that works better for long-term analysis.
What do I need to effectively use Order Flow Imbalance (OFI) in high-frequency trading?
To make the most of Order Flow Imbalance (OFI) in high-frequency trading (HFT), you’ll need a lightning-fast infrastructure. It all starts with a real-time, full-depth market data feed. This feed should capture every order book event - like limit orders, market orders, and cancellations - with sub-millisecond latency. Without this, you're already behind.
Next, you’ll require high-performance computing resources. Think co-located or dedicated trading servers equipped with ultra-fast multi-core CPUs or specialized accelerators like FPGAs or GPUs. These are essential for processing and updating OFI metrics in real time.
A high-speed network connection (10 Gbps or better) is non-negotiable, along with physical proximity to the exchange’s data center to shave off every possible millisecond of delay. Don’t overlook robust data storage systems either; they’re critical for back-testing strategies and fine-tuning your trading models.
On the software side, tools that visualize order flow data - such as Footprint charts or cumulative delta - can provide valuable insights. These tools should integrate seamlessly with low-latency order execution engines to act on signals instantly. And, of course, you’ll need risk management tools to keep tabs on your positions and flag anomalies in real time.
When combined, these components form the backbone of a system designed to capitalize on OFI signals in the fast-paced world of HFT.
What are key order flow imbalance (OFI) patterns high-frequency traders should monitor?
Order flow imbalance (OFI) signals emerge when there’s a noticeable shift in the balance between buy-side and sell-side activity. High-frequency traders often keep an eye out for a large and sustained buy-side imbalance, as it can point to bullish pressure and the potential for prices to climb. On the flip side, a sell-side imbalance typically hints at bearish momentum and a probable price decline.
Traders also focus on sudden imbalance spikes, which often occur right before rapid price changes - making them especially useful for scalping strategies. Another key pattern is the reversal, where a strong buy-side imbalance switches to the sell-side (or vice versa). This can serve as an early indicator of a trend shift or a potential price reversal.
The relationship between OFI and market liquidity is another critical factor. When imbalances grow while liquidity thins out (fewer resting orders), the price impact can become more pronounced. However, in markets with deeper liquidity, even high imbalances might have a more muted effect on price. By keeping a close watch on these patterns, traders can make sharper, data-driven decisions in fast-paced trading environments.


