
20 Must-Have Free NinjaTrader Indicators for Advanced Charting
NinjaTrader offers a powerful trading platform with free access to advanced charting tools and over 100 built-in indicators. But the real advantage lies in its compatibility with third-party tools, allowing traders to expand their toolkit with free, community-built indicators. This article highlights 20 free NinjaTrader indicators that enhance trend analysis, momentum tracking, volume insights, and workflow efficiency.
Key Highlights:
- Trend Analysis: Tools like SuperTrend, EMA Crossover, and Multi Time Frame Trend Line help identify trends and reversals.
- Momentum Indicators: RSI, MACD, and Stochastic Oscillator provide insights into price strength and potential reversals.
- Volume Analysis: Volume Profile and VWAP uncover key price levels and trading activity zones.
- Workflow Tools: Indicators like Risk/Reward Advanced and BetterBarTimer simplify trade planning and execution timing.
- Smart Money Concepts: Tools like Market Structure Zones and Fibonacci Retracement refine entry and exit strategies.
These indicators cater to both day traders and swing traders, offering features like multi-timeframe analysis, automated alerts, and customizable settings. By combining a few of these tools strategically, traders can improve decision-making and precision.
Start with a handful of indicators that align with your trading style. Use NinjaTrader's free simulation tools to test and refine your setup before going live.
Start with a handful of indicators that align with your trading style. Use NinjaTrader's free simulation tools to test and refine your setup before going live.
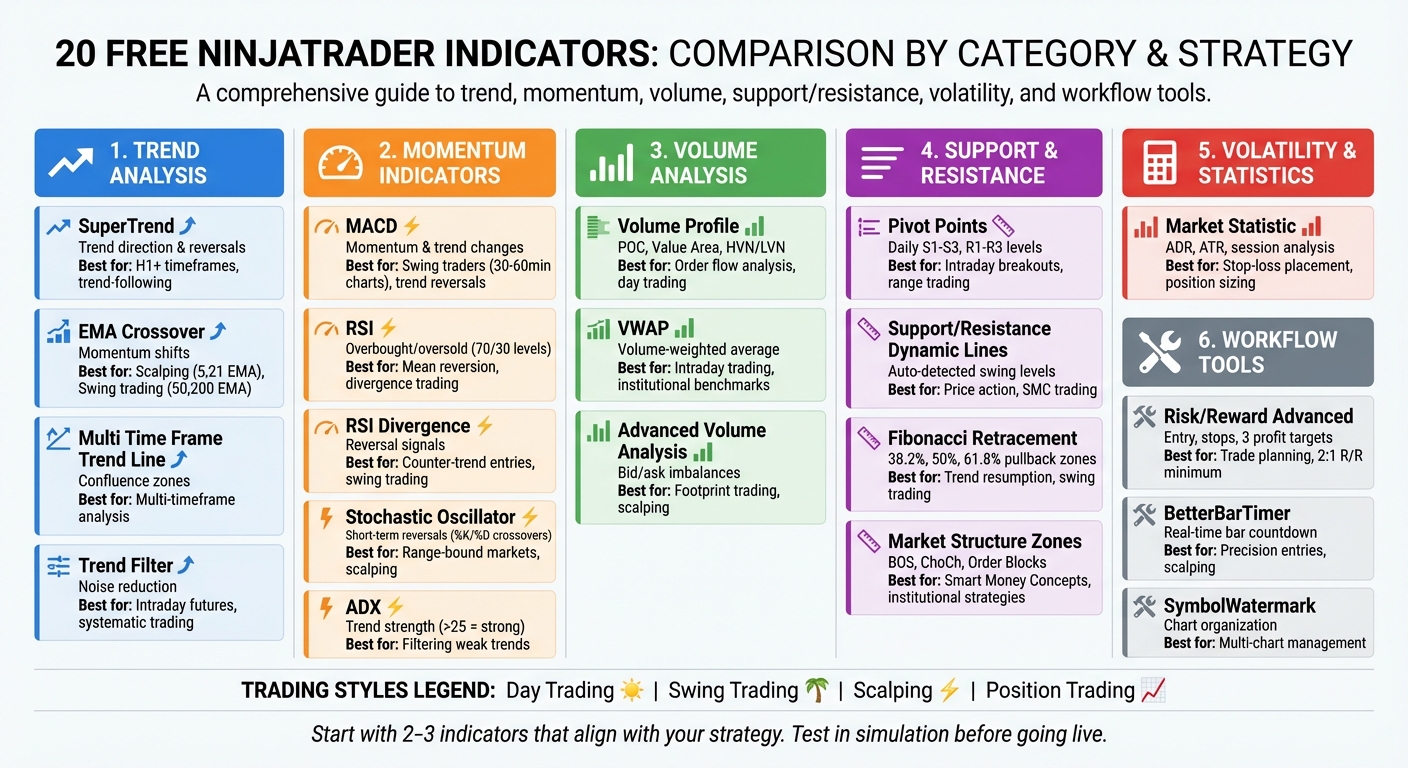
20 Free NinjaTrader Indicators Comparison Chart by Category and Trading Strategy
20 Free NinjaTrader Indicators Comparison Chart by Category and Trading Strategy
1. SuperTrend Indicator
The SuperTrend indicator is a go-to tool for traders seeking better clarity in identifying trends and market movements.
Primary Function and Use Case
This indicator helps pinpoint trend direction and market volatility while offering signals for reversals and trade entry or exit points. It uses color-coded lines to simplify trend recognition: a red line above the price signals a bearish trend, while a green line below indicates a bullish trend. A buy signal occurs when the price moves above the red line, and a sell signal is triggered when the price drops below the green line.
Key Features and Customization Options
The SuperTrend is built on Average True Range (ATR) data, with the default ATR period often set to 10. Traders can adjust both the ATR period and multiplier to suit their needs. A higher multiplier smooths out trends, while a lower one makes the indicator more sensitive to minor price changes.
Advanced versions available on the NinjaTrader Ecosystem include automated alerts and have been downloaded over 14,658 times. These versions offer more than 25 smoothing and moving average options, such as HMA, EMA, VWMA, and ZeroLagTEMA, giving traders a wide range of customization.
Advantages and Limitations
The SuperTrend is excellent for identifying trend reversals and the start of new trends. However, it can generate false signals during sideways markets or on short timeframes. To reduce errors, some traders combine it with a 200-period Exponential Moving Average (EMA) - buying only when the price is above the EMA and selling when it’s below. Others use a Triple SuperTrend setup with different parameter configurations to filter out weaker pullbacks.
Best Suited for Specific Trading Strategies
This indicator works best on H1 and higher timeframes, making it ideal for medium- to long-term trend-following strategies. It’s less effective for short-term scalping due to intraday market noise. For more reliable trend identification, traders often rely on H1, H4, or Daily charts to avoid the impact of short-term volatility.
Up next, we’ll explore how the EMA Crossover can refine your chart analysis even further.
2. EMA Crossover
The EMA Crossover indicator uses two or more Exponential Moving Averages (EMAs) with different timeframes to help traders spot trends, shifts in momentum, and potential reversals. A bullish signal happens when a shorter-term EMA moves above a longer-term EMA, while a bearish signal occurs when it crosses below.
Primary Function and Use Case
Many NinjaTrader versions make it easy to spot signals with visual aids like colored arrows that appear immediately after a crossover. The distance between EMA lines can indicate the strength of a trend - wider gaps suggest strong momentum, while lines that converge point to possible consolidation. These EMA lines also act as dynamic support and resistance levels, providing opportunities for high-probability trade entries when prices bounce off them.
"The crossover signals the current trend direction and may indicate an impending reversal." - QuantVue
"The crossover signals the current trend direction and may indicate an impending reversal." - QuantVue
Key Features and Customization Options
Some advanced versions of the EMA Crossover offer additional flexibility, such as the ability to base EMAs on different price points like Open, Close, High, or Low. This can be particularly helpful for building price channels. Certain variants also use color-coded plots - green for bullish, red for bearish, and grey for neutral - to reflect market sentiment based on bar closes. On-chart toggle buttons make it simple to activate or deactivate EMA plots as needed. Additionally, free versions often come with NinjaScript (C#) source code, allowing traders to enhance the indicator with features like audio alerts, email notifications, or volume filters.
Advantages and Limitations
EMAs differ from Simple Moving Averages by giving more weight to recent price movements, which makes them respond faster to market changes. That said, the EMA Crossover is still a lagging indicator, meaning it may not perform as well in choppy or sideways markets. To reduce false signals, traders often pair it with tools like Donchian Channels or momentum oscillators, such as the Stochastic Oscillator. It's also wise to check that the crossover aligns with the trend on a higher timeframe for added confirmation.
Best Suited for Specific Trading Strategies
The EMA Crossover can be adapted to suit various trading styles. For scalping or day trading, shorter EMA periods like 5 and 21 are often used, while longer periods such as 50 and 200 are better suited for swing trading or long-term strategies. Scalpers tend to focus on pullbacks where the price returns to short-term EMA levels within a trend. Day traders might look for "EMA bounce" setups, where prices react to EMA levels acting as support or resistance. Swing traders, on the other hand, typically wait for short-term EMAs to align with a longer-term trend before entering trades. Two well-known patterns include the "Golden Cross", where the 50-period EMA crosses above the 200-period EMA (bullish signal), and the "Death Cross", where the 50-period EMA drops below the 200-period EMA (bearish signal).
Continue to the Multi Time Frame Trend Line Indicator for a broader market view.
3. Multi Time Frame Trend Line Indicator
The Multi Time Frame Trend Line Indicator brings trend lines from multiple timeframes - such as 15-minute, hourly, daily, and weekly - together on a single chart. This eliminates the need to toggle between charts, offering a unified view of market trends. It’s particularly useful for spotting confluence zones, where trends from different timeframes align, providing traders with valuable insights.
Primary Function and Use Case
With this tool, drawing a trend line automatically extends it as a ray, complete with labels visible on lower timeframes. The indicator uses a smart hierarchy system: higher timeframe trend lines (like weekly) appear on lower timeframe charts (such as daily), while lower timeframe lines remain hidden on higher timeframe views. This feature reduces clutter, ensuring that only the most relevant structural levels are displayed. These dynamic capabilities also allow for further customization to suit individual preferences.
"Market trends can be working on various time scales, and what may seem like a powerful uptrend on a 15-minute chart may be part of an overall downtrend that is only visible on daily or weekly charts." – Shariful Hoque, SEO Content Writer, Rize Capital
"Market trends can be working on various time scales, and what may seem like a powerful uptrend on a 15-minute chart may be part of an overall downtrend that is only visible on daily or weekly charts." – Shariful Hoque, SEO Content Writer, Rize Capital
Another standout feature is its automatic trend break detection. When a trend line is broken, the indicator switches the solid line to a dotted one and places a directional arrow - red for bearish breaks and blue for bullish - near the bar where the break occurred. Additionally, an adaptive EMA adjusts itself based on the current chart’s timeframe, adding another layer of trend analysis.
Key Features and Customization Options
Users can personalize the indicator to fit their trading platform’s theme by adjusting trend line colors, fonts, and labels. It supports multiple timeframe options, including 15-minute, hourly, 4-hour, daily, weekly, monthly, and even quarterly intervals. Labels automatically show the corresponding timeframe and price levels along the chart’s right edge, with options to modify font size and style. The indicator is free to use for life and includes updates at no additional cost.
Advantages and Limitations
This tool works seamlessly with any instrument supported by NinjaTrader 8, such as stocks, futures, forex, and cryptocurrencies, enabling efficient, multi-layered analysis. However, one limitation is that a trend line is only marked as "broken" if the current chart’s timeframe matches the one where the trend line was originally drawn. For day traders, it’s recommended to plot daily and weekly trend lines on 15-minute charts to align intraday trades with the broader market trend. To manage risk effectively, consider placing stop-losses above or below key higher timeframe trend lines instead of arbitrary levels, reducing the chance of being stopped out by minor intraday fluctuations.
Best Suited for Specific Trading Strategies
- Day traders: Benefit from displaying 15-minute, hourly, 4-hour, and daily trend lines to align short-term opportunities with daily structures.
- Swing traders: Should focus on the overlap between 4-hour setups and weekly or monthly trend lines, as these confluences often indicate stronger probabilities.
- Position traders: Can rely on daily, weekly, monthly, and quarterly trend lines to identify major reversal points and assess long-term sentiment.
- Scalpers: Even on 1-minute or 5-minute charts, the indicator helps maintain awareness of higher timeframe trends without the need to switch between multiple chart windows.
Next, dive into the MACD indicator to explore momentum shifts and how they complement trend analysis.
4. MACD (Moving Average Convergence Divergence)
The MACD is a tool for gauging momentum and trends, helping traders spot changes in trend strength, direction, and duration. Created by Gerald Appel in the late 1970s, the MACD consists of three main parts: the MACD line (difference between 12- and 26-period EMAs), the Signal line (a 9-period EMA of the MACD line), and the Histogram (difference between the MACD and Signal lines). Unlike bounded oscillators like the RSI, the MACD is unbounded, making it particularly useful for identifying momentum in markets with strong trends.
Primary Function and Use Case
The MACD is especially effective for identifying crossovers, such as when the MACD line crosses the Signal line or the zero line. A bullish signal occurs when the MACD line moves above the Signal line, while a bearish signal happens when it crosses below. Readings above zero indicate bullish momentum, while those below zero suggest bearish momentum. Traders also watch for divergence, where price makes a new high or low, but the MACD does not - a potential sign of a trend reversal.
"The MACD line is similar to the first derivative of price with respect to time. The signal line is similar to the second derivative of price with respect to time." – Dan Buckley, Chief Analyst, DayTrading.com
"The MACD line is similar to the first derivative of price with respect to time. The signal line is similar to the second derivative of price with respect to time." – Dan Buckley, Chief Analyst, DayTrading.com
A backtest of EUR/USD daily charts revealed that combining the MACD with a 50-period SMA reduced false signals and minimized unnecessary trades.
Key Features and Customization Options
The MACD comes pre-installed in NinjaTrader with default settings of 12, 26, and 9 periods, originally designed for a six-day trading week. You can tweak these settings to align with your trading strategy - such as using (5, 42, 5) for quicker signals. Additionally, third-party versions in the NinjaTrader Ecosystem offer expanded features, including alternative moving average types (e.g., DEMA, HMA, SMA, VWMA, ZLEMA), multi-timeframe analysis, and customizable alerts for events like zero-line crosses or changes in slope.
Advantages and Limitations
The MACD's histogram visually represents momentum shifts, with its height and slope indicating the rate of change in price momentum. However, it can generate false signals in sideways or range-bound markets. To reduce noise, traders often pair the MACD with a trend-filtering tool, like a 50-period SMA, and only act on bullish MACD crossovers when the price is above the SMA. Monitoring the histogram as it moves toward the zero line can also provide early clues for potential crossovers.
Best Suited for Specific Trading Strategies
Swing traders often use the MACD on 30-minute, 60-minute, and daily charts to capture multi-day price movements. Day traders prefer shorter timeframes (1-minute to 15-minute charts) to track intraday momentum and shifts. For trend-following strategies, zero-line crossovers on daily and weekly charts help confirm long-term trend directions. The MACD is most effective in liquid, trending markets - such as stocks, commodities, and indexes - where it can reliably highlight both trend direction and strength. Next, dive into the Volume Profile indicator to see how price interacts with volume.
5. Volume Profile
Volume Profile takes a different approach to volume analysis. Instead of focusing on how much was traded over time, it highlights where trading activity occurred. This horizontal perspective shows the total trading volume at specific price levels during a given period. By identifying these high-activity zones - often referred to as “fair value” areas - you can pinpoint support, resistance, and potential breakout levels with greater clarity.
Primary Function and Use Case
This tool zeroes in on three key elements: the Point of Control (POC), which identifies the price level with the highest traded volume; the Value Area (VA), which covers the price range where 68% or 70% of the total volume occurred; and High Volume Nodes (HVN) and Low Volume Nodes (LVN), which highlight areas of price acceptance and rejection. Traders often treat these levels as actionable entry and exit points. The POC, in particular, tends to act as a price magnet. As the NinjaTrader Team explains: "Volume isn't just a measure of how much is being traded - it can also reveal where key activity is taking place".
Key Features and Customization Options
NinjaTrader’s Volume Profile indicators come with a range of customization settings. You can tweak session intervals (like RTH versus Globex), profile width, opacity, and "Ticks Per Level" to organize price data more effectively. Advanced versions include features like Bid/Ask Mode, which separates volume into buyer and seller activity, and Auto Merge, which combines adjacent profiles with overlapping value areas. While the Order Flow + Volume Profile is bundled with NinjaTrader’s Lifetime license, free options like the Hameral Basic Volume Profile and automated-trading.ch Volume Profile also offer practical functionality without extra cost.
Advantages and Limitations
This indicator goes beyond basic price action by offering a deeper view of market activity, helping to validate trends with volume data. However, it’s important to note that Volume Profile is a reactive tool - it reflects past activity rather than forecasting future price movements. Additionally, achieving optimal accuracy in NinjaTrader may require specific settings, such as enabling "Tick Replay", or purchasing the Lifetime license for access to Order Flow data. While Volume Profile provides granular insights into trading levels, tools like VWAP focus on broader, trend-following averages.
Best Suited for Specific Trading Strategies
Day traders often use Volume Profile for strategies like opening range trades, scalping near the POC, or fading the Value Area’s edges on short-term charts (e.g., 5-minute or 30-minute). Swing traders, on the other hand, rely on daily or weekly profiles to uncover long-term value zones and areas of institutional interest. For breakout trades, Low Volume Nodes (LVNs) can signal regions where price might move quickly after exiting a consolidation phase. For example, if the market opens above the prior day’s Value Area, a pullback to the POC could present a buying opportunity.
Next, we’ll dive into how VWAP complements Volume Profile by offering a dynamic, volume-weighted average price.
6. VWAP (Volume-Weighted Average Price)
VWAP measures the average price of an asset, weighted by the volume traded at each price level during a specific period. Unlike traditional moving averages, VWAP incorporates trading volume, providing a clearer picture of the actual average price. This makes it particularly valuable for institutional traders, such as hedge funds and pension funds, who aim to execute trades below the VWAP when buying and above it when selling.
Primary Function and Use Case
VWAP acts as both a support and resistance level and a tool for confirming trends. When the price is above the VWAP line, it signals a bullish sentiment, while trading below it suggests bearish conditions. Additionally, the slope of the VWAP line helps traders assess price momentum. This versatility makes it a go-to indicator for intraday trading.
"VWAP is commonly used by institutions such as hedge and pension funds when building and closing positions. Considered a benchmark for order fills, institutional VWAP traders seek to buy below the VWAP line and sell above it".
"VWAP is commonly used by institutions such as hedge and pension funds when building and closing positions. Considered a benchmark for order fills, institutional VWAP traders seek to buy below the VWAP line and sell above it".
Key Features and Customization Options
Most VWAP indicators in NinjaTrader include up to three standard deviation bands (multipliers of 1, 2, and 3), which adjust dynamically with market volatility. These bands help identify potential reversal zones, as prices often bounce near the outer bands. Advanced versions offer anchoring options, allowing traders to reset calculations at the market open (Session Mode), attach them to specific price swings (Click & Drag), or align them with historical events like IPOs (DateVWAP). There's also flexibility in choosing the data source, whether it's Open, High, Low, Close, or the Typical Price [(H+L+C)/3], along with dynamic color-coding to signal when price crosses the VWAP line.
Advantages and Limitations
By factoring in trading volume, VWAP provides a more accurate reflection of market value compared to simple moving averages. However, it shouldn't be relied upon in isolation, as it may produce false signals. Combining VWAP with other indicators can improve the reliability of trade setups. It's also worth noting that VWAP is primarily designed for intraday use, resetting at the start of each trading session unless you're using an anchored version.
Best Suited for Specific Trading Strategies
Day traders often use VWAP for pullback strategies (buying when the price returns to the VWAP line during an uptrend), breakout trades (entering when the price crosses VWAP with strong volume), and scalping opportunities on short timeframes like 1-minute, 5-minute, or 15-minute charts. Swing traders can apply weekly or monthly VWAP settings or use Anchored VWAP to track average prices from key market events or significant highs and lows. For mean reversion trades, watch for prices to stretch beyond the 2nd or 3rd standard deviation bands before reverting toward the VWAP line.
Next, take a closer look at the ADX indicator to sharpen your trend analysis skills.
7. ADX (Average Directional Index)
The ADX is a tool designed to measure the strength of a trend. Unlike indicators that focus on market direction, the ADX focuses solely on how strong the trend is. A rising ADX signals increasing momentum, while a falling ADX - especially from higher levels - might suggest the trend is losing energy or shifting into a range-bound phase. When paired with other indicators, the ADX adds depth to your analysis by quantifying trend momentum.
Primary Function and Use Case
One of the key benefits of the ADX is its ability to help traders avoid applying trend-following strategies in sideways markets. In trending conditions, an ADX reading above 25 indicates strong momentum, while values below 20 suggest weak or minimal momentum. J. Welles Wilder, the creator of the ADX, identified 25 as the benchmark for identifying a strong trend. Since the ADX doesn't provide directional information, it’s often plotted alongside the Positive and Negative Directional Movement Indicators (DMI+ and DMI-) to offer a clearer picture of market direction.
Key Features and Customization Options
The standard ADX tool in NinjaTrader is available for free and uses a default 14-period calculation. However, some traders, such as those who follow Dr. Charles Schaap's methods, prefer tweaking these settings - for example, using a 13-period DM and an 8-period ADX - to better align with specific market conditions. For those seeking more advanced features, third-party tools like those from Affordable Indicators provide extras like multi-timeframe analysis, color-coded trend visuals, and automated alerts (via sound, email, or text) for when the ADX crosses user-defined thresholds. These enhancements make it easier to identify and act on changes in trend strength.
NEVER MISS A TRADE
Your algos run 24/7
even while you sleep.
99.999% uptime • Chicago, New York, London & Amsterdam data centers • From $59.99/mo
Advantages and Limitations
The ADX excels at filtering out weak trends, helping traders avoid getting caught in choppy, unpredictable markets. For instance, when the ADX rises above 20, it confirms that momentum is building. Conversely, if the ADX drops after reaching a high level (e.g., above 40), it may signal that the trend is losing steam. This can be a cue to tighten stop-losses or consider scaling out of positions. This ability to gauge trend strength makes the ADX a versatile tool for both swing and day traders.
Best Suited for Specific Trading Strategies
Swing traders often rely on the ADX to measure market strength over days or weeks, helping them capture larger price moves. Day traders, on the other hand, use the ADX to confirm short-term trend strength before entering trades. For example, when a 9-period EMA crosses above a 21-period EMA, ensuring the ADX is above 25 can confirm that the trend has enough momentum to follow through. For traders employing range-bound strategies, the ADX can also serve as a "no-trade" filter - waiting for the ADX to rise above 20 during a breakout helps avoid entering trades prematurely.
8. RSI (Relative Strength Index)
Building on the momentum insights offered by ADX, the RSI sharpens your focus by identifying potential price reversals with greater precision.
The Relative Strength Index (RSI) is a momentum oscillator that measures both the speed and magnitude of price changes. Introduced by J. Welles Wilder Jr. in his 1978 book, New Concepts in Technical Trading Systems, the RSI operates on a scale from 0 to 100. Typically, readings above 70 suggest overbought conditions - hinting at a possible price pullback - while values below 30 indicate oversold conditions, signaling the potential for a price rebound. Traders also monitor divergences, where price movement and RSI patterns differ, and "failure swings", which can act as early warning signs of reversals.
Primary Function and Use Case
The RSI evaluates recent gains against recent losses, using a default 14-period smoothing method. Rather than reacting to RSI hitting 70 or 30, many traders wait for it to cross back below 70 or above 30 to confirm a shift in momentum. Divergence patterns are especially valuable; for example, when prices hit a higher high but the RSI shows a lower high, it often signals weakening upward momentum. These patterns can help traders anticipate turning points earlier.
Key Features and Customization Options
NinjaTrader's free RSI tool offers flexibility for traders to adapt the indicator to their strategies. While the default period is set to 14 bars, users can adjust this along with the input data. The smoothing period can also be fine-tuned to minimize noise in volatile or choppy markets. Enhanced versions, such as the VRSI or Ultimate RSI, introduce features like color-coded displays and automatic alerts when overbought or oversold levels are breached. These customizations make the RSI a practical tool for real-world trading scenarios.
Advantages and Limitations
The RSI excels at filtering out weak momentum and identifying reversals through divergence. However, in strong trending markets, the RSI can remain in overbought or oversold zones for extended periods, potentially leading to misleading signals. For instance, during a strong uptrend, the RSI might stay between 40 and 90, with the 40–50 range acting as support rather than a sell signal. To address this, many traders pair the RSI with other tools, such as volume indicators or moving averages, for a more comprehensive analysis.
Best Suited for Specific Trading Strategies
Day traders often rely on the RSI in short-term charts (like 5- or 15-minute intervals) to capture quick momentum shifts, timing entries and exits based on the 70/30 levels. Swing traders, on the other hand, use daily charts to confirm broader trends, with an RSI above 50 signaling sustained upward momentum. For divergence trading, the RSI is particularly effective - if prices reach a new high but the RSI doesn’t, it can act as an early indicator of a reversal. This versatility makes the RSI a go-to tool for spotting momentum changes and trend weaknesses. When combined with other NinjaTrader tools, it becomes a valuable component of a comprehensive trading strategy.
9. Pivot Points Indicator
The Pivot Points Indicator provides traders with static support and resistance levels calculated before the trading day begins. Using the previous period's high, low, and close, it identifies a central pivot point (PP), along with three resistance levels (R1, R2, R3) and three support levels (S1, S2, S3). The central pivot point formula is straightforward: (High + Low + Close) / 3. Unlike dynamic indicators that update throughout the day, these levels remain fixed, offering clear reference points for planning trades.
Primary Function and Use Case
When prices trade above the central pivot point, it suggests a bullish sentiment, while trading below indicates bearish conditions. Traders often monitor how prices interact with support and resistance levels - whether they bounce off or break through - to decide on entries and exits. These predefined levels simplify decision-making and work well alongside other technical tools.
"Pivot points can be the 'make or break' difference when confirming an entry or an exit. Traders can lean on these to save ticks on losing trades and let winners run just a bit longer." – Ninjacators
"Pivot points can be the 'make or break' difference when confirming an entry or an exit. Traders can lean on these to save ticks on losing trades and let winners run just a bit longer." – Ninjacators
A key concept is that once a resistance level is broken, it often becomes a new support level, and vice versa.
Key Features and Customization Options
NinjaTrader's free version includes the standard pivot calculation, while advanced versions offer several variations, such as Classical, Woodie, Fibonacci, Camarilla, and DeMark models, each catering to different trading preferences. For instance:
- Woodie pivots emphasize the opening price, bringing levels closer to current price action.
- Fibonacci pivots integrate retracement levels (like 38.2% and 61.8%) to align with natural market pullbacks.
- Camarilla pivots use specific coefficients around the closing price, making them ideal for short-term scalping or mean reversion.
Customization options let traders tailor their charts by toggling specific levels on or off, adjusting line colors and styles, and choosing session templates like Regular Trading Hours (RTH) or Extended Trading Hours (ETH). Alerts can also be set up to notify traders when a price crosses a pivot level, with options for sound notifications and visual highlights.
Advantages and Limitations
Pivot points provide objective, widely recognized levels that traders can use to set stop-losses and define profit targets. However, because they rely on historical data, they may not adapt quickly to sudden market changes. To address this, traders often combine pivot points with moving averages or volume indicators to confirm market direction.
Best Suited for Specific Trading Strategies
Day traders and scalpers find pivot points particularly useful since they offer fixed levels based on the prior day's data. The central pivot point acts as a directional guide: if the price opens above it, traders might look for long opportunities near support, while prices opening below it may signal short opportunities near resistance.
For range-bound markets, traders can buy near support levels (S1 or S2) and sell near resistance levels (R1 or R2). In breakout scenarios, a price move above resistance - when confirmed - often leads to momentum toward the next pivot level. Futures traders especially value these levels due to the high order volumes that frequently cause consolidation or reversals around them. Additionally, integrating pivot points with NinjaTrader's ATM (Advanced Trade Management) strategies allows for automated stop-loss and profit target placements.
Next, we'll dive into how dynamic support and resistance indicators can further refine your chart analysis.
10. Support and Resistance Dynamic Lines
This indicator stands out from static pivot points by automatically identifying and drawing horizontal support and resistance lines at key swing pivots - areas where the market has historically formed swing highs or lows. It uses an algorithm based on the Hull Moving Average (HMA) to pinpoint these critical price zones.
Primary Function and Use Case
The indicator highlights price zones where the market has previously stalled or reversed, grouping nearby swing points into historically tested levels. For instance, the DynamicSRLines indicator for NinjaTrader 8 has gained popularity among traders for its reliable, automated detection of these levels. Some versions include a "Persistence" feature, which retains significant historical levels, making it useful for backtesting and long-term analysis [79,80]. By automating level detection, this tool keeps charts clean and actionable while building on earlier indicators.
Key Features and Customization Options
Dynamic support and resistance indicators often filter levels based on the current market direction. Users can tweak settings like the lookback period and sensitivity: shorter periods generate more frequent levels for day trading, while longer periods reduce noise for swing trading [83,85]. Some tools divide the range into percentage zones (e.g., 30%, 50%, 70%) to identify mid-range exhaustion or continuation points. Additionally, automated trend labeling using ZigZag logic marks critical market patterns, such as Higher Highs and Lower Lows.
Advantages and Limitations
One major advantage of this indicator is its consistency, as it objectively draws support and resistance lines across various timeframes. However, tools based on ZigZag or pivot logic may "repaint" the most recent levels until a pivot is fully confirmed by subsequent price bars [81,85]. This can cause the latest line to shift, which might confuse traders relying on real-time signals.
Best Suited for Specific Trading Strategies
This tool provides clear visual cues tailored to different trading strategies. Day traders can use it to identify intraday swing pivots where prices have historically bounced, offering precise entry and exit points during fast-moving sessions. Swing traders often apply these lines on daily charts to spot major price barriers where trends might pause or reverse. The option to retain historical levels allows for thorough long-term analysis [79,86]. Scalpers benefit from HMA-based versions, which adjust quickly to price changes, enabling rapid trades off critical levels.
To stay organized, traders can save separate data files for different strategies, such as "NQ_Intraday.srlines" for day trading and "NQ_Daily.srlines" for swing trading. This keeps workspaces tidy and focused. Like other advanced NinjaTrader tools, these dynamic support and resistance lines simplify decision-making and align seamlessly with technical trading strategies.
11. RSI Divergence
Primary Function and Use Case
The RSI Divergence indicator helps traders spot differences between price movements and the Relative Strength Index (RSI), which can hint at potential trend changes or continuations. Regular divergence often signals a reversal - like when the price makes a higher high (or lower low) but the RSI shows a lower high (or higher low). On the other hand, hidden divergence, such as the price forming a higher low while the RSI makes a lower low, suggests the trend may continue.
"Divergence is very common and useful in technical analysis. It indicates possible reversal signals when there are discrepancies between RSI and price movement." – PatternSmart
"Divergence is very common and useful in technical analysis. It indicates possible reversal signals when there are discrepancies between RSI and price movement." – PatternSmart
Key Features and Customization Options
Some advanced versions of the RSI Divergence indicator come with Triple Divergence settings, requiring three consistent discrepancies across short-, mid-, and long-term peaks to confirm a signal. This approach reduces false alerts by verifying patterns across multiple timeframes instead of relying on a single occurrence. Traders can also tweak the N-bar delay for identifying swing points. For instance, a smaller delay (e.g., N=1) delivers quicker signals suited for day trading, while a larger delay (e.g., N=3 or more) provides more precise swing trade setups. Most high-quality indicators include automated alerts and visual aids, like lines connecting price and RSI peaks, to simplify analysis.
Some tools, such as the Karthik Dynamic RSI, adjust overbought and oversold levels dynamically based on market volatility, moving beyond the traditional fixed thresholds of 70/30. However, it’s important to note that certain RSI divergence indicators may not perform accurately on Renko charts due to their unique calculation methods.
Advantages and Limitations
One of the standout benefits of the RSI Divergence indicator is its ability to automatically detect complex divergence patterns. Triple Divergence settings, in particular, generate fewer but more reliable signals compared to standard divergence, which can produce excessive alerts in volatile markets. That said, divergence signals often require a three-bar delay to confirm swing points, meaning they might not capture the exact peak or trough. For optimal results, traders often pair this indicator with other tools, like Volume Profile or market structure zones, to validate high-probability setups.
Best Suited for Specific Trading Strategies
Day traders can make the most of this tool by using lower N-bar swing confirmation settings and focusing on regular divergence to pinpoint intraday reversals at key support and resistance levels. Swing traders, on the other hand, might prefer Triple Divergence settings, which confirm signals across multiple timeframes and are better suited for holding positions over several days. The indicator also integrates seamlessly with NinjaTrader's Market Analyzer. For scalpers, it’s especially useful for fading moves as momentum weakens, particularly when the RSI signals overbought (>70) or oversold (<30) conditions. The next sections will dive into other momentum tools to complement your trading strategy.
12. Stochastic Oscillator
Among the free NinjaTrader indicators, the Stochastic Oscillator stands out as a handy tool for analyzing price momentum.
Primary Function and Use Case
The Stochastic Oscillator evaluates price momentum by comparing a security's closing price to its price range over a set period, typically 14 bars. In an uptrend, prices often close near their highs, while in a downtrend, they close near their lows. The indicator produces values ranging from 0 to 100, where readings above 80 suggest overbought conditions, and those below 20 indicate oversold levels. NinjaTrader offers three variations: Standard Stochastic (which smooths data to reduce noise), Stochastics Fast (providing raw data), and Stochastic RSI (applying the formula to RSI values).
"The momentum or speed of a stock's price movements changes before the price changes direction." – George Lane
"The momentum or speed of a stock's price movements changes before the price changes direction." – George Lane
Key Features and Customization Options
This indicator is made up of two lines: %K, which represents the current value, and %D, a 3-period moving average of %K. The default settings in NinjaTrader use a 14-period lookback, with a K period of 1 or 3 for smoothing and a D period of 3 for the signal line. Advanced versions allow for multi-timeframe analysis, such as overlaying daily data on a 5-minute chart. The Fast version offers more sensitivity but can generate noisier signals, while the Standard version applies smoothing to reduce false alerts. Users can adjust overbought and oversold thresholds to account for market volatility, moving beyond the standard 80/20 levels.
Advantages and Limitations
The Stochastic Oscillator is especially effective in range-bound markets, where prices fluctuate within a defined range. It signals potential reversals through crossovers - when %K crosses above %D, it generates a buy signal, and when it crosses below, it suggests a sell signal. Divergence is another useful feature; for instance, when prices hit a new low but the oscillator forms a higher low, it can indicate a bullish reversal. However, in strong trending markets, the oscillator may stay in overbought or oversold zones for extended periods without signaling a reversal. To minimize false signals in volatile markets, traders often pair it with trend-following indicators, such as 50-period or 200-period moving averages. Combining this oscillator with other tools can significantly refine trading precision.
Best Suited for Specific Trading Strategies
Range traders often look for crossovers in oversold zones (below 20) as buy signals and in overbought zones (above 80) as sell signals. Swing traders may focus on divergence, such as when the price reaches a new high but the oscillator forms a lower high, hinting at a potential reversal. Day traders might prefer the Fast version with shorter periods (e.g., 5) for quick intraday signals but should confirm these signals with additional trend indicators. Aligning stochastic signals with the momentum direction of a higher timeframe can further enhance trade accuracy.
13. Market Structure Zones
The Market Structure Zones indicator refines entry points by incorporating Fibonacci retracement analysis into the concept of support and resistance. It highlights Fibonacci retracement zones that emerge after a confirmed Market Structure Shift (MSS), identifying crucial price levels. This tool tracks wave-like price movements, distinguishing between Phase 1 (trend-driving moves) and Phase 2 (trend-opposing moves). Key areas include Order Blocks, which signal institutional activity, and Fair Value Gaps, which reveal price imbalances through non-overlapping candle wicks.
Primary Function and Use Case
This indicator pinpoints levels where market structure changes occur. A Market Structure Shift may indicate a potential trend reversal, while a Break of Structure suggests the trend is continuing. Unlike static tools like Pivot Points, this indicator adapts across multiple timeframes. For example, traders can analyze structural changes on higher timeframes (such as 1-hour or 4-hour charts) and execute trades on lower timeframes (like 5-minute or 15-minute charts). This flexibility supports a top-down analysis approach. Additionally, it helps traders set stop-loss and profit targets based on structural levels rather than arbitrary price points.
Key Features and Customization Options
- Swing Period Setting: Typically set to 3 or 4, this determines the bar separation for swing points. Higher values reduce market noise by identifying fewer swings, while lower values increase sensitivity.
- Confirmation Options: Traders can select either Bar Close or Bar Wick confirmation.
- Fibonacci Levels: Toggle specific Fibonacci retracement levels (23.6%, 38.2%, 50%, 61.8%, and 76.4%) to identify precise entry points.
- "Until Mitigated" Mode: Advanced versions include an option to stop drawing zones once the price retests or breaks through them, keeping charts clean and organized.
- Tick Replay: For accurate multi-timeframe analysis, enabling Tick Replay in NinjaTrader 8 is recommended.
Advantages and Limitations
This tool is particularly effective during periods of high volatility, such as the US market open and close, as it identifies high-probability entry zones. Combining insights from Market Structure Shifts with Fair Value Gaps can often yield strong entry signals. However, only wider zones with sufficient liquidity should be considered for trading. To maximize its effectiveness, traders should focus on filtering for quality signals, aiming for one or two strong trades per day rather than chasing every opportunity.
Best Suited for Specific Trading Strategies
For day traders, a common approach is entering trades when the price revisits the 50% retracement level within a wide zone. Stops are placed at the 100% level, with profit targets set at the breakout point. Swing traders, on the other hand, can leverage the multi-timeframe feature to identify significant structure shifts on higher timeframes while using lower timeframes for precise entries. In both cases, aligning trades with broader market momentum ensures they follow the prevailing market structure. This indicator complements other tools by offering detailed structural insights for both intraday and swing trading strategies.
14. Fibonacci Retracement Tools
Fibonacci retracement tools are a standout feature among the free NinjaTrader indicators. These tools help traders identify potential pullback zones by measuring how much of a prior move is retraced using specific ratios - 23.6%, 38.2%, 50%, and 61.8%. These levels, based on the golden ratio, assist traders in predicting where prices might pause or reverse, enabling precise entry points and profit target settings.
Primary Function and Use Case
Fibonacci retracement tools are particularly useful in trending markets. They provide a mathematical framework for analyzing pullbacks, complementing other trend indicators. Traders apply these tools by drawing Fibonacci levels from a swing high to a swing low (or vice versa) to determine potential reversal or consolidation zones. Additionally, Fibonacci extensions project potential take-profit levels, such as 100% or 161.8%, beyond the initial move once retracement is complete.
For those seeking automation, tools like "Auto Fibonacci" identify key swing points and update levels in real time. A popular example is the Fibonacci Cluster indicator, which has been downloaded over 3,459 times from the NinjaTrader Ecosystem.
Key Features and Customization Options
NinjaTrader's standard Fibonacci tool, accessible via F8, allows users to customize ratios by adding or removing levels like 78.6% for XABCD patterns. Traders can also adjust line extensions, text placement, and colors for better chart visibility. Some advanced tools come with alert systems that notify traders when specific Fibonacci levels are reached, supporting real-time decision-making.
For automated tools, users can tweak parameters like "deviation" or "sensitivity" to suit their trading style. For example, higher sensitivity works well for scalping, while lower sensitivity is better for swing trading. To streamline workflows, customized settings can be saved as default templates, eliminating the need for repeated reconfiguration.
Advantages and Limitations
Fibonacci retracement tools are versatile, working effectively across all timeframes - from 1-minute charts for scalping to daily charts for swing trading. When combined with other indicators like RSI, MACD, or Volume Profile, they provide stronger confirmation for trade signals. However, more complex tools like the Fibonacci Cluster may demand higher CPU resources, which could affect performance on older systems. To maintain clarity during volatile market conditions, it’s a good practice to draw retracement levels slightly offset from the candles.
While these tools are powerful, they work best as part of a broader strategy rather than as a standalone method. Their precision enhances trade timing, especially when used alongside other advanced charting tools.
Best Suited for Specific Trading Strategies
Fibonacci retracement tools cater to both intraday and swing trading strategies. Day traders often rely on these tools to estimate how far an intraday rally might pull back before continuing its trend. Common entry points include the 38.2% or 50% retracement levels, with stop-loss orders placed just beyond the 61.8% level. Swing traders, on the other hand, use Fibonacci levels to identify key recovery zones and long-term support or resistance areas on daily or weekly charts.
In both cases, Fibonacci extensions are invaluable for setting take-profit targets. For instance, once a retracement completes and the trend resumes, the 161.8% extension level often serves as a logical point to secure profits.
STOP LOSING TO LATENCY
Execute faster than
your competition.
Sub-millisecond execution • Direct exchange connectivity • From $59.99/mo
15. Market Statistic Indicator
The Market Statistic Indicator uses historical data to provide a clear statistical overview of market activity. Instead of reacting to short-term price fluctuations, it incorporates measurable data - like probability forecasts, distribution charts, and volatility levels - right onto the price chart. This helps traders base their strategies on typical market behavior rather than relying on speculation.
Primary Function and Use Case
The indicator’s main role is to calculate metrics such as the Average Daily Range (ADR), which reveals how far an asset typically moves in a single day. This information helps traders assess whether a current price move is nearing its limit or still has room to grow. The NinjaTrader 8 version, called MarketInfo, consolidates essential details - such as price, net change, percentage change, and session volume - into one easy-to-read panel on the chart. It also monitors volatility and price movement across major global sessions, offering insights into the best times to trade. These features enable more informed decisions, aligning trading strategies with precise market data.
"The indicator provides data-driven insights rather than relying solely on technical chart patterns. This enhances decision-making by reducing emotional trading and anchoring strategies to quantifiable statistics." - The Forex Geek
"The indicator provides data-driven insights rather than relying solely on technical chart patterns. This enhances decision-making by reducing emotional trading and anchoring strategies to quantifiable statistics." - The Forex Geek
Key Features and Customization Options
MarketInfo offers a range of customization options. Traders can choose which fields to display, such as Last Price, Daily Open/High/Low, Volume, and Daily Range. Adjustable settings include the ATR Period and Average Range Lookback, which is usually set to 34 bars or days by default. Visual options allow users to tweak colors for positive, negative, and neutral values, change text size, and switch between expanded and minimized views. The indicator also includes Average True Range (ATR) calculations, which translate volatility into dollar values based on the contract multiplier.
Advantages and Limitations
This indicator works across all timeframes and asset classes, making it ideal for both day and swing trading. It helps traders place stops and targets with precision by factoring in true market volatility. However, its reliance on historical data means that sudden news events can disrupt its statistical projections. Additionally, the indicator requires at least two daily bars of historical data to function; without this, fields like range and ATR will display "---".
Best Suited for Specific Trading Strategies
Day traders can leverage session-specific data and real-time volatility tracking. For instance, if a market has already reached 90–100% of its Average Daily Range, it’s statistically unlikely to move much further, signaling traders to tighten stops or consider taking profits. Swing traders, on the other hand, can use the indicator to pinpoint high-volume nodes and liquidity zones, which often serve as key support and resistance levels for longer-term trades. To maximize its effectiveness, traders should combine the Market Statistic Indicator with support/resistance analysis and trend filters to confirm statistical probabilities with actual price movements. Available for free through the NinjaTrader User App Share, this tool integrates seamlessly with other NinjaTrader resources, adding a solid data-driven foundation to chart analysis.
16. Risk/Reward Advanced Indicator
Here’s a tool designed to simplify risk management directly on your trading charts.
Primary Function and Use Case
The Risk/Reward Advanced Indicator helps traders map out entry points, stop-losses, and up to three profit targets using horizontal lines on their charts. This eliminates the need for quick mental calculations by instantly displaying the risk/reward ratio, potential profit/loss, and unrealized P/L as prices move. This preview feature lets traders decide if a setup is worth pursuing before committing their funds.
As one trader, Adrian Hickson, a NQ Scalper, put it:
"The 2-click drawing feels sooo natural. First click sets the anchor, second click finishes the ladder, and instantly I see ticks + $ value + 1R/2R/3R."
"The 2-click drawing feels sooo natural. First click sets the anchor, second click finishes the ladder, and instantly I see ticks + $ value + 1R/2R/3R."
Additionally, the indicator includes contract sizing tools, which calculate the number of contracts to trade based on a set risk percentage relative to account size. This makes it easy to plan trades efficiently, with more advanced customization options detailed below.
Key Features and Customization Options
The advanced version of the indicator offers up to six customizable extension levels (e.g., 2R through 6R), helping traders plan how to scale out of positions at specific profit milestones. It can display values in various formats - price, currency, percentage, ticks, or pips - making it adaptable for futures, forex, and equity markets. The tool also provides real-time updates on per-tick P/L, showing how price changes impact the trade.
Customization options include adjustable colors, line opacity, text size, and fonts. Traders can save frequently used risk/reward setups as default templates, streamlining their workflow during busy trading sessions. These features make the indicator flexible enough to suit different trading styles.
Advantages and Limitations
The indicator has earned a 4.9/5 rating for its intuitive two-click system and smooth performance. One user remarked, "I take fewer bad trades now because I can instantly see when the ratio isn't in my favor".
However, it’s important to note that this tool is strictly for planning purposes - it does not place or manage orders with a broker. Some users who prefer a simpler setup might find the range of customization options a bit overwhelming.
Best Suited for Specific Trading Strategies
Day traders and scalpers benefit from the fast two-click system, which quickly displays ticks, dollar values, and R-multiples. Swing traders can use the multi-target extensions to plan partial exits, often scaling out 60–80% of a position at a 1:1 risk/reward ratio, while managing the remainder for higher returns at 2R or 3R levels.
The indicator is available as a free resource on the NinjaTrader Ecosystem, originally developed by bassam/NinjaTrader_Jim. It’s also included in the MAS Capital Free Indicators Pack, though it requires Machine ID activation. For those seeking additional features, enhanced paid versions with lifetime updates and 24/7 support cost approximately $89 per year or $169 for a lifetime license.
17. Advanced Volume Analysis Indicator
Primary Function and Use Case
The Advanced Volume Analysis Indicator shifts the focus from traditional time-based volume bars to volume distribution across price levels. It uses horizontal volume profiles to highlight critical areas like the Point of Control (POC), Value Area High (VAH), and Value Area Low (VAL). This approach provides deeper insights into market ranges and potential breakout zones. The indicator works seamlessly across all timeframes, including Renko bars, and doesn’t require a NinjaTrader Lifetime license or Order Flow data. For accurate volume calculations, enabling Tick Replay is recommended.
Key Features and Customization Options
This tool goes beyond standard volume profiles by offering dynamic clustering and greater user control. One standout feature is the Auto Merge function, which automatically combines overlapping volume profiles, simplifying the identification of market ranges and breakout zones. Users can also manually merge or split clusters with a single click.
Customization options include adjusting the Value Area percentage (default is set at 68%), modifying profile opacity and colors, and selecting the profile's alignment on the chart. For high-volume instruments like Nasdaq (NQ), the "Ticks Per Level" parameter helps aggregate price levels, resulting in a cleaner and more readable chart.
Advantages and Limitations
This indicator is particularly effective at confirming support and resistance zones by showing trading activity at specific price levels [37, 124]. For day traders, it enhances strategies like the opening range breakout by using volume profiles calculated from 1:00 AM to 9:00 AM EST to identify potential breakout opportunities. Scalpers can leverage the interplay between value area bounds, the POC, and candle open/close prices for quick entry points. Swing traders benefit from the Auto Merge feature, which outlines balanced price ranges. Breakouts from these ranges often signal new trends, with prices above the VAH pointing to bullish momentum and those below the VAL suggesting bearish conditions [37, 39].
For volatile instruments, adjusting the "Min Refresh Rate" can help prevent chart lag, ensuring smoother performance.
The indicator is available as a free download from providers like automated-trading.ch, though creating a free account is required to obtain a license key. Its flexibility and advanced features make it a valuable tool for traders across various strategies and styles.
18. Trend Filter Indicator
Primary Function and Use Case
The Trend Filter Indicator helps traders cut through the noise of minor price fluctuations, focusing on the dominant market trend. Tools like the Twin Range Filter and Kalman Trend rely on smoothing techniques - using dual-range or Kalman filters - to highlight significant price movements. This indicator identifies strong directional price moves and provides visual signals, such as colored candles and directional arrows, to indicate potential long or short opportunities. By filtering out market noise and clearly showing the main trend direction, it complements other tools like Volume Profile and RSI, keeping traders aligned with the broader market trend.
Key Features and Customization Options
The Kalman Trend indicator uses two filters: a Short Kalman filter (default length 15) for detecting quick movements and a Long Kalman filter (default length 30) for smoothing out noise. It visually highlights trends with colored candles - LimeGreen for bullish trends and Red for bearish - and marks potential breakout zones with "Trend Shift Boxes" based on ATR. Meanwhile, the Twin Range Filter employs adaptive volatility filtering, creating a dynamic filter line that adjusts to market conditions to minimize false signals. Both tools confirm trend strength by counting consecutive directional bars before signaling. Traders can customize settings like trend line visibility, range sensitivity multipliers, and noise parameters to adapt to different market environments. These features make the indicator an excellent companion to other charting tools, helping to refine entry and exit points.
Advantages and Limitations
Trend filters like these are particularly effective at reducing false signals in choppy or sideways markets, a common challenge for day traders. Using higher timeframes further enhances signal reliability and reduces the risk of whipsaw. However, as with any trend-following tool, these indicators are most effective when paired with confirmation tools. Combining them with Volume Profile, RSI, or support/resistance zones can validate signals and ensure market participation is genuine. Both the Kalman Trend and Twin Range Filter are available for free through the NinjaTrader Ecosystem.
Best Suited for Specific Trading Strategies
The Trend Filter Indicator is tailored for intraday futures trading, helping traders establish a clear directional bias and avoid low-conviction trades. Day traders can rely on it to steer clear of uncertain market phases, while scalpers benefit from shorter periods and higher sensitivity settings to capture quick momentum shifts in high ATR markets. For swing traders, longer periods with increased smoothing help maintain alignment with the overarching trend over several days. Pairing the indicator with execution tools like pivot points or dynamic support/resistance lines ensures precise entry and exit timing.
19. BetterBarTimer
Primary Function and Use Case
The BetterBarTimer, sometimes called the Bar Timer Hybrid or advanced Bar Status indicator, delivers a real-time countdown showing when the current price bar will close. It works across various chart types - Time, Tick, Volume, and Range - by combining time left, tick count, and volume into a single display. The tool automatically detects the chart type and adjusts its functionality, making it a go-to for traders who depend on precise candle closures. A standout feature places the countdown directly on the price axis, right next to the current market price, which helps traders stay focused during fast-moving markets.
Key Features and Customization Options
This indicator comes with a range of customization options to suit different trading styles. You can choose to display the countdown as a numeric value or a percentage and reposition it to eight different locations on your chart using keyboard shortcuts. It also offers alert systems, including flashing panels, gradient color changes, and sound notifications, to signal when a bar is about to close. For traders tracking global markets, the Alternative Clock feature allows simultaneous display of multiple time zones, such as EST or Sydney. Other customization options include text outlines for better visibility and separate color settings for the clock and counter. The original BarTimerFlashFusion version has exceeded 5,000 downloads, while the Bartimercounter variant has been downloaded 7,455 times [132, 134].
Advantages and Limitations
The BetterBarTimer is excellent for providing precise timing, especially for scalpers who need to enter or exit trades with precision. On volume or tick charts, it shows how quickly a bar is being filled, which can help identify sudden momentum shifts. Sound alerts enable traders to monitor multiple screens without missing key moments. However, its performance depends on your computer clock being synced with internet time - any lag between your PC and the exchange can impact accuracy. Additionally, some versions may not work correctly with certain bar types, like Renko or Line Break. For tick or volume counters to function properly, the indicator must run on "Each Tick" rather than "On Bar Close".
Best Suited for Specific Trading Strategies
The BetterBarTimer is ideal for traders who need precise candle timing. Scalpers can use it to avoid entering trades too late by timing their actions at the start of a new candle. Day traders benefit from its ability to track momentum on volume charts, such as when a fast bar notification signals that a volume bar has completed in just 2% of its average duration. Swing traders might find the alternative clock feature useful for monitoring overnight sessions and global market openings. This indicator is available for free through the NinjaTrader Ecosystem.
Next, discover the final free indicator to round out your advanced charting toolkit.
20. SymbolWatermark
Primary Function and Use Case
The SymbolWatermark indicator adds a subtle background watermark displaying the instrument symbol directly on your trading chart. For futures contracts, it also shows the contract's expiry date. This feature makes it easy to identify the asset you're analyzing while keeping your workspace uncluttered. Since the watermark sits behind the chart bars, it’s especially handy for traders juggling multiple monitors or charts at once.
Key Features and Customization Options
You can fine-tune the watermark’s appearance to suit your preferences. Adjust settings like opacity, font size, weight, and color to match your chart’s design. The watermark can be anchored to the center or specific corners of the chart, and it supports multi-panel setups, allowing you to apply multiple instances to different input series. Some versions even let you add custom text or display the current chart timeframe. For example, the version by NinjaTrader_ChelseaB has been downloaded 2,517 times, while tickets2themoon's version has 1,898 downloads.
Advantages and Limitations
This tool keeps your charts organized and informative without disrupting critical details like price action or technical indicators. For clear visibility, setting the opacity between 0.1 and 0.2 ensures the watermark doesn’t obscure important elements like candle wicks or volume bars. However, if you’re working with multi-panel charts, you’ll need to apply separate instances to each panel manually. Additionally, older versions released before August 2021 may have issues with multi-panel displays and opacity adjustments.
Best Suited for Specific Trading Strategies
The SymbolWatermark is ideal for traders managing multiple instruments at once. Day traders, for example, can use the custom text feature to label charts with strategy names - like “Scalping” or “Trend Following” - to stay organized during fast-paced sessions. Futures traders benefit from the expiry date display, which helps prevent mix-ups between contract months. You can download the SymbolWatermark for free through the NinjaTrader Ecosystem.
Comparison Table
Here's a handy guide to align different indicators with your trading approach.
| Indicator | Category | Primary Use Case | Key Features | Recommended Strategy |
|---|---|---|---|---|
| SuperTrend | Trend | Identifying trend direction and reversals | ATR-based calculations; clear buy/sell signals | Trend-following; trailing stops |
| EMA Crossover | Trend | Timing entries and exits | Interaction between two moving averages | Momentum trading; trend confirmation |
| Multi Time Frame Trend Line | Price Action | Gaining a broader market perspective | Displays higher timeframe trend lines on lower charts | Multi-timeframe analysis |
| MACD | Momentum | Detecting momentum shifts | Histogram and signal line crossovers | Trend reversals and continuation setups |
| Volume Profile | Volume | Identifying support/resistance zones | POC, Value Area, and liquidity nodes | Order flow analysis; scalping |
| VWAP | Volume/Price | Determining intraday fair value | Volume-weighted average price | Day trading; mean reversion strategies |
| ADX | Trend Strength | Filtering trends by strength | 0–100 scale indicating trend strength | Avoiding weak or directionless markets |
| RSI | Momentum | Spotting overbought/oversold conditions | 70/30 threshold levels | Mean reversion; divergence trading |
| Pivot Points | Support/Resistance | Daily key price levels | Automatically plots S1–S3 and R1–R3 levels | Intraday breakouts; range trading |
| Support and Resistance Dynamic Lines | Support/Resistance | Highlighting supply and demand zones | Zones change color when touched | Price action; SMC trading |
| RSI Divergence | Momentum | Anticipating reversals | Identifies discrepancies between price and RSI | Counter-trend entries |
| Stochastic Oscillator | Momentum | Pinpointing short-term reversals | %K and %D line crossovers | Range-bound markets; scalping setups |
| Market Structure Zones | Price Action | Applying Smart Money Concepts | BOS, ChoCh, and Order Blocks | SMC and institutional trading strategies |
| Fibonacci Retracement | Support/Resistance | Analyzing pullbacks | Key ratio levels like 50% and 61.8% | Trend resumption opportunities |
| Market Statistic | Volatility | Measuring market volatility | Analyzes bar speed and tick activity | Stop-loss placement; position sizing |
| Risk/Reward Advanced | Utility | Planning trades effectively | Custom stops, targets, and trailing settings | Ensuring trades meet a minimum 2:1 R/R ratio |
| Advanced Volume Analysis | Volume | Understanding order flow | Highlights bid/ask imbalances and delta signals | Footprint trading; confirmation setups |
| Trend Filter | Trend | Reducing market noise | Displays trailing stop dots | Systematic trading; identifying trend changes |
| BetterBarTimer | Utility | Improving execution timing | Displays time remaining for the current bar | Precision entries at bar close |
| SymbolWatermark | Utility | Organizing charts effectively | Displays background symbol on the chart | Managing multiple charts efficiently |
This table is your quick reference to match indicators with your trading preferences.
"Indicators are essential because they assist traders in making well-informed decisions... they remove the noise from raw price data".
"Indicators are essential because they assist traders in making well-informed decisions... they remove the noise from raw price data".
Conclusion
These free NinjaTrader indicators are designed to fine-tune your charting setup, giving you the tools to trade with greater precision and efficiency. With these 20 free indicators, you gain professional-level charting capabilities without dipping into your trading capital. The platform itself remains free for advanced charting, strategy backtesting, and trade simulation, allowing you to save your funds for live trades. Each indicator brings insights into trends, momentum changes, and volatility patterns that raw price data alone might not reveal.
The key to success lies in combining a few carefully chosen indicators. For instance, you might pair a trend-following tool like SuperTrend with a momentum oscillator such as RSI, and then confirm your analysis with a volume-based indicator like VWAP. This layered approach creates "confluence", where multiple signals align to strengthen your trading decisions. Consistency in applying these signals is essential for refining your strategy.
"A symphony composed of indicators, astute risk management, and a meticulously devised trading blueprint defines the journey toward consistent triumph".
"A symphony composed of indicators, astute risk management, and a meticulously devised trading blueprint defines the journey toward consistent triumph".
Before diving into live trading, take the time to backtest your indicator setups in a demo account. This allows you to refine your configuration and ensure it aligns with your trading style. Keep in mind that market conditions are always shifting - tools that work well in trending markets may give false signals during periods of consolidation or choppiness. Start with one or two indicators, and expand your setup as you gain confidence from your results.
These indicators are just tools; their true power lies in how you integrate them into a broader strategy. Combine them with disciplined risk management and clear execution rules. Experiment with different setups, tweak parameters based on market volatility, and aim for a configuration that supports your strategy without overwhelming your decision-making process.
FAQs
Which 3 indicators should I start with?
For those just starting out with advanced charting in NinjaTrader, it's smart to begin with tools like Moving Averages, Relative Strength Index (RSI), and Bollinger Bands. Here's why:
- Moving Averages: These are great for spotting trends, making it easier to align your trading strategies with the market's direction.
- RSI: This tool helps you identify when a market might be overbought or oversold, giving you better timing for entries and exits.
- Bollinger Bands: Perfect for visualizing market volatility and spotting potential reversals.
These tools are popular for a reason - they're simple to use, effective, and come free with NinjaTrader. They also provide a solid starting point for diving into technical analysis.
How do I install these indicators in NinjaTrader 8?
To add free indicators in NinjaTrader 8, start by downloading the indicator file, usually in a .zip format, and remember where you saved it. Open NinjaTrader 8 and navigate to Tools > Import > NinjaScript Add-On. Select the .zip file you downloaded. After the import is complete, right-click on your chart, select Indicators, and find the newly added indicator in the list. A confirmation message will appear once the import is successful.
How can I backtest these indicators safely in simulation?
To test these indicators effectively, utilize NinjaTrader’s Strategy Analyzer for visual backtesting with historical data. Adjust settings such as time zone and chart configurations to ensure precise results. For smoother performance, you might want to conduct backtests on a trading VPS, which helps minimize latency. To take things a step further, advanced methods like walk-forward testing and Monte Carlo simulations can help you assess and confirm the reliability of your strategies before transitioning to live trading.
For those just starting out with advanced charting in NinjaTrader, it's smart to begin with tools like Moving Averages, Relative Strength Index (RSI), and Bollinger Bands. Here's why:
- Moving Averages: These are great for spotting trends, making it easier to align your trading strategies with the market's direction.
- RSI: This tool helps you identify when a market might be overbought or oversold, giving you better timing for entries and exits.
- Bollinger Bands: Perfect for visualizing market volatility and spotting potential reversals.
These tools are popular for a reason - they're simple to use, effective, and come free with NinjaTrader. They also provide a solid starting point for diving into technical analysis.
To add free indicators in NinjaTrader 8, start by downloading the indicator file, usually in a .zip format, and remember where you saved it. Open NinjaTrader 8 and navigate to Tools > Import > NinjaScript Add-On. Select the .zip file you downloaded. After the import is complete, right-click on your chart, select Indicators, and find the newly added indicator in the list. A confirmation message will appear once the import is successful.
To test these indicators effectively, utilize NinjaTrader’s Strategy Analyzer for visual backtesting with historical data. Adjust settings such as time zone and chart configurations to ensure precise results. For smoother performance, you might want to conduct backtests on a trading VPS, which helps minimize latency. To take things a step further, advanced methods like walk-forward testing and Monte Carlo simulations can help you assess and confirm the reliability of your strategies before transitioning to live trading.
"}}]}


