
Backtesting is a critical step in developing trading strategies, allowing you to test ideas using historical data before risking real money. Python stands out as the go-to language for this, offering powerful libraries tailored for traders of all levels. Here’s a quick rundown of the 10 best Python backtesting libraries:
- Backtesting.py: Simple setup, interactive visualizations, and built-in metrics like Sharpe ratio and drawdown.
- Backtrader: Highly detailed simulations with support for broker integration and multiple assets.
- PyAlgoTrade: Event-driven, supports various data sources like Yahoo Finance and Quandl.
- bt: Focused on portfolio strategies and rebalancing with modular, reusable components.
- Zipline: Integrates with Pandas and machine learning tools, ideal for transitioning to live trading.
- QSTrader: Event-driven design for backtesting and live trading with modular customization.
- pysystemtrade: Designed for systematic futures trading with robust backtesting and live execution.
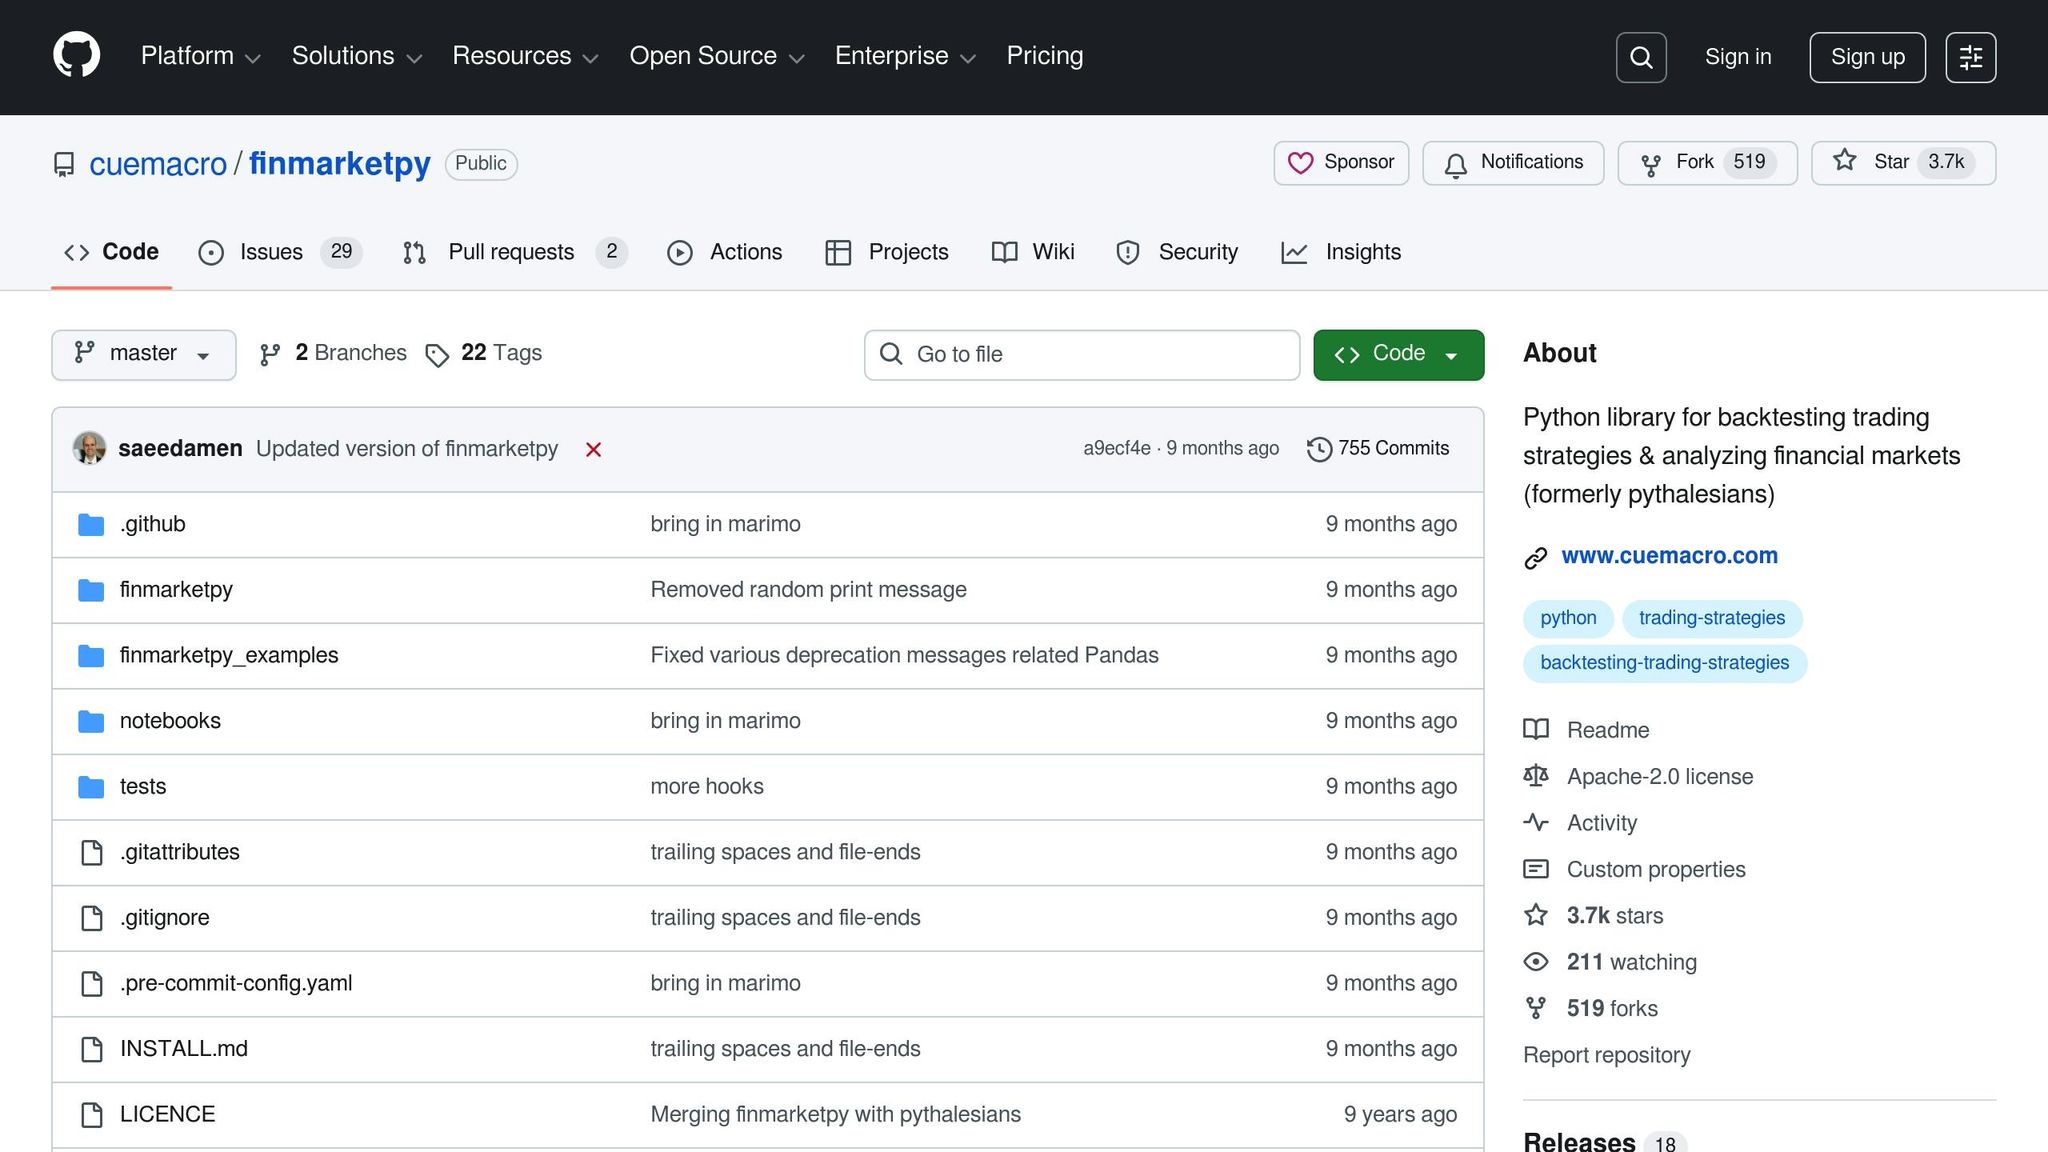
- Finmarketpy: Offers templating for backtests and integrates with providers like Bloomberg and Quandl.
- Fastquant: Beginner-friendly, supports quick strategy testing with minimal coding.
- QuantConnect: Built on the LEAN engine, combines backtesting with live trading capabilities.
These libraries cater to different needs - from simple strategy testing to advanced portfolio management and live trading. Backtesting.py and Fastquant are great for beginners, while Backtrader and Zipline offer advanced features for experienced users. For systematic traders, pysystemtrade is a solid choice.
Quick Comparison
| Library | Best For | Key Features | Data Sources |
|---|---|---|---|
| Backtesting.py | Beginners, quick setup | Easy-to-use, interactive charts, built-in metrics | CSV, Pandas DataFrames |
| Backtrader | Advanced simulations | Broker integration, multiple assets | CSV, Pandas, live feeds |
| PyAlgoTrade | Event-driven testing | Supports Yahoo Finance, Google Finance | CSV, Quandl, Bitstamp |
| bt | Portfolio strategies | Modular design, rebalancing | Pandas DataFrames |
| Zipline | Machine learning integration | Pandas-based, live trading transition | Built-in bundles, custom loaders |
| QSTrader | Modular customization | Event-driven, live trading | CSV, databases |
| pysystemtrade | Systematic futures trading | Futures-focused, live execution | CSV, MongoDB, IB data |
| Finmarketpy | Market analysis | Templating, volatility targeting | Bloomberg, Quandl, Yahoo |
| Fastquant | Quick prototyping | Minimal coding, built-in strategies | Yahoo Finance, Binance |
| QuantConnect | Backtesting to live trading | LEAN engine, seamless transitions | Built-in providers |
Each library offers distinct strengths, so your choice will depend on your trading goals, data needs, and coding experience.
Backtesting.py - Full course in python
1. Backtesting.py
Backtesting.py is a Python library designed to simplify the process of testing trading strategies. Its standout feature is its ease of use - you can get a strategy running with just a few lines of code. It uses an object-oriented approach, allowing you to define custom trading logic by creating your own strategy class. This makes it approachable, even for those new to algorithmic trading.
The library handles trade simulation, calculates performance metrics, and provides interactive visualizations. Key performance indicators like Sharpe ratio, maximum drawdown, and win rate are automatically calculated, saving you the hassle of manual coding. The built-in visualization tools generate HTML reports featuring candlestick charts, equity curves, and trade markers, helping you quickly analyze your strategy's strengths and weaknesses.
Its event-driven design processes data one bar at a time, avoiding look-ahead bias - a common mistake where future data is unintentionally used in simulations. The framework supports both long and short positions, stop-loss and take-profit orders, and dynamic position sizing based on your portfolio's equity.
Support for Multiple Data Sources and Formats
Data handling is a critical part of backtesting, and Backtesting.py integrates seamlessly with Pandas DataFrames. You can feed it OHLC data (optionally including 'Volume') with a datetime index from sources like CSV files, databases, or APIs. This allows you to test strategies across various markets - stocks, forex, cryptocurrencies, or commodities - without needing to adjust your code structure. However, you'll need to ensure your data is cleaned and prepped beforehand.
Portfolio and Strategy Customization Options
Customizing your strategy is straightforward. You can override the init() method to set up indicators and use the next() method for defining trade logic. This flexibility allows you to implement complex conditions, analyze multiple timeframes, and adjust position sizes dynamically, all while keeping your code clean and readable.
The library supports fractional position sizing, enabling you to allocate specific percentages of your portfolio to individual trades instead of using fixed quantities. You can also configure commission rates, slippage, and margin requirements, making your backtests more realistic. Additionally, you can access the full trade history and portfolio state at any time, which is particularly useful for creating adaptive strategies that respond to recent performance.
To refine your strategies, you can perform parameter sweeps using the library's optimization tools. These tools also allow you to add custom metrics. However, it's important to avoid overfitting - tuning your strategy to work perfectly on historical data may lead to poor performance in live trading.
Community Support and Documentation Quality
Backtesting.py's documentation is thorough, offering clear examples and detailed explanations of its functions and classes. Each parameter and return value is well-documented, making it easier to understand the library's inner workings.
Although the community is smaller compared to older backtesting tools, the support quality is excellent. Questions on the library's GitHub issues page often receive responses from the maintainer and experienced users, complete with practical advice and code samples.
The learning curve is manageable, especially if you're already familiar with Python. Most users can set up and test their first strategy within an hour or two of reading the documentation. The GitHub repository also includes example strategies, such as moving average crossovers, mean reversion, and breakout systems, giving you a solid foundation to build and customize your own ideas.
2. Backtrader
Backtrader is a powerful Python framework designed for backtesting and simulating trading strategies. It stands out for its ability to model market conditions with remarkable detail, going beyond basic trade execution to include realistic simulations of brokers, order handling, slippage, and other market frictions. This makes it an excellent choice for traders who want precise control over their backtesting process.
The framework operates on an event-driven architecture, which processes market data sequentially. This approach ensures that strategies behave in a way that closely mirrors live market conditions. Backtrader also supports testing across multiple assets: whether you're working with various assets or different timeframes, it can handle the complexity of analyzing diverse instruments simultaneously.
It offers support for a wide range of order types, including stop, limit, bracket, and OCO (One-Cancels-the-Other) orders. as This level of detail allows users to simulate trade execution with accuracy. Additionally, Backtrader incorporates essential financial factors such as cash management, margin requirements, commissions, sl: slippage, and corporate actions like stock splits and dividends. For those looking to transition from testing to live trading, the framework makes the process seamless.
Live Trading or Paper Trading Capabilities
One of Backtrader's strengths is its smooth transition from backtesting to live or paper trading. It integrates directly with brokers like Interactive Brokers and Oanda, enabling users to move from simulations to real-world execution with minimal adjustments to their code. This ensures strategies that perform well during backtesting can maintain their integrity when deployed with real capital or in a paper trading environment.
Run 24/7 while you sleep. Keep bots, platforms, and trade copiers online on a dedicated VPS.
Low-latency VPS hosting for your trading platform.
From $59.99/mo
Portfolio and Strategy Customization Options
Backtrader excels in customization, offering a variety of built-in and custom technical indicators for strategy development. This flexibility allows traders to create complex strategies with multiple conditions, tailored position-sizing rules, and robust risk management parameters. Whether you're using fixed quantities, percentage-based allocations, or dynamic sizing based on volatility, Backtrader keeps track of your portfolio in real time during backtests. It provides immediate insights into your holdings, available cash, and unrealized profits, making it an adaptable tool for a wide range of trading strategies.
Community Support and Documentation Quality
Backtrader is well-documented, with comprehensive guides that cover everything from basic setup to advanced features. For those new to backtesting, these resources make it an excellent starting point. The library also enjoys strong community support, with active forums and blogs offering troubleshooting help and feedback. While project development has slowed since 2020, its extensive feature set and dedicated user base ensure it remains a trusted option for traders seeking realistic simulations and effective strategy testing.
3. PyAlgoTrade
PyAlgoTrade is a Python library designed for backtesting systematic trading strategies. It uses an event-driven architecture, making it a solid choice for testing strategies across different asset classes and timeframes. Its main goal is to simplify the process of evaluating strategies by offering a range of practical features. Let’s dive into its data integration and customization capabilities.
Support for Multiple Data Sources and Formats
This library stands out for its ability to work with various data sources, including Yahoo! Finance, Google Finance, NinjaTrader, and Quandl. It can handle CSV-based time-series data as well as Bitcoin data from Bitstamp. Additionally, it offers real-time Twitter event handling and integrates with Pandas, making it more adaptable for diverse data workflows.
Portfolio and Strategy Customization Options
PyAlgoTrade supports multiple order types such as Market, Limit, Stop, and StopLimit, allowing strategies to respond dynamically to market conditions. It also integrates with TA-Lib for technical indicators, providing a range of tools for technical analysis. However, it's worth noting that it may lack full support for Pandas objects in some scenarios, which could be a limitation for certain users.
Community Support and Documentation Quality
One of PyAlgoTrade's strong points is its detailed documentation. It provides step-by-step guidance to help users troubleshoot issues and fine-tune their backtests. While it may not lean heavily on community-driven support, its well-organized official resources make it a good fit for those who prefer structured and thorough instructions.
4. bt (Backtesting for Python)
bt is a Python-based framework designed for portfolio-focused systematic trading strategies. It efficiently handles multiple assets and portfolio rebalancing, making it a powerful tool for traders. Built on top of the ffn financial function library, it operates under the MIT license, offering developers both flexibility and accessibility.
What makes bt stand out is its modular design, which encourages the creation of reusable and easily testable strategy components. As Frank Smietana, a contributor at QuantStart, explains:
"bt 'aims to foster the creation of easily testable, re-usable and flexible blocks of strategy logic to facilitate the rapid development of complex trading strategies'".
Unlike tools that focus solely on individual trade signals, bt prioritizes systematic portfolio management and rebalancing. This modular approach enables users to quickly customize and refine strategies.
Portfolio and Strategy Customization Options
One of bt's key features is how effortlessly it allows you to tweak strategies. For example, adjusting time frequencies or rebalancing asset weights can be done with just a few lines of code. This makes it easy to experiment with different configurations without overhauling your entire codebase.
By combining straightforward, testable components, you can build intricate strategies while maintaining clarity. This approach simplifies debugging and helps pinpoint which elements are performing well in your portfolio management setup.
Community Support and Documentation
bt also shines in its support resources. Its documentation is detailed and user-friendly, offering a step-by-step guide to help users - whether newcomers or seasoned traders - grasp the basics of building and testing strategies. The well-organized structure ensures that even those new to systematic trading or Python-based backtesting can get started with ease.
To further support users, the pythonfortraders/awesome-python-algo-trading GitHub repository included "bt examples" and a "bt backtest template" in its "Strategy Codebases" and "Starter Projects" sections as of May 2025. These examples provide practical insights for both beginners and advanced users, making implementation more approachable.
The modular nature of bt also enhances understanding. Since strategies are built from individual, reusable components, you can analyze each piece separately to see how it impacts the overall backtest results. This transparency is invaluable for refining and optimizing your trading strategies.
5. Zipline
Zipline is a versatile platform designed for strategy development, backtesting, and transitioning into both paper and live trading environments. One of its standout features is its smooth integration with Pandas and machine learning libraries like scikit-learn, making it a powerful tool for creating and testing trading strategies driven by machine learning.
Support for Multiple Data Sources and Formats
Zipline makes working with data straightforward by supporting a variety of inputs. You can utilize its built-in minute-resolution historical US stock data or import your own data from CSV files, APIs, or databases. With Pandas at its core, the process of handling and analyzing data becomes efficient and user-friendly.
Live Trading and Paper Trading Capabilities
Switching between backtesting, paper trading, and live trading is seamless with Zipline. You can use it as a standalone backtesting tool or as part of a broader strategy development setup. Its browser-based IPython Notebook interface keeps everything organized and accessible, streamlining your workflow.
Portfolio and Strategy Customization Options
Zipline provides pre-built algorithms and modular components, giving you the flexibility to create strategies tailored to your needs. With Pandas’ powerful data manipulation tools, you can filter securities, calculate custom indicators, or transform data to match your specific trading requirements. This flexibility means you don’t have to build everything from scratch - you can craft strategies that align perfectly with your goals while leveraging machine learning libraries for added sophistication.
6. QSTrader
QSTrader operates on an event-driven architecture, making it well-suited for both backtesting and live trading. This setup allows you to test strategies with historical data and transition to live trading without interruptions. By processing market data, signals, and orders as they happen, it creates a trading environment that closely resembles real-world conditions. Let’s dive into its key features.
Support for Multiple Data Sources and Formats
QSTrader is equipped to handle OHLCV bar data and tick data across various timeframes. Its modular structure makes it possible to integrate virtually any data source, giving you the flexibility to work with diverse formats.
Portfolio and Strategy Customization Options
With QSTrader's modular design, you have full control over how you customize your trading strategies. You can adjust components like data handling and order execution to align with your specific approach. It also allows you to implement custom risk management rules and design indicators tailored to your strategy. Thanks to its event-driven framework, QSTrader ensures real-time responses to market fluctuations.
7. pysystemtrade
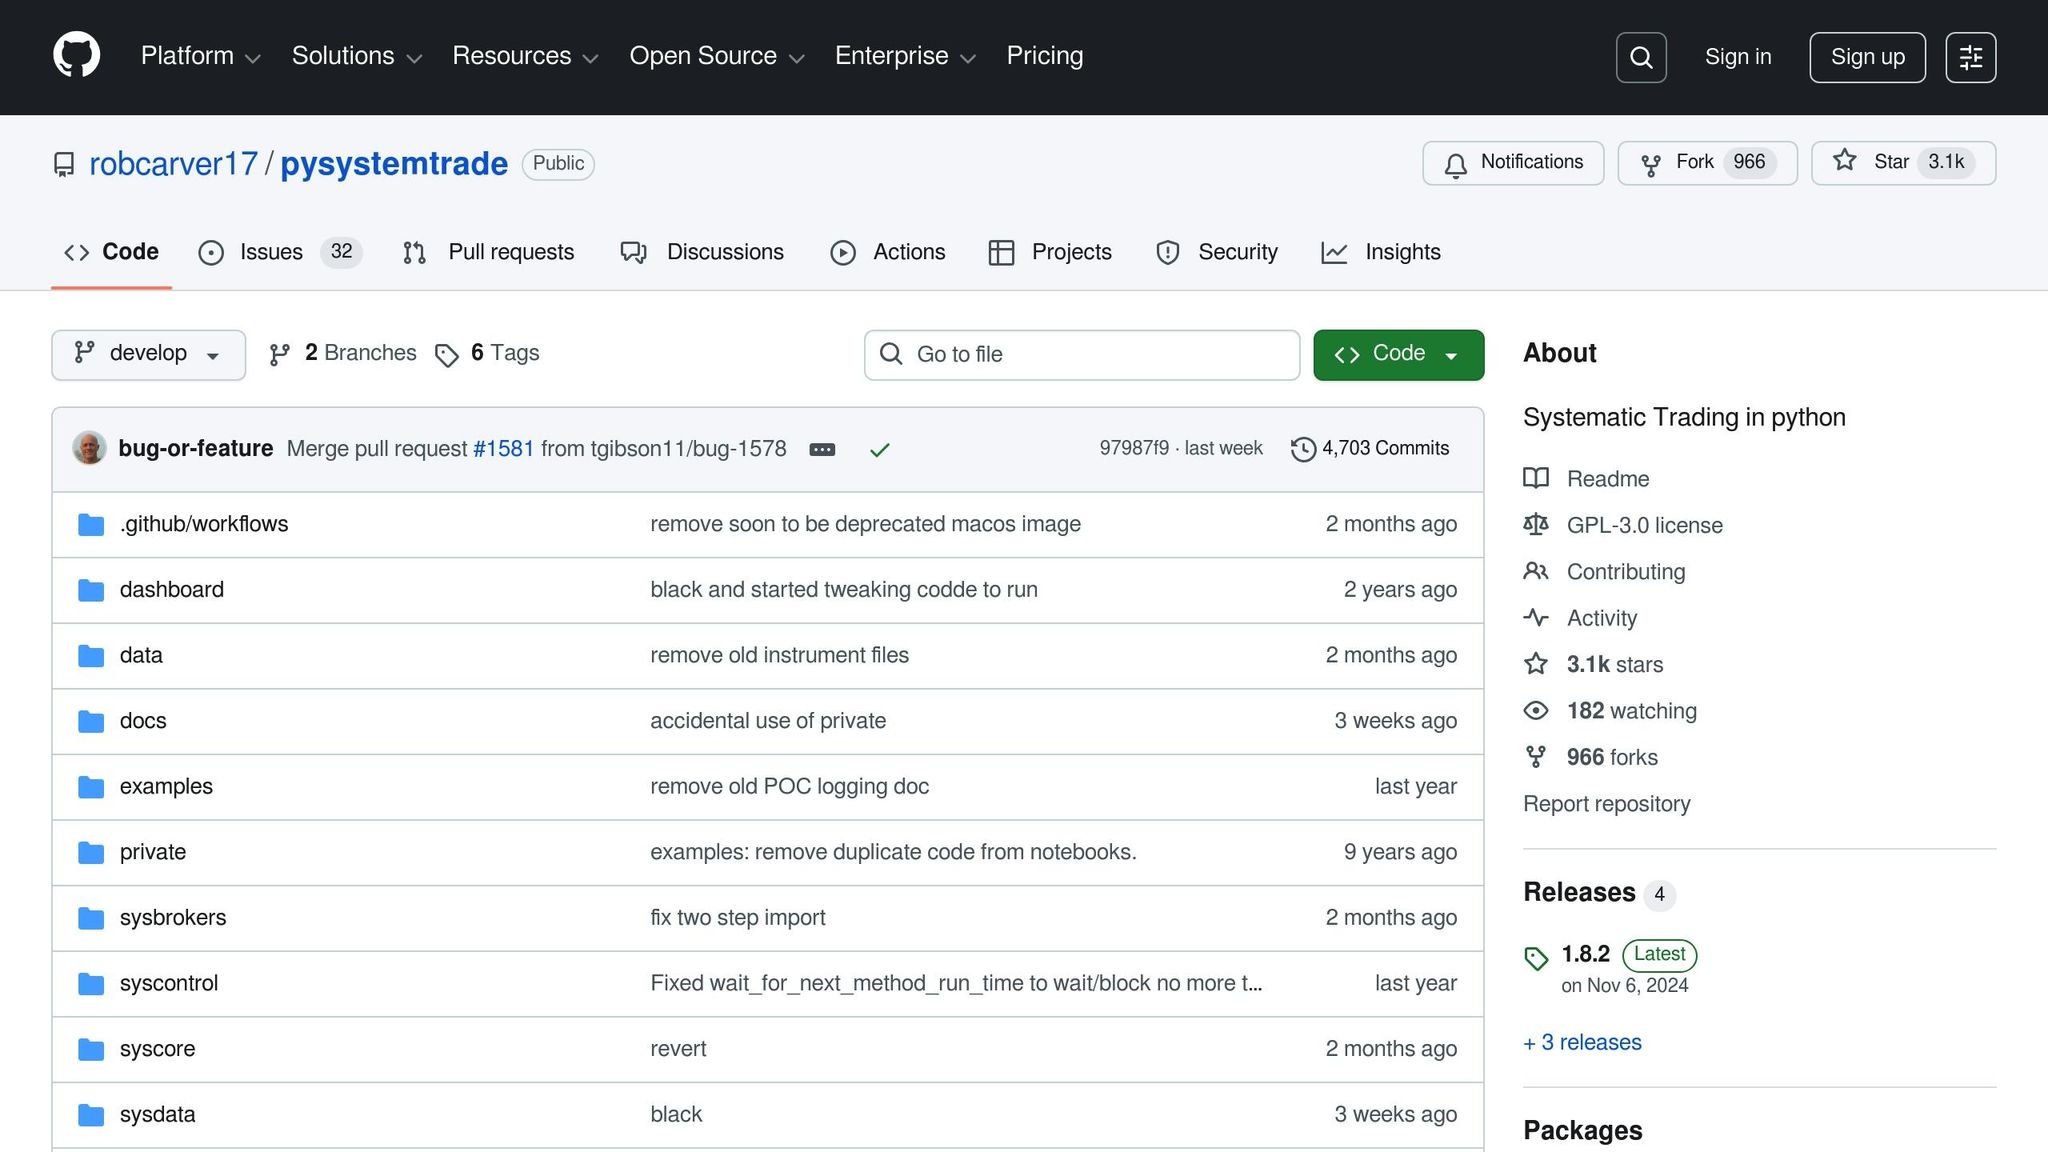
pysystemtrade is designed for systematic futures trading, handling everything from backtesting strategies to live execution. Its framework is based on concepts from Rob Carver's Systematic Trading.
Portfolio and Strategy Customization Options
True to its systematic approach, pysystemtrade equips users with powerful tools to fine-tune their trading strategies. It includes a detailed backtesting system that incorporates optimization and calibration techniques, ensuring your trading strategies align with well-defined rules.
Live Trading Capabilities
pysystemtrade supports fully automated futures trading through Interactive Brokers. This integration makes it simple to move from backtesting your strategies to executing them in live markets.
8. Finmarketpy
Stay online and closer to execution. Choose a VPS location for CME futures, New York markets, London FX, API trading, and more.
Host your platform near the market route that matters.
From $59.99/mo
Finmarketpy brings a fresh perspective to backtesting with its templating and customization features, making it a handy tool for market data analysis.
This library provides a simple API that facilitates backtesting and market data analysis. A standout feature is its templating system, which simplifies the setup of backtests, making strategy development more efficient.
Portfolio and Strategy Customization Options
Finmarketpy's object-oriented approach allows you to build a base strategy and tweak it to suit different market scenarios.
Key features include:
- A risk-weighting calculator that uses volatility targeting.
- Tools for analyzing market events and evaluating seasonal performance.
However, it’s worth noting that Finmarketpy isn’t designed for high-frequency trading.
Support for Multiple Data Sources and Formats
For data acquisition, Finmarketpy integrates with findatapy, giving you access to providers like Yahoo, Quandl, and Bloomberg. If you’re an experienced developer looking to expand data source options, findatapy can be modified to include new providers with relative ease.
Community Support and Documentation Quality
The documentation for Finmarketpy leans heavily on sample code, which may feel more intuitive for seasoned developers. If you’re new to Python backtesting libraries, expect a learning curve as you dive into the code examples to understand how its components fit together.
9. Fastquant
Fastquant is all about simplicity and speed, making it an appealing choice for anyone looking to dive into backtesting without the hassle of complex setups. With the goal of making quantitative finance more approachable, this library allows users to test strategies with just three lines of Python code. It’s a perfect fit for beginners and those who need to prototype ideas quickly.
Let’s break down how Fastquant handles data integration, strategy customization, and community support.
Support for Multiple Data Sources and Formats
Fastquant simplifies the process of accessing market data by offering built-in connections to providers like Yahoo Finance, the Philippine Stock Exchange, and Binance. This means you can pull historical price data directly into your Jupyter notebooks without wrestling with APIs or data formatting headaches.
While this built-in functionality is a huge time-saver, the documentation doesn’t go into much detail about integrating custom data sources. If you’re planning to use data outside of the supported providers, you might need to figure out additional steps on your own.
Portfolio and Strategy Customization Options
Even though Fastquant is designed with simplicity in mind, it doesn’t skimp on flexibility. It comes with pre-built strategies like Relative Strength Index, moving average crossover, and buy-and-hold, making it easy to hit the ground running.
When you’re ready to go beyond the basics, Fastquant supports custom strategy creation with minimal coding. For those looking to push boundaries, the library also integrates with machine learning and statistical models, allowing for more advanced strategy development. This blend of simplicity and scalability means you can start small and grow your approach as your skills and needs expand.
Fastquant is distributed under the MIT license, giving you the freedom to modify and use it in your projects however you see fit.
Community Support and Documentation Quality
One thing to keep in mind: Fastquant might not be the fastest option out there. Its performance can lag when dealing with complex strategies or large datasets. However, its straightforward design makes it a fantastic choice for traders looking to validate ideas quickly or educators introducing quantitative finance concepts.
The library’s emphasis on minimal coding and ease of use makes it especially attractive for beginners and rapid prototypers. While it may not match the computational power of some other platforms, its accessibility and practicality make it a valuable tool for many users.
10. QuantConnect

QuantConnect is a platform designed to bring backtesting and live trading together seamlessly. At its core is the open-source LEAN engine, which allows you to develop, test, and deploy trading strategies without needing to rewrite your code at each stage.
Access to Multiple Data Sources and Formats
QuantConnect simplifies the process of working with market data by offering built-in integration with standard data providers. This eliminates the hassle of creating custom data pipelines, making it easier to access the data you need for your strategies.
Options for Live and Paper Trading
The LEAN engine is optimized for live trading, enabling a smooth transition from strategy development to real-world execution through its brokerage integrations. If you'd prefer to test strategies without financial risk, QuantConnect also supports paper trading, where you can simulate trading with live market data and realistic order execution.
Flexible Portfolio and Strategy Customization
The platform’s framework is designed for extensive customization, ensuring that any tweaks made during the development phase can be directly applied to live trading.
A Respected Name in Algorithmic Trading
QuantConnect has earned recognition within the algorithmic trading community for its comprehensive and integrated approach. If you’re looking for a platform that bridges the gap between backtesting and live trading, QuantConnect is a strong contender.
Library Comparison Table
Here's a quick overview of how different backtesting libraries handle data sources. Choosing the right library depends on the type of data you work with and the specific needs of your trading strategy.
| Library | Data Source Support |
|---|---|
| Backtesting.py | CSV, pandas DataFrames, custom feeds |
| Backtrader | CSV, pandas, live feeds |
| PyAlgoTrade | CSV, Yahoo Finance, Google Finance |
| bt | pandas DataFrames, custom data sources |
| Zipline | Bundle system for equities, custom data loaders |
| QSTrader | CSV, databases, custom data handlers |
| pysystemtrade | CSV, Arctic (MongoDB), IB data feeds |
| Finmarketpy | Bloomberg, Quandl, Yahoo Finance, custom sources |
| Fastquant | Yahoo Finance, Philippine Stock Exchange |
| QuantConnect | Built-in providers for equities, forex, crypto, futures |
Each library has its strengths when it comes to data handling. For instance, Zipline is ideal for U.S. equity traders due to its bundle system, while Finmarketpy and QuantConnect stand out for their ability to integrate real-time feeds without requiring additional custom pipelines.
Conclusion
Python backtesting libraries provide a way to test trading strategies using historical data, helping traders identify potential risks before going live. Choosing the right tool requires hands-on evaluation to ensure it aligns with your specific requirements.
FAQs
What should I look for when selecting a Python backtesting library for my trading strategy?
When choosing a Python backtesting library, there are a few important things to keep in mind. First, look for detailed documentation - this makes it easier to understand how the library works and how to put it into practice. Without clear guidance, even the best tools can become frustrating.
Next, ensure the library supports the data sources and formats you rely on. Compatibility with your workflow is a must, as it saves time and avoids unnecessary headaches.
It's also worth checking if the library feels "Pythonic." In other words, does it follow Python's design principles? A library that's intuitive and works naturally with Python will make your development process much smoother.
Finally, take a close look at the licensing terms. Whether your project is personal or commercial, the license needs to align with your goals to avoid any legal or usage issues down the road.
Can Python backtesting libraries integrate real-time data for live trading?
Python backtesting libraries are mainly built for analyzing historical data, but some also include features or extensions that allow real-time data integration for live trading. These capabilities often rely on external APIs or third-party data providers to pull live market data and execute trades.
That said, not every backtesting library is designed with live trading in mind. For smooth integration, you might need to pair the library with other tools or use frameworks specifically tailored for live trading setups. Be sure to thoroughly review the library’s documentation to get a clear picture of its live data handling features and any limitations it might have.
Are these Python backtesting libraries beginner-friendly, or are they better suited for experienced traders?
The ease of using these libraries depends on their design and target audience. Some are tailored for beginners, focusing on simplicity and ease of use, making them ideal for those just starting with backtesting or trading. On the other hand, some libraries are geared toward advanced users, offering extensive customization options that demand a solid grasp of programming and trading principles.
If you're new to this, prioritize libraries with clear documentation, active community support, and easy-to-follow implementation. For seasoned traders, advanced options allow greater flexibility to refine strategies and tackle more intricate trading setups. Your choice should align with both your expertise and the unique requirements of your trading approach.


