
Profit Factor is a critical metric for assessing trading strategies. It measures how much profit you make for every dollar lost, calculated by dividing total gross profit by total gross loss. A Profit Factor above 1.0 indicates profitability, while below 1.0 signals losses. The sweet spot for most traders is between 1.75 and 4.0, balancing profitability and reliability. Values above 4.0 could mean the strategy is overly optimized for past data, making it risky for live trading.
Key points to know:
- Formula: Total Gross Profit ÷ Total Gross Loss.
-
Benchmarks:
- Below 1.0: Unprofitable.
- 1.0–1.3: Barely profitable.
- 1.75–3.0: Strong performance.
- Above 4.0: Possible over-optimization.
- Example: A strategy with $2,000 in profits and $1,000 in losses has a Profit Factor of 2.0, meaning $2 earned for every $1 lost.
- Limitations: It doesn’t account for trade frequency, risk, or costs like commissions. Large outliers can also skew results.
Pair Profit Factor with other metrics like Maximum Drawdown and Sharpe Ratio to get a complete picture of your strategy's performance. Tools like QuantVPS can help ensure consistent execution and minimize slippage, protecting your Profit Factor in live trading.
What is Profit Factor?
Let’s dive into what Profit Factor really means and why it’s so important.
Profit Factor measures the ratio of your total gross profit to your total gross loss over a specific time frame. To calculate it, divide the total of all winning trades by the absolute total of all losing trades.
In simple terms, it’s a way to measure how effective your trading strategy is. While your win rate tells you how often you’re right, Profit Factor answers a deeper question: are you actually making money? Catalin from Altrady explains it perfectly:
"Profit Factor answers the most important question in trading: For every 1 unit I lose, how many units do I make?"
This distinction highlights why focusing only on win rates can be misleading. For instance, a strategy with a 90% win rate could still lose money if its Profit Factor is below 1.0. Imagine nine trades that each win $10 (totaling $90) but are wiped out by a single $100 loss. In this case, the Profit Factor would be 0.9, underscoring an unprofitable strategy despite a high win rate. On the flip side, strategies like trend-following systems, which might only win 30-40% of the time, can perform well if their Profit Factor stays above 1.5.
Here’s the breakdown:
- A Profit Factor of 1.0 means you're breaking even - your profits and losses cancel each other out (before factoring in fees or slippage).
- Below 1.0? That signals unprofitability.
- Traders often aim for a Profit Factor between 1.75 and 4.0. Research suggests this range balances strong performance with realistic expectations.
- Anything above 4.0 might raise concerns, as it could indicate the strategy has been "curve-fitted" to historical data.
Profit Factor also provides a buffer for real-world trading challenges. Live trading often underperforms compared to backtests, so maintaining a Profit Factor above 1.75 helps absorb costs like commissions, fees, and slippage while keeping you profitable. This makes it an essential tool for evaluating and refining your trading strategies.
How to Calculate Profit Factor
Run 24/7 while you sleep. Keep bots, platforms, and trade copiers online on a dedicated VPS.
Low-latency VPS hosting for your trading platform.
From $59.99/mo
Profit Factor Formula
The formula for calculating Profit Factor is:
Profit Factor = Total Gross Profit / Total Gross Loss.
Here’s what each term means:
- Total Gross Profit: The sum of all gains from winning trades during a specific period.
- Total Gross Loss: The sum of all losses (converted to positive values) incurred during the same period.
Let’s break it down with an example to make things clearer.
Step-by-Step Calculation Example
Here’s a practical example based on data from 10 trades analyzed in Option Alpha's 2023 study:
| Trade # | Result ($) | Category |
|---|---|---|
| 1 | +$150 | Win |
| 2 | +$350 | Win |
| 3 | +$400 | Win |
| 4 | -$250 | Loss |
| 5 | +$200 | Win |
| 6 | -$400 | Loss |
| 7 | +$200 | Win |
| 8 | +$250 | Win |
| 9 | -$350 | Loss |
| 10 | +$450 | Win |
Here’s how to calculate step by step:
-
Add up all the winning trades:
$150 + $350 + $400 + $200 + $200 + $250 + $450 = $2,000 (Total Gross Profit). -
Add up the absolute values of all losing trades:
$250 + $400 + $350 = $1,000 (Total Gross Loss).
Note: Losses are converted to positive values for this calculation. -
Divide Total Gross Profit by Total Gross Loss:
$2,000 ÷ $1,000 = 2.0.
This Profit Factor of 2.0 indicates that for every dollar lost, the strategy generated two dollars in profit. Remember to always use the absolute values of losses when calculating the denominator.
How to Interpret Profit Factor Values
Profit Factor Ranges and Trading Strategy Performance Benchmarks
Once you've calculated your Profit Factor, the next step is understanding what it tells you about your trading strategy. A Profit Factor above 1.0 indicates profitability - your total gains surpass your total losses. But don’t stop there; not every profitable strategy is worth pursuing.
A Profit Factor of exactly 1.0 means you’re breaking even. After factoring in commissions and slippage, even slightly positive values like 1.1 or 1.2 leave little room for error. These small margins can quickly evaporate as market conditions shift or execution costs rise.
Professional traders generally aim for a Profit Factor between 1.5 and 1.75 to allow for a safety margin. This is because live trading often underperforms backtests by 10% to 20%, thanks to factors like slippage. For example, a backtested Profit Factor of 1.8 might realistically drop to around 1.5 or 1.6 in live markets. This cautious approach is why traders carefully analyze the implications of exceptionally high Profit Factor values.
But what about extremely high numbers? Oddmund Groette from Quantified Strategies offers this perspective:
"A good profit factor in trading has a value of more than 1.75 but preferably not above 4".
Profit Factors exceeding 3.0 can be a red flag for over-optimization. They often suggest a strategy is too finely tuned to historical data, making it unreliable in real-world trading.
Profit Factor Benchmarks and What They Mean
Here’s a quick guide to what different Profit Factor ranges might tell you about your strategy:
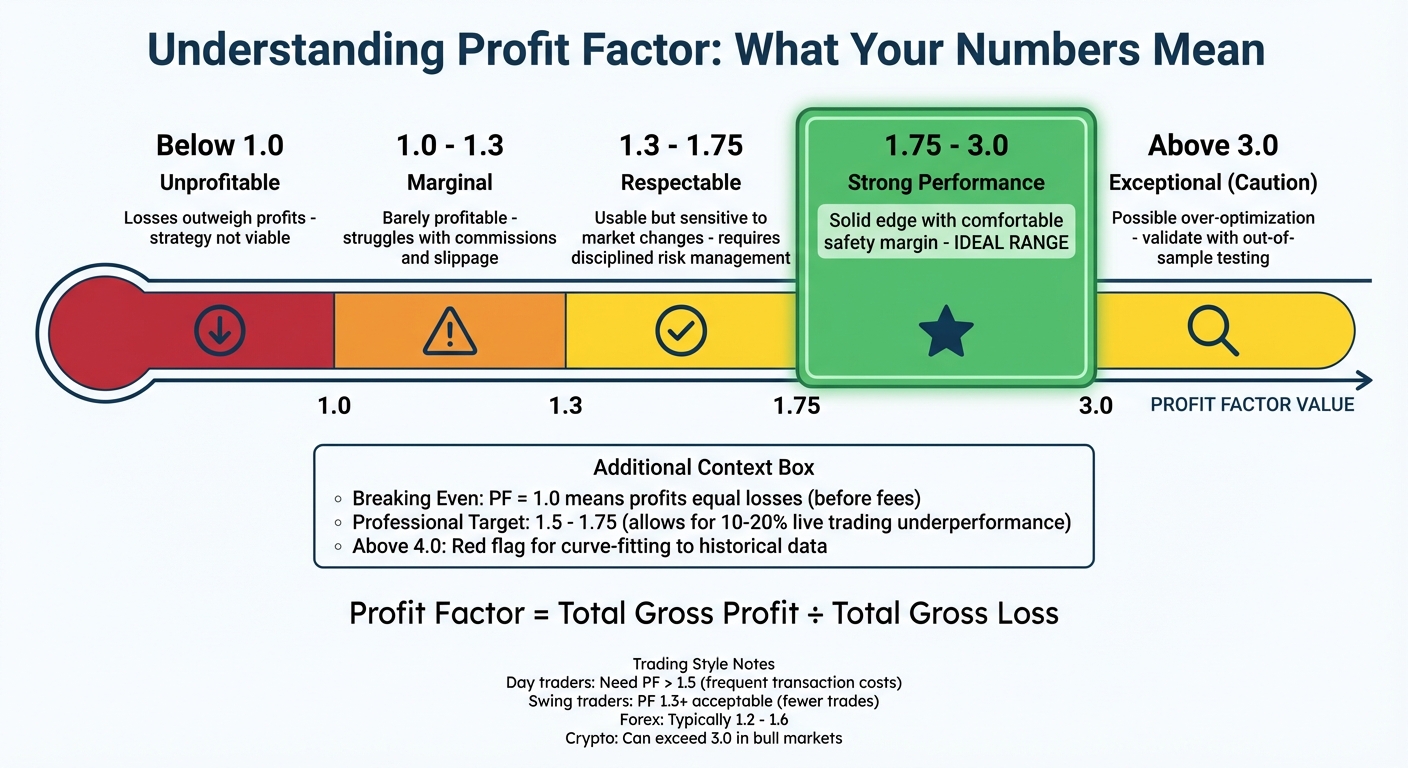
| Profit Factor Range | Interpretation | Implication |
|---|---|---|
| Below 1.0 | Unprofitable | Losses outweigh profits - this strategy isn’t viable. |
| 1.0 – 1.3 | Marginal | Barely profitable; likely to struggle with costs like commissions and slippage. |
| 1.3 – 1.75 | Respectable | Usable but sensitive to market changes - requires disciplined risk management. |
| 1.75 – 3.0 | Strong | Indicates a solid edge with a comfortable safety margin. |
| Above 3.0 | Exceptional | Could signal over-optimization; validate with out-of-sample testing. |
These benchmarks aren’t universal. They depend on your trading style and market. For instance, day traders often need a Profit Factor above 1.5 to offset frequent transaction costs. Swing traders, with fewer trades, might find 1.3 acceptable. In Forex, Profit Factors typically range from 1.2 to 1.6 due to tight spreads, while crypto strategies can exceed 3.0 during bull markets but may dip below 1.0 in bear markets.
Stay online and closer to execution. Choose a VPS location for CME futures, New York markets, London FX, API trading, and more.
Host your platform near the market route that matters.
From $59.99/mo
Finally, remember that Profit Factor is just one piece of the puzzle. A strategy with a 2.0 Profit Factor but a 50% trailing drawdown is usually riskier than one with a 1.6 Profit Factor and only a 10% drawdown. For a complete picture, combine this metric with others like Maximum Drawdown and the Sharpe Ratio to thoroughly evaluate your trading edge.
Strengths and Limitations of Profit Factor
Profit Factor stands out for its simplicity and effectiveness in evaluating trading strategies. The formula - Gross Profit divided by Gross Loss - is straightforward to compute and offers a quick snapshot of profitability. This makes it a practical tool for assessing strategies across forex, stocks, and crypto markets.
One of its key advantages is its ability to cut through less meaningful metrics, like win rate, and focus on dollar efficiency. In essence, it answers the critical question: "For every dollar lost, how many dollars are gained?" This clarity helps traders identify the true edge of a strategy. Despite these benefits, it’s important to acknowledge the limitations of Profit Factor to avoid over-reliance on it.
Profit Factor does have its drawbacks. For one, it overlooks trade frequency. A Profit Factor of 2.0 derived from 10 trades is treated the same as one calculated from 1,000 trades. This can make a high Profit Factor in a small sample unreliable. Another issue is its inability to reflect risk-adjusted returns. As BacktestBase points out:
"A 2.0 profit factor strategy with 50% drawdowns may be unacceptable for most traders".
Even if the Profit Factor looks promising, large trailing drawdowns can make a strategy impractical for long-term use.
Additionally, Profit Factor is vulnerable to distortion from outliers. A single large winning trade can inflate the metric, masking inconsistencies in the overall strategy. Another common oversight is the exclusion of trading costs like commissions and slippage in standard calculations. These costs can turn a seemingly profitable system (with a Profit Factor in the 1.1–1.2 range) into one that actually loses money.
Using Profit Factor with QuantVPS for Strategy Evaluation
When evaluating trading strategies, having reliable execution infrastructure is just as important as the strategy itself. For instance, a strategy that shows a Profit Factor of 2.0 during backtesting can quickly drop to below 1.5 in live trading due to slippage and execution delays. This is where QuantVPS steps in, offering ultra-low latency infrastructure (ranging from 0.3 to 5 milliseconds) compared to the typical 100–400 milliseconds of home internet connections. This drastic reduction in latency helps minimize incremental losses that can eat into your gross profits.
QuantVPS also guarantees 100% uptime, which is crucial for maintaining uninterrupted trading operations. Consistent uptime is essential because calculating a statistically reliable Profit Factor requires data from at least 400 trades. As one trading expert highlights:
"A single disconnection can compromise an entire trading session. VPS hosting ensures your EAs run continuously without interruption, ensuring the consistent performance required in professional trading".
QuantVPS not only ensures uninterrupted connectivity but also supports major trading platforms like MetaTrader 5, NinjaTrader, and TradeStation. This allows for automated, real-time Profit Factor tracking, reducing the risk of manual calculation errors. For day traders who need to maintain a Profit Factor above 1.5 to stay profitable after transaction costs, this infrastructure provides a critical safety net to protect their trading edge.
The takeaway is clear: if your live Profit Factor drops significantly compared to backtested results, latency and execution delays are often to blame. By minimizing these technical hurdles, QuantVPS helps you determine whether your strategy’s edge is genuine or being undermined by execution inefficiencies. This level of precision is vital for safeguarding your Profit Factor and highlights the importance of robust VPS infrastructure in achieving trading success.
Conclusion
Profit Factor is a straightforward yet powerful way to measure how efficiently your trading strategy turns losses into profits. The formula - Gross Profit ÷ Gross Loss - makes it easy to understand. A Profit Factor above 1.0 signals profitability, with the ideal range often falling between 1.75 and 2.0. However, if you see values over 4.0, it might indicate curve-fitting, which can hurt performance in live markets.
This metric also fills the gaps left by focusing solely on win rates. For example, one strategy with an 85% win rate earned just $3,000 in net profit, while another with a 45% win rate brought in $8,100 due to a higher Profit Factor. This shows that trading success isn’t just about winning often - it’s about maximizing the gains from your wins compared to your losses.
To make your analysis meaningful, review at least 400 trades for statistical reliability. Pairing Profit Factor with other tools like Maximum Drawdown and Sharpe Ratio provides a more complete picture of your strategy's risk-adjusted performance. This approach helps identify strategies that perform well in theory but may falter in real-world conditions.
Lastly, QuantVPS ensures your strategy operates at its best by eliminating execution delays. With ultra-low latency (0 to 1 millisecond) compared to standard home internet, you reduce slippage and avoid disconnections that can quietly eat into profits. Combining precise performance metrics with reliable execution infrastructure is key to turning backtested strategies into live trading success.
FAQs
How many trades do I need for a reliable Profit Factor?
To evaluate your Profit Factor accurately, you need a solid number of trades in your backtest. While there’s no strict rule for the minimum number, a larger sample size typically leads to better statistical reliability and a clearer picture of performance.
Should I include commissions and slippage in Profit Factor?
Including commissions and slippage in the Profit Factor calculation is essential for a realistic view of trading performance. These factors represent actual trading costs, and by accounting for them, you get a more accurate measure of total profits versus losses. Ignoring these expenses could lead to an inflated perception of profitability, which might not hold up in real-world trading scenarios.
What can make an unusually high Profit Factor misleading?
An unusually high Profit Factor might seem impressive at first glance, but it can be deceptive if it's based on a small number of trades. In such cases, the results might not reflect consistent performance but could instead stem from sheer luck rather than a reliable trading strategy.


