
The cup and handle pattern is a well-known bullish continuation signal in trading, but it’s not foolproof. Traders often make these five mistakes:
- Misidentifying the Pattern: A proper cup has a rounded "U" shape, not a sharp "V." The handle should form in the cup's upper third and retrace no more than 50% of the cup's depth.
- Ignoring Volume Signals: Volume should decrease during the cup's formation and spike by 40-50% during the breakout. Weak volume often leads to failed breakouts.
- Entering Too Early: Jumping in before the handle or breakout forms can result in losses. Wait for a confirmed breakout with a strong close above the handle's resistance.
- Neglecting Market Trends: The pattern works best in an uptrend. Avoid using it as a reversal signal in weak markets.
- Poor Stop-Loss Placement: Stops should be slightly below the handle's low, with a 1:2 risk-reward ratio. Tight stops can trigger premature exits.
Valid Cup and Handle Pattern vs Common Trading Errors
1. Incorrect Pattern Identification
Pattern Structure Accuracy
A common mistake when identifying patterns is confusing a sharp "V" shape for a proper cup. A valid cup should feature a rounded, U-shaped bottom, signaling gradual accumulation by buyers. Sharp V-shaped recoveries, often triggered by news events, lack the stable base necessary for a dependable breakout.
"The cup should have a rounded, U-shaped bottom rather than a sharp V-shape, indicating gradual accumulation by buyers."
Misjudging the depth of the cup is another frequent error. Ideally, a cup retraces between 15% and 35% of the prior advance. If the retracement exceeds 50%, it suggests excessive selling pressure, undermining the pattern's reliability. Paying attention to these retracement levels is essential for confirming the pattern.
The handle's formation is equally important. It should develop in the upper third of the cup, slope slightly downward or move sideways, and retrace no more than one-third to one-half of the cup's depth. Handles that dip into the lower half or drift upward signal weak buying interest. On daily charts, the handle typically forms over one to four weeks. Patterns that complete in less than seven weeks are often unreliable. These structural details are key to distinguishing a valid cup and handle from misleading lookalike patterns.
If these structural elements are absent, the pattern may actually represent a rounding bottom or a double bottom instead. Correct identification is critical since each pattern has its own trading implications.
2. Ignoring Volume Confirmation
After spotting a well-formed cup and handle pattern, understanding how volume behaves is essential to confirm the pattern's reliability.
Volume Behavior Analysis
Run 24/7 while you sleep. Keep bots, platforms, and trade copiers online on a dedicated VPS.
Low-latency VPS hosting for your trading platform.
From $59.99/mo
Volume is the engine behind breakouts. Even if the cup and handle pattern looks perfect, a lack of volume increase can doom its success. Many traders overlook volume trends, which are key to gauging genuine buying interest.
Here's what to watch for: during the cup's decline, volume should gradually taper off, signaling that selling pressure is easing. As the rounded bottom takes shape, trading activity typically stays below average, hinting at quiet accumulation. When the handle forms, a noticeable drop in volume suggests sellers have left the field, leaving committed holders in control.
The breakout is where volume becomes critical. A successful breakout is usually accompanied by a sharp spike in trading activity - ideally 40% to 50% above the stock's average daily volume. Without this surge, the breakout may lack conviction and fail. The table below breaks down the expected volume behavior during each stage of the pattern.
| Formation Stage | Expected Volume Behavior | Warning Sign |
|---|---|---|
| Cup Decline | Steady decrease | Sudden spikes indicating heavy selling |
| Cup Bottom | Below-average volume | Irregular increases suggesting unusual activity |
| Handle | Clear decrease | Volume higher than during the cup's rise |
| Breakout | 40–50%+ above average volume | Low or declining volume (false breakout) |
Trade Execution
Once volume trends align with the pattern, timing your trade becomes the next step. Enter the trade when the price closes above the handle's resistance level on strong volume. If a breakout happens with weak volume, it’s often better to wait for a retest of the breakout level, accompanied by higher volume, before committing. Breakouts on low volume are frequently unreliable and can lead to losses.
3. Entering Trades Too Early
Jumping into trades too soon is a common pitfall when working with the cup and handle pattern. Acting before the pattern fully confirms itself can quickly lead to losses. Many traders spot what they think is a breakout, rush in, and then watch the price reverse, leaving them stuck in a losing position.
Understanding the Pattern Structure
Patience is key. The handle typically takes one to four weeks to develop, and waiting for it to fully form can save you from unnecessary losses. For a valid setup, the handle should form in the upper third of the cup and should not retrace more than one-third of the cup's depth. Entering during the handle's decline is a risky move that often leads to losses.
Timing Your Entry
The safest entry point comes after a confirmed breakout. Wait for a candle to close above the handle's resistance level to avoid falling into a bull trap. Using a buy stop order just above the handle's high can help confirm sustained momentum.
A great example of this is Wynn Resorts, Limited (WYNN). In October 2013, the stock confirmed a massive cup and handle pattern that had been developing since its 2002 IPO. After hitting its 2007 high of $154 in 2011, it formed a handle supported by a 50% retracement. When WYNN broke out in October 2013, it gained 90 points within five months. Traders who entered too early during the handle's formation likely faced frustrating drawdowns, while those who waited for the confirmed breakout captured the entire move.
"The cup and handle pattern is one of the most reliable bullish setups in trading."
- Nick Schmidt, Co-founder of TraderLion and Deepvue
Mastering this timing ensures you're better positioned to align your trades with broader market trends, as discussed in the next step.
4. Ignoring the Broader Market Trend
When trading a cup and handle pattern, it's not enough to focus solely on the setup itself. Aligning your trade with the broader market trend can significantly impact the outcome. Even a textbook-perfect pattern can falter if the overall market is moving in the opposite direction. Since the cup and handle is a bullish continuation pattern, it performs best within an existing uptrend - not as a reversal signal for struggling stocks.
Market Trend Alignment
Before committing to a trade, ensure the stock is in a healthy uptrend. A quick way to confirm this is by checking if the stock is trading above its 50-day and 200-day moving averages. Additionally, compare the stock's performance to the S&P 500 during the handle's formation. Stocks that outperform the broader market during this phase often indicate relative strength.
It’s also worth examining the sector. If several stocks within the same industry are forming similar bullish patterns, it could signal broader institutional interest, which increases the likelihood of success.
The statistics back this up: cup and handle patterns generally have a success rate of 60% to 65% when confirmed with volume. In strong bull markets, this rate can soar to 95% if executed properly. On the flip side, bearish market conditions drastically reduce the pattern's reliability.
| Market Condition | Pattern Success Potential | Suggested Trading Strategy |
|---|---|---|
| Strong Uptrend | High | Consider larger positions |
| Sideways Market | Moderate | Use tighter risk controls |
| Bearish Market | Low | Avoid trades or limit exposure |
| Market Correction | Weak | Wait for the trend to stabilize |
"The pattern is most reliable as a continuation signal within an established trend, not as a standalone reversal signal in beaten-down stocks."
These broader market considerations are essential for refining your risk management approach.
Stay online and closer to execution. Choose a VPS location for CME futures, New York markets, London FX, API trading, and more.
Host your platform near the market route that matters.
From $59.99/mo
Risk and Stop-Loss Strategy
In markets that are uncertain or moving sideways, it’s wise to scale back your position size and tighten your risk parameters. If the market is in a correction phase or showing bearish signals, it’s often best to stay on the sidelines. Corrections can lead to weak breakouts, even when the pattern itself appears valid. Waiting for the right market conditions can save you from unnecessary losses.
5. Inadequate Risk Management and Stop Loss Placement
Spotting the right pattern and nailing your entry timing is only half the battle - what truly counts is disciplined risk management. Even the most promising cup and handle setup can crumble without it. The biggest misstep? Skipping a well-thought-out stop-loss that works with the pattern's structure. Without a clear exit plan, you're not trading; you're rolling the dice.
Risk and Stop-Loss Strategy
Set your stop-loss just below the handle's lowest point, leaving a small buffer to account for minor market swings. Avoid placing stops at obvious support levels, as these are more likely to get triggered. Instead, add a bit of extra room below the handle's trendline. If you're aiming for a tighter risk-reward ratio, you might opt for an aggressive stop just below the breakout candle's low. The ATR indicator can help you fine-tune this placement based on market volatility. However, keep in mind that tighter stops, while potentially increasing returns, also make you more vulnerable to being stopped out by routine price fluctuations.
To manage your risk effectively, adjust your position size so that the potential loss - the gap between your entry price and stop-loss - stays within 1% to 2% of your total account value. If the stop-loss distance is too wide compared to the depth of the cup, the trade likely won't offer a favorable risk-reward setup. Aim for at least a 1:2 risk-reward ratio to make the trade worthwhile.
"If you make an entry, you should be able to tell about the stop loss level, 'If the price went above or below this level, then my reasons for entry would be disproved by the market, thus my current analysis would be wrong.'"
- FBS Analyst Team
Once the price reaches halfway to your target, consider trailing your stop-loss to breakeven. If the price stalls and doesn't move toward your target within a reasonable period, a time-based stop can help you exit the trade and reallocate your capital. A well-executed cup and handle setup has the potential to deliver a 2.5:1 return-to-risk ratio, but this is only achievable if you take steps to safeguard your downside right from the start. These risk controls are the foundation for success before testing the strategy in real-world scenarios.
Comparison Table
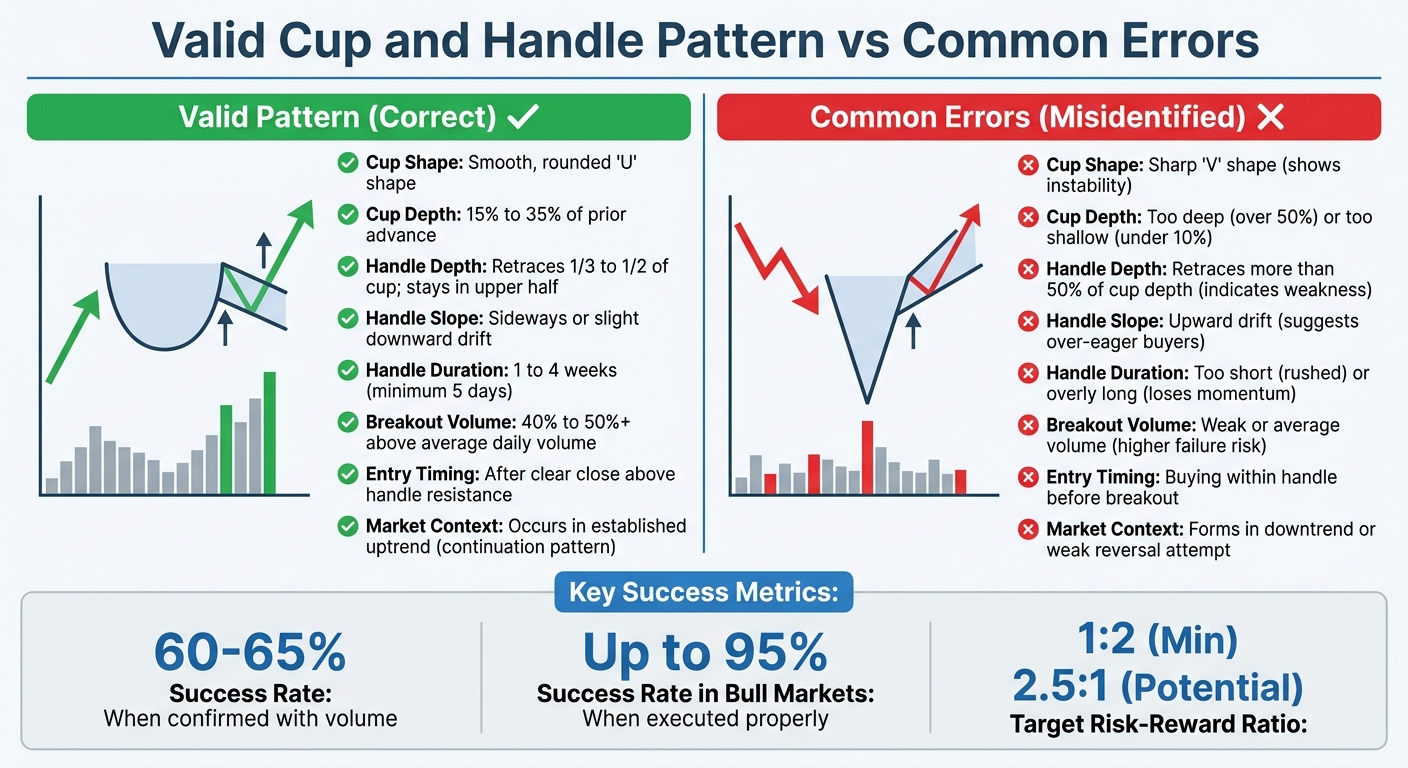
Recognizing precise patterns can mean the difference between successful trades and costly missteps. Here's a quick comparison of valid cup and handle patterns versus common errors:
| Feature | Valid Pattern (Correct) | Common Error (Misidentified) |
|---|---|---|
| Cup Shape | Smooth, rounded "U" shape | Sharp "V" shape (shows instability) |
| Cup Depth | 15% to 35% of the prior advance | Too deep (over 50%) or too shallow (under 10%) |
| Handle Depth | Retraces 1/3 to 1/2 of the cup; stays in the upper half | Retraces more than 50% of the cup depth (indicates weakness) |
| Handle Slope | Sideways or slight downward drift | Upward drift (suggests over-eager buyers) |
| Handle Duration | Lasts 1 to 4 weeks (minimum 5 days) | Too short (rushed) or overly long (loses momentum) |
| Breakout Volume | 40% to 50%+ above average daily volume | Weak or average volume (higher failure risk) |
| Entry Timing | After a clear close above handle resistance | Buying within the handle before the breakout |
| Market Context | Occurs in an established uptrend (continuation pattern) | Forms in a downtrend or weak reversal attempt |
The table highlights key differences, showing how proper structure and volume behavior are critical for success. For instance, during a breakout, volume should increase by at least 40% to 50% above the average to confirm the move.
Conclusion
The cup and handle pattern can be a reliable indicator of bullish continuation, but success hinges on avoiding five key mistakes: misidentifying the pattern, overlooking volume confirmation, entering too early, ignoring broader market trends, and neglecting risk management. These missteps can quickly turn a promising setup into a costly error.
When correctly identified, cup and handle patterns have a success rate of 60–65%, climbing as high as 95% in strong bull markets. To maximize this potential, traders should wait for a decisive close above the handle, confirm a 40–50% volume surge, and set stop-loss orders just below the handle's low. These steps are essential for increasing the odds of success.
Three key principles should guide your approach: accurate pattern recognition (look for a rounded cup), volume confirmation, and disciplined execution (avoid jumping in too soon). A checklist can help ensure the pattern meets structural criteria and aligns with the broader market trend.
Ultimately, success comes down to disciplined execution. Traders who master clear pattern recognition and enforce strict risk controls are better positioned to turn this bullish setup into consistent gains. Stick to these fundamentals, and you'll be well-equipped to make the most of this pattern.
FAQs
How do I tell a real cup and handle from a rounding bottom or double bottom?
A true cup and handle pattern features a U-shaped cup that forms after an upward price movement, followed by a shallow handle where the price consolidates briefly before breaking out with higher trading volume. In contrast, a rounding bottom lacks both the handle and breakout structure. Meanwhile, a double bottom creates a W-shape with two clear lows, without the rounded bowl or handle seen in the cup and handle pattern.
What’s the best way to confirm a breakout if volume data is unclear or delayed?
If volume data is unclear or delayed, shift your attention to price action signals and other technical tools to confirm a breakout. For instance, you can wait for the price to retest the breakout level, which often serves as a strong validation. Alternatively, look for additional patterns or signals that support the breakout scenario. Relying only on volume can lead to missteps, so combining multiple indicators ensures a more reliable analysis.
How do I set a profit target for a cup and handle trade?
To determine a profit target, calculate the depth of the cup and add that distance to the breakout point above the rim resistance. This strategy ties your target directly to the pattern's previous price movement, offering a measurable and logical approach. It ensures your target aligns with the pattern’s historical behavior, giving you a clear and actionable goal for your trade.


