
- Opening Price: Reflects overnight news and sentiment. Determined through an opening auction that consolidates pre-market orders.
- Closing Price: Represents the final valuation of a stock for the day, shaped by institutional trades during the closing auction.
-
Key Insights:
- A large gap between open and close often signals strong market momentum.
- The relationship between yesterday's close and today's open highlights shifts in sentiment.
- Closing prices near the day's high or low indicate buying or selling dominance.
Traders use these prices to assess sentiment, analyze trends, and identify trading opportunities. For instance, gaps between the previous close and today's open can signal potential reversals or trend continuations. Tools like VWAP and anchored VWAP help refine strategies further.
Understanding these patterns can help you make more informed trading decisions. You can also implement these insights using top Pine Script strategies for automated execution.
Daily Open vs Close Prices: Key Trading Metrics and Gap Statistics
What Are Daily Open and Close Prices?
Daily open and close prices are essential metrics in the financial markets. The open price refers to the first trade of the trading session, while the close price marks the last trade of the day. These prices form the foundation for many trading strategies and analytical methods, which will be explored further.
On a standard price bar, the open price is represented by a horizontal tick on the left, and the close price is shown as a tick on the right. The gap between these two points can reveal market momentum: a wide gap might indicate strong directional movement, while a close price near the open suggests market indecision. Many charting platforms enhance this visualization with color coding - green or black bars indicate a higher close than the open, while red bars signal the opposite.
Daily Open Price
The opening price isn’t set in advance; instead, it’s determined through an automated process called the opening cross. For example, on exchanges like Nasdaq, buy and sell orders collected overnight are matched to establish the opening price. This process incorporates overnight developments to reset the market.
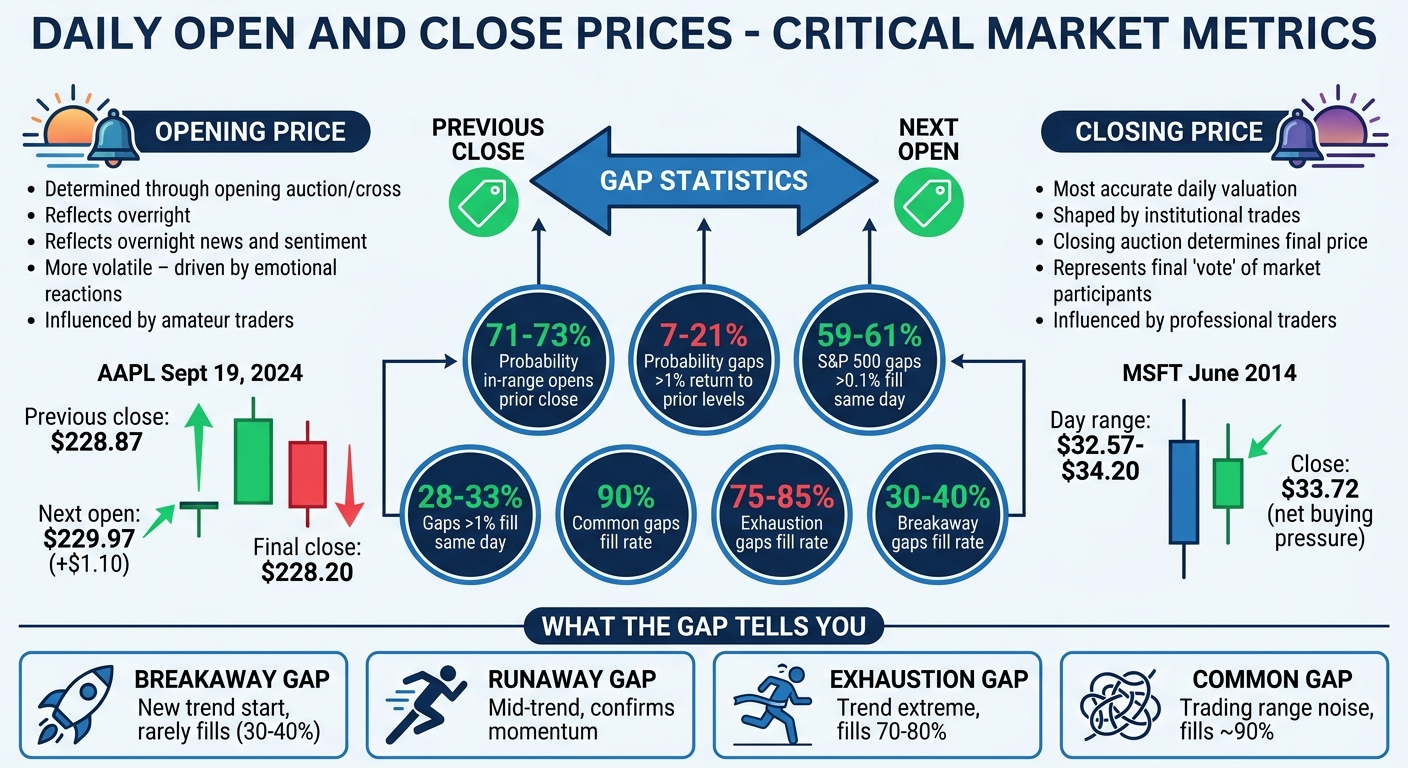
Take Apple (AAPL) on September 19, 2024, as an example. The stock closed at $228.87 the previous day. After overnight trading activity, it opened the next morning at $229.97 - a $1.10 increase - before closing at $228.20. This opening price reflected traders’ initial reactions to new information entering the market.
Daily Close Price
The closing price carries significant weight in market analysis. As Investopedia explains:
The closing price is considered the most accurate valuation of a stock or other security until trading resumes on the next trading day
. Investors use this price to track performance over time and to create historical price charts.
Many exchanges rely on closing auctions to determine the official closing price, efficiently matching large institutional orders. This period is critical for portfolio adjustments and managing risk before the session ends. For instance, in June 2014, Microsoft (MSFT) traded between $32.57 and $34.20 during the day, with a final trade at $33.72 - indicating net buying pressure.
Accessing Daily Open and Close Data
Traders can access daily open and close prices through various tools and platforms. Financial data APIs like EODHD and Polygon.io, as well as historical data providers such as FirstRate Data, offer this information. Charting platforms also visualize these metrics using OHLC (Open-High-Low-Close) bars. Data is often provided in formats like JSON or CSV, making it easy to analyze using tools like Excel, Python, or R.
With a clear understanding of these metrics, we can now explore how they influence market sentiment and trading behavior.
Why Daily Open and Close Prices Matter for Traders
Daily open and close prices are essential for understanding market behavior. These two points provide insight into who dominated the session and how momentum shifted. The opening price reflects overnight sentiment and the market's reaction to after-hours news. On the other hand, the closing price captures what Dr. Alexander Elder describes as the ultimate verdict of the trading day:
Run 24/7 while you sleep. Keep bots, platforms, and trade copiers online on a dedicated VPS.
Low-latency VPS hosting for your trading platform.
From $59.99/mo
Amateurs as a group are more likely to influence the opening price... But as the trading day wears on, professionals determine the day's ultimate results
. This contrast between the open and close lays the groundwork for analyzing price movements in detail.
What Daily Open and Close Prices Tell You
The relationship between open and close prices reveals the strength of buying or selling pressure during the session. If a stock closes much higher than it opened, it suggests buyers were in control; if it closes lower, sellers had the upper hand. The size of the gap between these two prices also matters. A large difference (long body) signals strong conviction, while a small difference (short body) points to indecision or consolidation.
Where the closing price falls within the daily range offers further clues. A close in the top 25% of the range indicates strong buying momentum, while a close in the bottom 25% suggests selling pressure. Patterns like "Doji", where the open and close are nearly identical, highlight a balance between buyers and sellers and often hint at a potential trend reversal.
How These Prices Affect Market Sentiment and Trend Analysis
Daily open and close prices act as benchmarks for gauging market sentiment and confirming trends. As Edgeful put it:
The close represents the final 'vote' of all market participants during that period
. This makes the closing price especially important for assessing whether bullish or bearish sentiment is gaining strength.
Opening gaps - when the day's open is significantly different from the previous day's close - are another critical indicator. For instance, analysis of 12,390 sessions found that when opens are within the prior day's range, there's a 71–73% likelihood of revisiting the previous close. However, gaps exceeding 1% often signal a sharp shift in market behavior, with only a 7–21% chance of returning to the previous close.
The open and close also reflect different market dynamics. The open tends to be more volatile, driven by emotional reactions and overnight orders, while the close often shows institutional activity. This institutional presence at the close creates key price levels that can serve as support or resistance in future trading sessions.
How to Analyze Daily Open and Close Data
To make sense of daily open and close prices, focus on two key aspects: price gaps from the previous close and the closing price's position within the day's range. These elements provide insights into market sentiment and momentum shifts.
Analyzing Gaps Between Open and Previous Close
A gap occurs when there's a noticeable difference between the opening price and the previous day's close, creating a visible space on the chart. For stocks, gaps exceeding 1–2% are usually noteworthy, while for indices, gaps of 0.5–1% stand out. These gaps often reflect sudden sentiment changes or imbalances in supply and demand that emerge while the market is closed.
Different types of gaps signal specific market behaviors:
- Breakaway gaps: These occur during the start of new trends or breakouts and rarely fill (only 30–40% of the time).
- Runaway gaps: These appear mid-trend and confirm accelerating momentum.
- Exhaustion gaps: Found at trend extremes, they often precede reversals and fill about 70–80% of the time.
- Common gaps: These smaller gaps happen within trading ranges, fill roughly 90% of the time, and are often just market noise.
Larger gaps (over 1%) can indicate significant market shifts, with only a 7–21% chance of returning to prior levels. On the other hand, when markets open within the previous day's range, there's a 71–73% likelihood of revisiting the previous close during the session. For a gap to be meaningful, it should be accompanied by a volume spike of 1.5× to 2× the average daily volume.
Before acting on a gap, let the market settle for the first 15–30 minutes to determine whether the gap will fill (retrace to the previous close) or extend in the same direction. To manage risk, consider placing stop-loss orders just beyond the opposite side of the gap to guard against sudden reversals.
Next, evaluate the closing price's location within the day's range to refine your analysis.
Where the Close Falls Within the Daily Range
The position of the closing price within the day's high–low range sheds light on market momentum. A close near the upper range suggests strong buying interest, while a close near the lower range indicates selling pressure dominated. This positioning also shapes the daily candlestick, a key tool in technical analysis.
Interestingly, daily highs or lows form within the first hour of trading on 64% of Nifty days and 70% of Bank Nifty days. This makes the final hour critical - breakouts during this time can signal momentum that carries into the next trading session. High volume spikes in the closing minutes often indicate institutional participation, reinforcing the day's price direction.
When prices touch the previous session's Value Area High (VAH) or Value Area Low (VAL), there’s an 81–84% chance they will also reach the Volume Point of Control (VPOC) across major futures contracts. This helps identify high-probability entry or exit points. Watching late-session volume is equally important - moves lacking strong volume often reverse quickly, while those with solid volume tend to hold.
Trading Strategies Using Daily Open and Close Prices
Leverage targeted trading strategies that make the most of gap behaviors and closing price dynamics. These setups focus on both mean reversion and trend-following opportunities, offering actionable insights for traders.
Gap-Fade Strategy
The gap-fade strategy is built around the market's tendency to correct overnight price gaps caused by emotional reactions to news. This approach works particularly well with Common Gaps (small gaps within a trading range) and Exhaustion Gaps (large gaps at trend extremes). These gaps tend to fill approximately 90% and 75–85% of the time, respectively.
To execute this strategy, wait for the first candle to close, confirming a move toward the prior day's close. Using best trading indicators like the Relative Strength Index (RSI) can help identify overextended prices - such as an RSI below 30 for a gap down. Alternatively, monitor the Volume-Weighted Average Price (VWAP) for signs that momentum is shifting toward a gap fill. The best opportunities often occur early in the session when probabilities are higher.
"The real skill in trading gap fill stocks isn't just finding a gap; it's correctly identifying its type. A Common Gap invites a fade, while a Breakaway Gap warns you to get on board or stay away." – ChartsWatcher Research Team
Profit targets are typically set at two levels: the half-gap fill (midpoint between the open and previous close) and the full-gap fill (the prior day's close). Selling half your position at the half-gap fill allows you to lock in profits while moving your stop-loss to breakeven. The remainder can be held for the full fill. Place stop-loss orders just beyond the day's high (for gap-up fades) or low (for gap-down fades) to manage risk. Avoid fading gaps caused by major fundamental events, like FDA approvals or unexpected earnings results, as these often signal new trends rather than reversions.
In the S&P 500, gaps larger than 0.1% fill on the same day about 59–61% of the time. However, this probability decreases to 42–43% for gaps exceeding 0.5% and just 28–33% for gaps over 1%. When fading a gap down, ensure the broader market is showing strength, as this provides a supportive environment for the stock to recover.
Breakaway-Gap Strategy
The breakaway-gap strategy involves trading in the direction of the gap, signaling the start of a strong new trend. For a gap to qualify as a breakaway, it must follow a clear consolidation pattern, such as a triangle, rectangle, or flag, and be accompanied by a significant volume surge - at least twice the average daily volume.
Stay online and closer to execution. Choose a VPS location for CME futures, New York markets, London FX, API trading, and more.
Host your platform near the market route that matters.
From $59.99/mo
After the market opens, confirm "Gap and Go" momentum by waiting for the first 5-minute candle to close above its high (for gap ups). The gap should also be large enough to break through key support or resistance levels, such as 0.4% for the S&P 500 (ES) and 0.6% for Nasdaq (NQ). If the price holds above the gap zone during the opening drive, the setup remains valid. However, if the gap fills immediately, it’s likely invalid.
An example of this strategy occurred in May 2024 with NVIDIA (NVDA). On May 23, 2024, the stock gapped up on its 4-hour chart after a consolidation phase. A breakout above $105.95 triggered an entry, and the price reached its first Fibonacci-based target of $117.83 by June 5, 2024, and a second target of $130.48 by June 14, 2024. The stop-loss was set at $95.00, just below the unfilled gap zone.
"A valid breakaway must be accompanied by a massive spike in trading volume. High volume proves that the gap wasn't a fluke, but rather a significant influx of capital." – iTrading Metrics
To manage risk, place stop-loss orders just inside the gap zone to guard against reversals. Pre-market trading (8:00–9:30 AM ET) can provide additional confirmation - if the price fades before the bell, the setup is invalid. Breakaway gaps are filled only 30–40% of the time, making them reliable indicators of strong trends.
Using Closing Prices to Confirm Trends
Closing prices are a critical indicator of a trading session's final consensus and are often shaped by institutional activity. They’re essential for identifying whether a gap or breakout signals a valid trend or a potential fakeout. When a price closes beyond a gap or consolidation range and holds that level, it confirms the strength of the trend.
To validate a trend, wait for a confirming candle (e.g., 5-minute or 1-hour) to close beyond the opening range. This ensures that the move is supported by sustained buying or selling pressure. If the price quickly returns to fill a gap, treat it as a warning sign of a fakeout rather than a continuation.
For instance, in June 2022, the SPY ETF displayed a Common Gap on its 4-hour chart. On June 21, 2022, the price gapped up to $371.68 after forming a "Spinning Top" candle. Traders used the gap as a support area and entered long positions as RSI and StochRSI indicators rose. The trade was held until July 21, 2022, when it reached the 100-day EMA at $398.87, achieving a 1:2.51 risk-reward ratio.
Set stop-loss orders based on closing levels, placing them just inside the gap zone or prior consolidation structure. If the price closes back within these levels, it likely invalidates the trend thesis. Be cautious about holding positions through earnings announcements, as closing prices can gap significantly overnight, making standard stop-losses ineffective.
Tools and Platforms for Tracking Daily Open and Close Prices
Charting Platforms for Viewing Open and Close Prices
Charting platforms provide real-time and historical data, making it easier to track daily open and close prices with precision. These tools support various chart types - like Tick, Range, Volume, and Renko - offering a clear view of price movements throughout the trading day [44, 47].
Features like Volume Profile and Footprint (Cluster) Charts are particularly useful for understanding traded volume at specific price levels. These insights can help pinpoint key support and resistance zones within the daily range. For instance, Quantower offers a free version with a 30-day trial of its advanced features. It includes tools like the History Player, which allows users to replay past sessions to test strategies for open-gap or closing trends. Quantower also supports custom algorithmic strategies using C# with Visual Studio integration. Additionally, its DOM Surface feature displays a heatmap of limit orders, adding another layer of market analysis [44, 47]. If you're looking for historical data, Quant Data offers subscription plans starting at $62.42 per month.
QuantVPS Hosting for Fast, Reliable Analysis
For traders, having fast and stable access to market data is critical - especially during the volatile opening and closing minutes. QuantVPS ensures ultra-low latency, with speeds under 0.52ms to the CME Group exchange. This eliminates delays and ensures precise price data during critical moments [48, 49]. Its Chicago-based servers reduce network travel time, ensuring data reaches you without lag [48, 49].
By hosting trading platforms and analytics tools on QuantVPS, you can keep them running 24/7, even if your local computer is off. This ensures reliable end-of-day data capture. The service boasts a 99.999% uptime SLA, so you won't have to worry about disconnections during key market events. It’s also compatible with major futures data feeds like Rithmic, CQG, dxFeed, TT, and IQFeed, providing fast and dependable market data delivery. Pricing starts at $99.99/month for the Pro plan and $189.99/month for the Ultra plan.
These tools integrate seamlessly with technical indicators, such as VWAP, which are discussed next.
Using VWAP and Moving Averages with Open-Close Data
Technical indicators like VWAP (Volume Weighted Average Price) are invaluable for analyzing open and close dynamics. VWAP resets at the start of every trading session - 9:30 AM Eastern Time for U.S. equities - and serves as a benchmark for institutional performance. For example, executing a buy order below VWAP is often considered a "good execution", as it aligns with institutional trading behavior.
"VWAP matters because institutions use it as a performance benchmark. And because institutions move the market, their behavior around VWAP creates predictable, tradeable patterns." – ChartingLens
However, VWAP can be unstable during the first 15–30 minutes of trading due to limited data. Its reliability improves as more data becomes available, usually after the first hour. Adding standard deviation bands (±1σ, ±2σ) can help identify when a price is stretched too far from its fair value.
Anchored VWAP (AVWAP) is another powerful tool. It tracks price levels from key events like the daily open, an earnings gap, or a major swing low. For example, if a stock gaps at the open, anchoring an AVWAP to the first candle can help identify where "informed money" has traded, often creating a reference point for support or resistance [31, 46].
| Feature | VWAP | Moving Averages (EMA/SMA) |
|---|---|---|
| Volume Weighting | Yes - central to the calculation | No - price-only calculation |
| Institutional Use | High - used as an execution benchmark | Moderate - widely watched but not a benchmark |
| Reset Period | Daily (or at a specific anchor point) | Continuous - never resets |
| Primary Use | Intraday Trading | Swing/Position Trading |
| Reliability | Increases throughout the trading day | Built on historical data from the start |
VWAP, combined with the high and low of the first 5, 15, or 30 minutes of trading, can help generate high-probability Opening Range Breakout (ORB) signals. This strategy works best with high-volume stocks (over 1 million shares traded daily) where institutional algorithms are active. For gap-up or gap-down scenarios, anchoring an AVWAP to the event that caused the move can reveal the reference price around which the market adjusts overnight activity.
Conclusion
Daily open and close prices reveal a lot about market dynamics. The opening price sets the stage for the day, while the closing price reflects the collective decision of all market participants by the end of the session. Together, these metrics capture both the immediate and overnight reactions of the market.
For traders, understanding these metrics can provide a real advantage. For example, if the closing price is significantly higher than the opening or lands in the top 25% of the day’s range, it’s a clear sign that buyers were in control during that session. Spotting these trends helps traders filter out random market noise and focus on meaningful price movements.
The numbers back this up. In-range opens revisit the prior day’s closing price around 71–73% of the time. Similarly, gap-down sessions return to the previous low 65–69% of the time. However, when gaps exceed 1%, it suggests a major shift in market behavior, with touch rates dropping to just 7–21%. These statistics highlight the importance of timing and precision in trading.
For strategies like overnight mean reversion, execution speed is critical. Trades often need to be completed within 1 to 5 minutes to maintain the strategy’s edge. This is where QuantVPS hosting becomes essential, ensuring systems can handle the intense volatility and volume spikes that occur during the market’s open and close without interruptions or delays.
FAQs
How can I tell if a gap is likely to fill or run?
When deciding if a gap will fill or continue to expand, you need to look at its size, context, and historical trends. Smaller gaps - those that are less than 20% of the prior day's range - tend to fill relatively quickly. On the other hand, larger gaps - those exceeding 40% - are less likely to close within the same trading session. To make a well-rounded assessment, consider key factors like market sentiment, overall volatility, and the specific reason behind the gap, such as breaking news or earnings reports.
What’s the simplest way to use the close to confirm a trend?
When trying to spot a trend, one of the easiest methods is to compare the close to the open. If the close ends up near the opposite extreme of where the market opened, it often signals a trend day with strong momentum in that direction. This insight can give traders a clearer sense of market sentiment and the likely direction of movement.
When should I rely on VWAP vs anchored VWAP for open-close setups?
The Volume Weighted Average Price (VWAP) is a handy tool for intraday traders. Since it resets daily, it captures the session's average price, factoring in trading volume. This makes it ideal for gauging market sentiment and spotting dynamic support or resistance levels during the trading day.
On the other hand, Anchored VWAP is more suited for long-term analysis or event-specific insights. By starting from a specific point, such as the release of major news or an earnings report, it tracks the volume-weighted average price over time. This approach helps traders evaluate how the market reacts to significant events or trends.


