
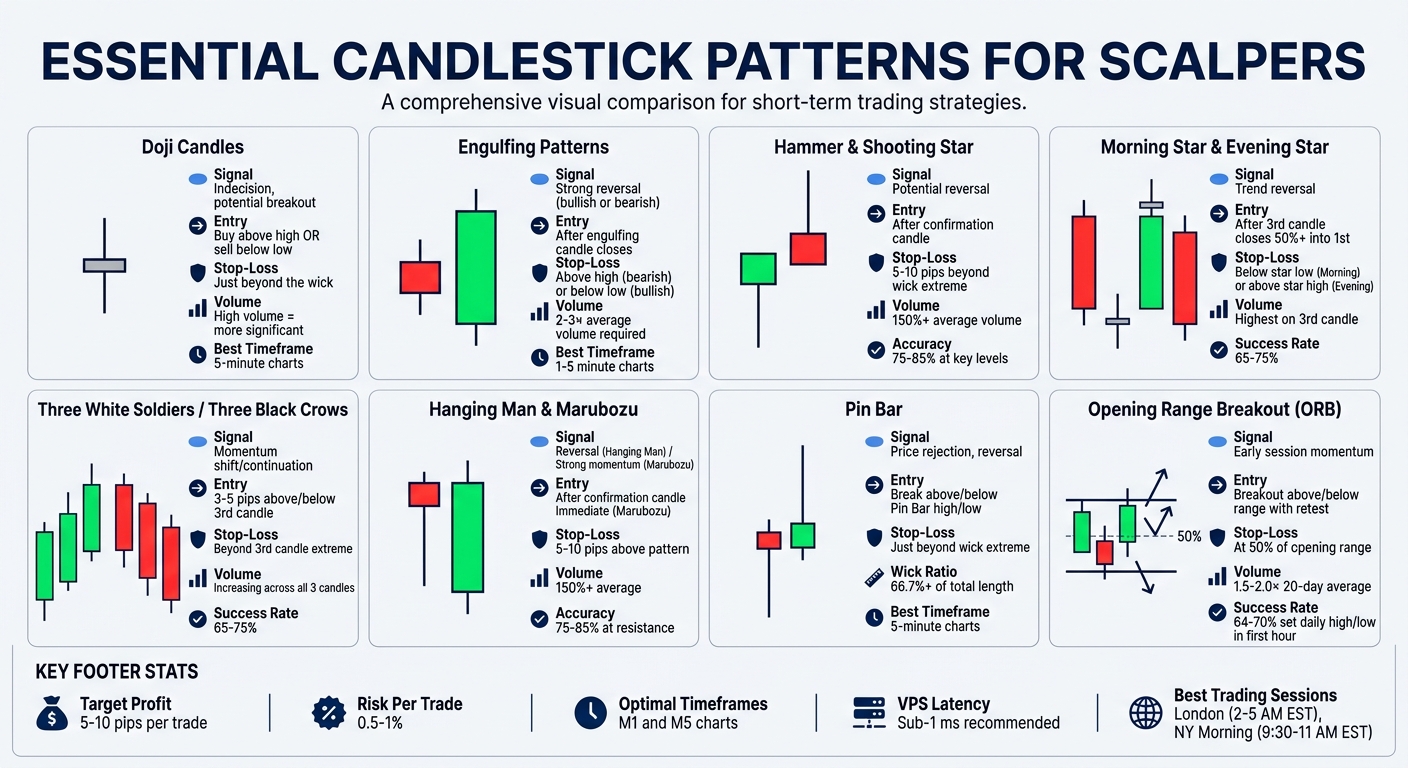
Scalping demands quick decisions and precise execution. Candlestick patterns are a scalper's go-to tool for spotting price movements in real-time. This guide highlights key patterns like Doji, Engulfing, Hammer, and Pin Bar to help you identify reversals, continuations, and momentum shifts on 1-minute (M1) and 5-minute (M5) charts. Here's what you need to know:
- Doji Candles: Signal indecision; wait for breakouts above/below the wick for confirmation.
- Engulfing Patterns: Indicate strong reversals; require volume spikes for validation.
- Hammer & Shooting Star: Show potential reversals; context matters (trend direction).
- Morning/Evening Star: Three-candle formations signaling trend changes; volume confirms reliability.
- Three White Soldiers/Black Crows: Highlight momentum shifts; increasing volume is key.
- Pin Bars: Indicate rejections at support/resistance; wick-to-body ratio is important.
- Opening Range Breakout (ORB): Captures early session momentum; align trades with volume and VWAP. You can also explore other top day trading indicators to refine your strategy.
Fast execution is critical. Using one of the best VPS for Forex trading close to your broker's server ensures trades execute without delays, minimizing slippage. Combine these patterns with tight risk management, such as stop-loss orders, and you're set for scalping success.
8 Essential Candlestick Patterns for Scalping: Visual Guide with Entry Signals
1. Doji Candles
A Doji forms when the opening and closing prices are nearly identical, creating a candle with a very small or nonexistent body. It often appears as a plus sign or cross on the chart, symbolizing a balance between buyers and sellers, with neither side taking control.
Relevance to Scalping Strategies
For scalpers, a Doji can signal a moment of indecision in the market that often leads to a breakout. However, it’s important to note that a Doji alone isn’t a trading signal - it’s what happens next that matters. As ChartSnipe explains:
"A doji is the market holding its breath. What matters is what comes next."
To capitalize on this, traders can wait for a breakout. This means buying above the high or selling below the low of the Doji, with a stop-loss set just beyond the wick. When multiple Dojis form in succession, they may create a compression zone, which often precedes a sharp price movement.
Effectiveness in Identifying Reversals or Continuations
Different types of Dojis can indicate potential reversals or continuations, depending on their context. For example:
- A Dragonfly Doji, with a long lower shadow, often signals a bullish reversal when found at a support level.
- A Gravestone Doji, with a long upper shadow, may suggest a bearish reversal at resistance.
However, these signals require confirmation from a strong follow-through candle. Without this confirmation, the Doji’s implications remain uncertain.
Volume Confirmation as a Key Indicator
Volume is critical in determining whether a Doji is meaningful or just market noise. High volume during the formation of a Doji suggests that many participants were active, yet the price remained unchanged - a strong signal of indecision. As ChartSnipe points out:
"A doji on above-average volume is far more significant than one on low volume. High volume means that many participants were active during the session and still could not move the price."
This makes volume spikes an essential factor when evaluating Dojis.
Applicability to Short Timeframes (1–5 Minutes)
On shorter timeframes, such as 1-minute charts, Dojis can often reflect random market noise. However, on 5-minute charts, they tend to provide more reliable signals, especially when they appear after sustained trends or at key support and resistance levels. Scalpers should use tight stop-loss orders: just below the lower wick for bullish setups and just above the upper wick for bearish setups.
Understanding these nuances of Doji candles provides a solid foundation for incorporating them into scalping strategies and sets the stage for exploring other vital day trading patterns.
2. Engulfing Patterns
After Doji candles, engulfing patterns are another essential tool for scalpers, offering a more assertive signal of market sentiment.
An engulfing pattern consists of two candles, where the second candle’s body completely covers the first. This shift visually represents a decisive market move: in a bullish engulfing, buyers take control, while a bearish engulfing shows sellers dominating. These patterns often provide clear entry points for trades.
Why Scalpers Rely on Engulfing Patterns
For scalpers, engulfing patterns act as a quick and reliable signal. They reveal a real-time change in supply and demand dynamics, making it easier to pinpoint entry and exit levels. Scalpers typically wait for the engulfing candle to close before entering a trade. To manage risk, they set tight stop-loss orders just outside the pattern’s range - above the high for bearish patterns or below the low for bullish ones.
Spotting Reversals or Continuations
Run 24/7 while you sleep. Keep bots, platforms, and trade copiers online on a dedicated VPS.
Low-latency VPS hosting for your trading platform.
From $59.99/mo
Engulfing patterns are most commonly associated with reversals. They are especially powerful when they occur at swing highs or lows, major support or resistance levels, or near Fibonacci retracement zones. The strength of the signal increases when the second candle’s body is significantly larger than the first, showing strong momentum behind the move.
The Role of Volume in Confirmation
Volume is a critical factor in confirming the validity of engulfing patterns. A reliable signal typically requires the volume to be at least twice the average, with the strongest signals showing a threefold increase. Without this volume spike, the pattern is more prone to being a false signal. This volume confirmation is particularly important for scalpers operating in fast-paced markets.
Best for Short Timeframes (1–5 Minutes)
Engulfing patterns work well on 1-minute and 5-minute charts because they capture quick momentum shifts. However, these short timeframes can also amplify market noise. To reduce false signals, scalpers should focus on patterns forming near key levels like support, resistance, and moving averages. A volume spike accompanying the pattern can further validate the trade. By combining engulfing patterns with tight stops and volume analysis, scalpers can capitalize on brief but lucrative opportunities, similar to their approach with Doji candles.
3. Hammer and Shooting Star
The Hammer and Shooting Star are single-candle patterns that signal potential reversals by highlighting price rejection. A Hammer typically forms at the bottom of a downtrend, featuring a small body and a long lower wick - at least twice the size of the body. This indicates that while sellers initially pushed prices lower, buyers stepped in with significant strength. On the flip side, the Shooting Star appears after an uptrend, showcasing a long upper wick. This pattern suggests that buying momentum is fading and sellers are starting to dominate.
Relevance to Scalping Strategies
These patterns are particularly useful for scalping due to their frequent appearance on shorter timeframes, like 1-minute or 5-minute charts. They provide clear entry and exit points, with the wick's extreme offering a logical level for stop-loss placement - below the Hammer's low or above the Shooting Star's high. This precision is crucial when trading with leverage. As Tomas Lindberg from FXNX points out:
"A Hammer is only a Hammer at the bottom of a downtrend. A Shooting Star is only a Shooting Star at the top of an uptrend".
However, these patterns lose significance in sideways or consolidating markets, where their predictive power diminishes. Understanding this limitation helps traders use them effectively alongside candlestick tools and setups.
Effectiveness in Identifying Reversals
For these patterns to act as reliable reversal signals, they must appear in the right market context - Hammers at the end of downtrends and Shooting Stars at the end of uptrends. Confirmation comes from the next candle closing above the Hammer’s high or below the Shooting Star’s low. Aggressive scalpers might enter immediately after confirmation, while more cautious traders often wait for a minor pullback to improve the risk-to-reward ratio. Backtesting results further support the reliability of these patterns in identifying reversals.
Volume Confirmation as a Key Indicator
Volume plays a crucial role in filtering out false signals. A volume spike exceeding 150% of the average suggests strong institutional involvement, increasing the likelihood of a sustained move. For example, a Hammer or Shooting Star accompanied by such a volume surge indicates that institutional traders - or "smart money" - are driving the reversal. On the other hand, low volume during pattern formation may signal weak market conviction, making the pattern more likely to fail. Studies show that Hammer and Hanging Man patterns achieve accuracy rates of 75–85% when they align with key support or resistance levels.
Applicability to Short Timeframes (1–5 Minutes)
These patterns are particularly effective on 1-minute and 5-minute charts, where they appear frequently. Their simplicity allows for quick decision-making in fast-paced markets. To maximize effectiveness, focus on patterns that align with higher timeframe trends, such as a 1-minute Hammer forming near a 15-minute support level. For added precision, place stop-loss orders 5–10 pips beyond the wick's extreme to account for volatility. These formations are most reliable when they occur at significant support or resistance levels, trendline touches, or after an extended price move. Mastering these patterns sets the stage for diving deeper into candlestick strategies tailored for scalping.
4. Morning Star and Evening Star
The Morning Star and Evening Star are three-candle formations that indicate a potential trend reversal. The Morning Star shows up at the bottom of a downtrend, signaling a shift to bullish momentum, while the Evening Star appears at the top of an uptrend, suggesting a bearish reversal [20, 22]. These patterns consist of three key components: a long candle, a small-bodied star, and a confirming candle that closes at least halfway into the body of the first candle [20, 21].
Jasper Osita, Market Analyst at ACY Securities, explains these patterns with a vivid analogy:
"It's like a courtroom trial: The first lawyer dominates (first candle). The judge pauses the case to hear both sides (doji). The other lawyer drops evidence so strong that the jury flips (3rd candle)."
Relevance to Scalping Strategies
For scalpers, these patterns are particularly useful because they include built-in confirmation. Unlike single-candle setups that often require additional validation, the third candle in the Morning or Evening Star serves as the "confirmation candle", signaling a clear momentum shift within the pattern itself [20, 21]. A valid pattern requires the third candle to close at least 50% into the body of the first candle, with deeper penetration indicating a stronger signal [21, 24]. These formations become even more effective when they occur after a liquidity sweep or at key institutional price levels, such as previous session highs or lows. In these cases, they can trap breakout traders before the market reverses direction.
Volume Confirmation as a Key Indicator
Volume plays a critical role in confirming the reliability of these reversal patterns. Ideally, the first candle should show moderate to high volume, reflecting the strength of the current trend. The star candle, on the other hand, typically has lower volume, indicating market indecision or exhaustion. The third candle should then display the highest volume of the three, confirming strong participation in the new trend direction. However, unusually high volume on the star candle can be a red flag, as it may signal a continuation of the current trend rather than a reversal [21, 23]. When combined with volume analysis and identified at liquidity zones or significant support or resistance levels, Morning and Evening Star patterns achieve success rates of 65–75%.
Applicability to Short Timeframes (1–5 Minutes)
On short timeframes, such as 1-minute to 5-minute charts, stricter volume confirmation is essential to filter out intraday noise. It's critical to wait for the third candle to close completely before entering a trade - entering mid-pattern can lead to false signals. For risk management, place stop-loss orders below the low of the star candle in a Morning Star setup or above the high in an Evening Star setup [21, 23]. If the reversal pattern fails to generate meaningful follow-through within 3–5 candles after completion, it's wise to exit the trade, as strong reversals typically show immediate momentum.
5. Three Black Crows and Three White Soldiers
These formations highlight momentum shifts that are especially useful for scalpers looking to identify strong trends.
The Three White Soldiers and Three Black Crows patterns consist of three consecutive long-bodied candles moving in the same direction. For Three White Soldiers, each green candle opens within the previous candle's range and closes higher, signaling bullish momentum. On the flip side, Three Black Crows are made up of three red candles that open within the prior candle's range and close lower, indicating bearish strength. These patterns represent a clear shift in market momentum, making them valuable tools for scalpers aiming to capitalize on emerging trends.
Relevance to Scalping Strategies
Although often considered reversal patterns, scalpers frequently use these formations as continuation signals in fast-moving markets. For example, after a breakout, the appearance of these patterns can confirm sustained momentum. A recent study of gold futures (GC) after a major trendline breakout revealed that the Three White Soldiers pattern confirmed strong and aggressive bullish momentum. To improve accuracy, scalpers should look for these patterns at key structural levels.
For execution:
- Three White Soldiers: Place a buy stop 3 to 5 pips above the high of the third candle.
- Three Black Crows: Place a sell stop below the low of the third candle.
Monitoring volume trends is equally important to validate these setups.
Volume Confirmation as a Key Indicator
Volume plays a critical role in confirming these patterns. The ideal scenario involves increasing volume across all three candles, with the third candle showing the highest volume, which signals strong market commitment. If volume decreases while the patterns form, it may indicate weakening momentum. For example, declining volume during a series of rising candles could suggest short covering or liquidation rather than sustained buying or selling pressure. When these patterns align with key structural levels and increasing volume, their success rate ranges between 65–75%.
Applicability to Short Timeframes (1–5 Minutes)
On shorter timeframes, such as 1-minute or 5-minute charts, these patterns can help filter out market noise caused by isolated candles. However, trading them on ultra-short timeframes requires caution. As trader Roger warns:
"If you try to trade these on a 1-minute or 5-minute chart, you're going to get chopped up by noise. These are macro-reversal patterns - treat them with respect".
To avoid overextending into risky trades, wait for a retracement to the high or low of the initial candles before entering. This often provides a higher-probability setup, crucial for scalpers. Stops should be placed just beyond the third candle's extreme to manage risk effectively. A clean pattern typically features minimal wicks and closes near the high (for soldiers) or low (for crows). Longer wicks, especially on the third candle, could signal exhaustion or opposing pressure, reducing the likelihood of a clear continuation.
6. Hanging Man and Marubozu
The Hanging Man and Marubozu patterns are key indicators of potential reversals and ongoing momentum in fast-moving markets.
The Hanging Man typically appears at the end of an uptrend. It features a small upper body and a long lower wick that’s 2–3 times the body’s length. This shape reveals that, while buyers managed to push the price back up, there was significant selling pressure during the session. In contrast, the Marubozu has a large body with little to no wicks, reflecting strong momentum and control from the market open to close. As StockCharts explains:
"The long black candlestick and black marubozu signify sustained selling pressure from open to close".
Both patterns demand quick action and proper validation, making them effective tools for scalping strategies.
Stay online and closer to execution. Choose a VPS location for CME futures, New York markets, London FX, API trading, and more.
Host your platform near the market route that matters.
From $59.99/mo
Effectiveness in Identifying Reversals or Continuations
The Hanging Man suggests potential bearish reversal patterns, but this signal becomes reliable only when the next candle closes below its body. A Black Marubozu, on the other hand, indicates strong and immediate selling pressure. Hammer-like patterns such as the Hanging Man show accuracy rates between 75–85% when confirmed near key resistance levels. However, relying solely on a Hanging Man is risky - it needs additional confirmation. For a Marubozu, traders often act immediately after the candle closes, given the clear momentum.
Volume Confirmation as a Key Indicator
Volume plays a crucial role in validating these patterns. High volume (at least 150% of the average) strengthens the reliability of both patterns. For the Hanging Man, increased volume on the confirmation candle further supports the bearish signal. On the flip side, low volume during the pattern’s formation might indicate weak conviction, increasing the chance of a fakeout where the previous trend continues. Just like with Doji and Engulfing patterns, volume confirmation is essential for making informed trading decisions.
Applicability to Short Timeframes (1–5 Minutes)
When applied to 1-minute and 5-minute charts, these patterns can cut through market noise and provide clear insights into sentiment shifts. Scalpers often aim for small gains of 5–10 pips per trade on these timeframes. Stop-loss orders are typically placed just beyond the pattern’s extreme - 5–10 pips above the Hanging Man or Marubozu. These patterns are most effective when they appear at significant support or resistance levels or near psychological round numbers.
7. Pin Bar
The Pin Bar is a standout candlestick pattern that scalpers rely on for spotting reversals and momentum shifts. This formation features a small body with a long wick - usually 2–3 times the size of the body - indicating price rejection and a potential change in market direction. For scalpers, Pin Bars are especially useful when they appear at critical levels like support, resistance, or moving averages, signaling possible trend reversals or exhaustion points.
Relevance to Scalping Strategies
Pin Bars provide a straightforward visual cue, making them ideal for the quick decision-making required in scalping. A bullish Pin Bar, similar to a Hammer, forms at support with a long lower wick, showing that buyers have gained control after sellers pushed prices lower. On the other hand, a bearish Pin Bar, resembling a Shooting Star, appears at resistance with a long upper wick, signaling seller dominance. These patterns also simplify risk management, as traders can place stop-loss orders just beyond the wick's extreme. As Risen.so explains:
"A pin bar rejection at support with a volume spike means serious money defended that level".
This clarity makes Pin Bars a powerful tool for scalpers seeking precise entry and exit points.
Effectiveness in Identifying Reversals or Continuations
The effectiveness of a Pin Bar is often tied to its wick-to-body ratio. A strong Pin Bar typically has a wick that makes up at least two-thirds (66.7%) of the total candlestick length. Context is equally important. For instance, a bullish Pin Bar during a pullback in an uptrend often signals a high-probability trade setup. However, the same pattern in a downtrend might only indicate a temporary bounce. Avoid trading Pin Bars that appear in mid-range or consolidation zones, as these are prone to false signals.
Volume Confirmation as a Key Indicator
Volume plays a crucial role in distinguishing reliable Pin Bars from false signals. Look for Pin Bars accompanied by a noticeable volume spike compared to previous candles, as this suggests institutional activity and validates the price rejection. Conversely, Pin Bars formed on low volume should be approached with caution, as they are less likely to reflect meaningful market activity.
Applicability to Short Timeframes (1–5 Minutes)
While Pin Bars can be used across different timeframes, they are most effective on 5-minute charts for scalping and day trading. Be cautious with 1-minute charts, as they often produce more noise than actionable signals. For better reliability, use the 5-minute or 15-minute charts as your baseline for analysis. Additionally, align the Pin Bar signal with the trend on higher timeframes, such as the 1-hour or 4-hour chart, to confirm its validity. Before entering a trade, wait for the price to break above the high of a bullish Pin Bar or below the low of a bearish Pin Bar to ensure the rejection has follow-through.
8. Opening Range Breakout Candles
Opening Range Breakout (ORB) candles form during the first 5–30 minutes of a trading session. For scalpers, these levels are critical because they reflect where institutional orders and market makers establish the session's fair value. As GrandAlgo puts it:
"The opening range is not just a box - it is a liquidity pool. The range high and low are levels where stop losses accumulate."
This initial range serves as a foundation for precise, volume-backed trade entries, which are explored further below.
Relevance to Scalping Strategies
For scalpers aiming for quick trades, identifying these levels is essential. The 5-minute ORB, in particular, provides frequent signals that resolve quickly. A breakout above the range high points to bullish momentum, while a drop below the range low indicates bearish intent. These breakout levels often act as the session's key support or resistance. Data shows that 64% of Nifty and 70% of Bank Nifty trading days set their daily highs or lows within the first hour. This statistical insight gives scalpers a distinct edge when making rapid decisions.
Volume Confirmation as a Key Indicator
Volume is a critical factor in validating breakouts. Look for volume that is at least 1.5× the 20-day average; a spike of 2.0× or more indicates strong conviction. As Trends and Breakouts explains:
"I think of volume on any given candle as a receipt for that bar only... A receipt from last Tuesday does not pay for today's groceries."
For example, on April 8, 2026, NVDA broke above a four-day base at $178.00. However, the breakout volume was only 0.86× the 20-day SMA. Because it failed the 1.5× volume rule, the breakout turned into a trap and eventually failed. With ORB setups, always confirm breakouts with a quick retest of the range boundary. Additionally, align trades with institutional fair value by only taking long breakouts above the Volume Weighted Average Price (VWAP) and short breakouts below it.
Applicability to Short Timeframes (1–5 Minutes)
Scalpers often rely on 1-minute charts for pinpoint execution, enabling them to act as soon as a breakout occurs or during a micro-retest of the range boundary. These short timeframes also capture forced liquidations triggered by clustered stop losses. However, ORB works best as a morning strategy. If a clean breakout and retest haven’t occurred by 12:00 PM ET, the institutional edge diminishes. For risk management, place stop losses at the midpoint (50%) of the opening range rather than the opposite extreme to maintain a favorable risk-reward ratio. Mastering ORB candles also complements the candlestick strategies discussed earlier in this guide.
Timeframes and VPS Requirements for Scalping
Scalpers typically focus on 1-minute (M1) and 5-minute (M5) charts to capitalize on small price movements, usually in the range of 5–10 pips. Among these, the 5-minute chart is often preferred because it strikes a balance - it filters out the excessive noise of 1-minute charts while still offering multiple trading opportunities within a session.
Speed of execution is absolutely critical in scalping. For instance, on a 1-minute chart, even a two-bar delay (just 2 minutes) can render a setup useless. In fast-moving markets, even minor delays can lead to significant slippage. To put it into perspective, a difference between a 1 ms execution time and a 150 ms execution time can result in 1–2 pips of slippage. Over 30 trades, this could add up to a loss of 30–60 pips in a single session.
Given the need for rapid execution, a Virtual Private Server (VPS) is essential, and its capacity should align with the number of charts and indicators you monitor. Here are some VPS options to consider:
- QuantVPS Lite: Ideal for 1–2 charts with basic indicators, offering 4 cores and 8 GB of RAM for $59.99/month.
- QuantVPS Pro: Suitable for 3–5 charts across M1, M5, and M15 timeframes, with 6 cores and 16 GB of RAM at $99.99/month.
- QuantVPS Ultra: Designed for 5–7 charts or setups with heavy indicators, featuring 24 cores and 64 GB of RAM at $189.99/month.
- Dedicated Server: Best for 7+ charts or high-frequency tick scalping, providing 16+ cores and 128 GB of RAM for $299.99/month.
Server location is another crucial factor. Choosing a VPS server close to your broker's matching engine can help achieve sub-1 ms latency. For instance, if you're trading with brokers like IC Markets or Oanda, a New York-based VPS is ideal. On the other hand, if your broker is LMAX or Darwinex, a London-based server works best. Proximity matters because every 200 kilometers of distance can add approximately 1 ms of latency.
This becomes especially important during high-liquidity periods, often referred to as "Kill Zones", such as the London session (2:00–5:00 AM EST) and the New York morning session (9:30–11:00 AM EST). During these times, when market activity is at its peak, every millisecond can make a difference.
Conclusion
Mastering candlestick patterns like Doji, Engulfing, Hammer, Pin Bar, and Three White Soldiers sharpens your scalping strategy. These patterns provide a quick snapshot of market sentiment, showcasing the tug-of-war between buyers and sellers on M1 and M5 charts.
"Scalping lives and dies by price action. Candlesticks are price action, distilled into an easy-to-understand format." – Reza Bagheri, Author, Opofinance
However, even the best setups can fall victim to slippage or latency, which can eat into the slim profit margins scalpers aim for - usually around 5–10 pips per trade. Using one of the top Forex VPS solutions located near your broker's matching engine minimizes latency, ensuring trades execute at the price you expect. This is especially critical when acting on patterns like a Hammer at support or an Engulfing pattern at resistance. Downtime or platform freezes during an active scalping session can turn a winning opportunity into a missed one.
Once you've mastered candlestick recognition, syncing your execution speed with high-performance VPS infrastructure completes the equation for successful scalping. Pairing sharp pattern analysis with low-latency hosting and disciplined risk management (keeping risk at 0.5%–1% per trade) builds a solid foundation for consistent profitability.
FAQs
How do I avoid false candlestick signals on the 1-minute chart?
To reduce the likelihood of false signals on the 1-minute chart, try using confirmation techniques like multi-timeframe analysis. This involves validating patterns on higher timeframes to ensure they align with the bigger picture.
You can also keep an eye on volume and momentum indicators, such as the Relative Strength Index (RSI), to gauge the strength behind potential moves. Pair these tools with candlestick patterns - like doji or engulfing formations - and check whether they align with the overall trend. This combination can help you filter out fakeouts and make more precise trading decisions.
What volume rules should I use to confirm these patterns?
To validate candlestick patterns like engulfing or reversal setups, pay attention to volume spikes or a noticeable increase in volume near key support or resistance levels. When volume rises, it indicates stronger market participation, which makes these patterns more dependable. This is particularly crucial in scalping, as volume confirmation helps pinpoint high-probability setups and improves both the timing and precision of trades.
How do I set stops and targets for scalping with candlesticks?
When setting stop-loss orders, place them just beyond the recent swing high or low, depending on the candlestick pattern and the direction of your trade. For profit targets, aim for a risk-to-reward ratio, such as 1:1 or 2:1. Use key levels like prior support or resistance, or areas where the price is likely to reverse. Make sure your stop-loss and profit targets are in sync with market volatility and fit within your overall risk management plan.


