
Swing Failure Patterns (SFPs) help identify fake breakouts in price action, where prices briefly break key levels before reversing sharply. This strategy is designed to spot liquidity grabs by larger players, allowing traders to capitalize on reversals instead of falling victim to false moves. Here's what you need to know:
- What is an SFP? It occurs when prices break a previous swing high/low but fail to hold and close back within the range, signaling a reversal.
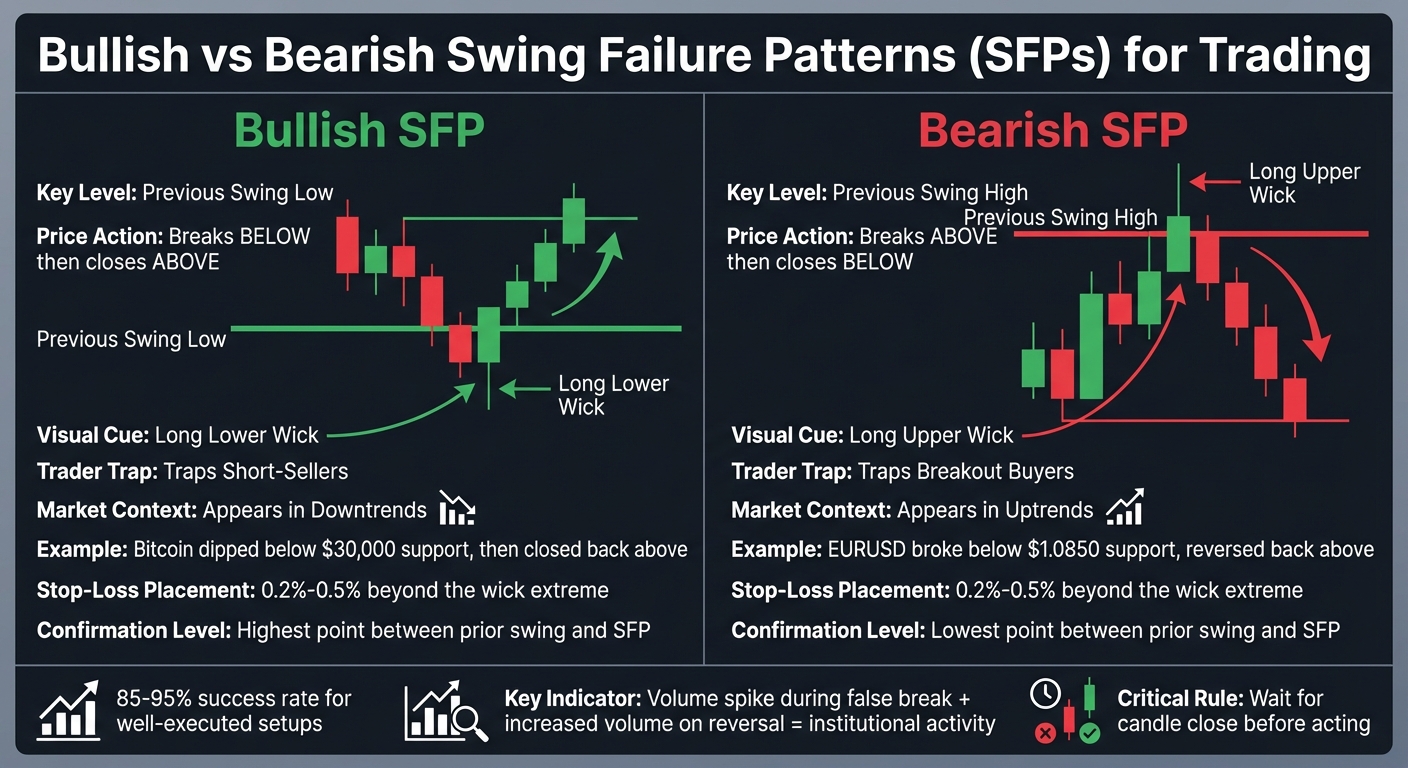
- Why does it matter? Fake breakouts trigger stop-losses, often leading to losses for retail traders. SFPs offer a chance to trade reversals with success rates of up to 85–95% in well-executed setups.
- How to spot SFPs: Look for a wick breaking a key level, followed by a candle closing back within the range. Volume spikes and rejection wicks are key indicators.
-
Types:
- Bullish SFP: Price dips below a swing low, then reverses upward.
- Bearish SFP: Price spikes above a swing high, then reverses downward.
- Risk management: Use tight stop-losses beyond the wick and aim for risk-reward ratios of at least 1:2 or 1:3.
SFPs rely on quick reversals, so precise execution and volume analysis are essential. Tools like RSI divergence, volume confirmation, and multi-timeframe validation can improve accuracy. Pairing this strategy with fast execution platforms ensures you don’t miss these sharp reversals.
How to Spot Swing Failure Patterns
Bullish vs Bearish Swing Failure Patterns: Visual Comparison Guide
A Swing Failure Pattern (SFP) happens when the price breaks a key level but then quickly reverses, closing back within the prior range. This reversal signals a false breakout. The key to identifying an SFP is recognizing when the market has swept liquidity at a swing point and rejected the move.
This differs from a true breakout, where the candle body closes beyond the level and holds its position.
"The 'failure' in a Swing Fail Pattern occurs when institutions have gathered sufficient liquidity and begin moving price in their intended direction." - Market Experts Trading
Volume is a crucial factor in confirming SFPs. A spike in volume during the false break, followed by increased volume on the reversal, often indicates institutional activity. Always wait for the candle to close before acting - jumping in too early during the sweep can lead to misjudging the signal.
Now, let’s break down how bullish and bearish SFPs form under different market conditions.
Bullish Swing Failure Patterns
Bullish SFPs tend to appear in downtrends. They occur when the price briefly dips below a prior swing low but then reverses sharply, closing back above that level. This signals that buyers have absorbed the selling pressure and are ready to take control.
Here’s the typical setup: the price approaches a significant swing low where retail stop-losses are likely clustered. It dips below this low, triggering stops and causing a volume spike. However, the breakdown doesn’t hold, and the candle closes above the swing low with a long lower wick, showing that selling pressure has been absorbed.
Run 24/7 while you sleep. Keep bots, platforms, and trade copiers online on a dedicated VPS.
Low-latency VPS hosting for your trading platform.
From $59.99/mo
For example, Bitcoin once dipped below the $30,000 support level, sweeping liquidity in the process. It then closed back above the level, confirming a bullish SFP.
To manage risk, place a stop-loss at the extreme of the sweep candle’s wick. Use the highest point between the prior swing and the SFP as your confirmation level.
Bearish Swing Failure Patterns
Bearish SFPs occur in uptrends. These patterns emerge when the price breaks above a prior swing high but is then rejected, closing back below that level. This indicates that sellers have rejected the higher prices and are taking control.
In this scenario, the price moves toward a significant swing high where buy-stop orders are concentrated. It spikes above this high, triggering those orders and causing a volume surge. However, the rally falters, and the price closes below the swing high, forming a long upper wick that visually signals rejection.
A practical example comes from the EURUSD pair, as highlighted by Market Experts Trading. During a London session, the price broke below major daily support at $1.0850 with high volume, only to reverse and close back above the support within three candles on even higher volume. In such setups, stop-losses should be placed at the extreme of the sweep candle’s wick, with the lowest point between the previous swing and the SFP serving as the confirmation level. These well-executed SFP setups reportedly achieve success rates of 85–95%.
The rejection of the swing high in a bearish SFP creates a strong foundation for trade entries, which will be covered in the next section.
| SFP Type | Key Level | Price Action | Visual Cue | Trader Trap |
|---|---|---|---|---|
| Bullish | Previous Swing Low | Breaks below then closes above | Long lower wick | Traps short-sellers |
| Bearish | Previous Swing High | Breaks above then closes below | Long upper wick | Traps breakout buyers |
Trading Strategies for SFP Setups
Entry and Exit Rules
Once you've identified an SFP (Swing Failure Pattern), it's time to set clear rules for entering and exiting trades. The key is to wait for the breakout candle to close back within the range before making a move. This close acts as confirmation of the SFP. The most reliable entry point is at the opening price of the candle immediately following this confirmation.
Some traders prefer a two-step entry approach: placing one entry as soon as the SFP candle closes and another when the price breaches the confirmation level.
For stop-loss placement, aim for 0.2% to 0.5% beyond the wick of the failed breakout candle. As for exits, you can target the nearest opposite swing, take partial profits at mid-range, or use the trading range boundary as your final exit point. Backtesting on Bitcoin's 4-hour chart revealed that combining candle close confirmation with a minimum risk-reward ratio of 1:2 increased win rates from 45%-55% to approximately 55%-60%.
Risk Management Basics
Keep your risk controlled by limiting it to 1%-2% of your account balance. For example, if you have a $10,000 account, this means risking $100-$200 per trade.
Your risk-reward ratio should align with your trading timeframe. Intraday setups, such as those on 15-minute or 1-hour charts, generally offer ratios of 1:1 to 2:1. Meanwhile, swing trades on 4-hour or daily charts often provide ratios of 2:1 to 3:1. For hourly charts, using a 24-period ATR (Average True Range) can help you set stop-losses that adapt to daily volatility.
To further manage risk, consider taking partial profits at key levels to reduce exposure. Using trailing stops as the trade moves in your favor can also protect gains, especially during highly volatile sessions when SFPs can lead to sharp price movements.
Tools for Confirming SFP Setups
Technical Indicators for Confirmation
To effectively distinguish genuine reversals from traps in the SFP pattern, confirmation signals are essential. One of the most reliable tools for this is RSI divergence. For example, in a bearish SFP, if the price creates higher highs while the RSI forms lower highs, it signals momentum exhaustion. This phenomenon, known as a Failure Swing Top, occurs when the price hits a new high, but the RSI fails to surpass its previous peak and then drops below a critical level.
Another key tool is volume analysis, which adds depth to the confirmation process. Pay attention to the volume outside the swing level compared to the candle's total volume. If this volume is less than 25% of the candle's total, it indicates a weak breakout. On the other hand, a surge in volume during the reversal phase - rather than during the breakout - often signals institutional activity.
A confirmation level acts as a structural benchmark. For bullish SFPs, this is the highest point between the previous swing and the SFP candle, while for bearish setups, it’s the lowest point. A close beyond this level confirms the reversal. To refine signals further, traders often use wick percentage filters, requiring the candle wick to represent a specific percentage of the candle's total range, which helps eliminate weaker setups.
In addition, multi-timeframe validation strengthens SFP signals. For instance, if a high-timeframe pivot (like the Daily chart) is swept and then confirmed on a lower timeframe (such as the 4-hour or 1-hour chart), the reliability of the SFP increases significantly. Many professional traders assign quality scores to SFP setups, considering factors like Reversal Speed (30%), Break Cleanliness (25%), Volume Pattern (25%), and Market Context (20%). "Perfect SFPs" that score between 90–100% boast success rates of 85–95%. These technical tools, when integrated, enhance the precision of SFP strategies.
Real-Time Charting with QuantVPS
Stay online and closer to execution. Choose a VPS location for CME futures, New York markets, London FX, API trading, and more.
Host your platform near the market route that matters.
From $59.99/mo
While technical indicators improve signal reliability, quick execution is just as critical when trading SFP reversals. Reversal speed, which contributes 30% to a pattern's quality score, highlights the importance of reacting swiftly. QuantVPS ensures ultra-low latency (0–1ms) and 100% uptime, enabling traders to act on "Instant Reversals" (within 1–2 candles) and "Quick Reversals" (3–5 candles) without delays or slippage. This is especially important when working across multiple timeframes, such as confirming a Weekly SFP at major resistance with a 4-Hour SFP for entry.
For advanced SFP analysis, access to detailed intrabar lower timeframe (LTF) data - up to 100,000 bars - is crucial for accurately assessing volume distribution outside key swing levels. QuantVPS handles these intensive calculations effortlessly, ensuring smooth performance even when running multiple charts. Compatible with popular platforms like NinjaTrader, MetaTrader, and TradeStation, QuantVPS ensures you stay aligned with your SFP strategy and never miss a fast-moving reversal. Its robust infrastructure supports seamless execution, giving traders the edge they need to capitalize on confirmed SFP signals without hesitation.
Adding SFP to Your Trading Plan
Backtesting the SFP Strategy
When refining your Swing Failure Pattern (SFP) strategy, backtesting is a must. Use historical data across various market conditions to see how it performs. Start by defining your Swing Length, which is the lookback period for identifying key highs and lows. This can either be a fixed number of bars (like 10 or 20) or a dynamic length based on the Average True Range (ATR), allowing you to adjust for changing volatility.
It’s also important to distinguish between different types of SFPs. A Real SFP happens when the candle's wick breaks a key level, but the body closes back within the range, signaling a strong rejection. On the other hand, a Considerable SFP involves a brief close beyond the level before reversing, which tends to be a weaker signal. Testing these types separately helps identify which works better in your preferred markets, providing clarity on win rates and overall effectiveness.
Incorporate volume filters and confirmation levels into your backtesting. Set a Volume % Threshold, requiring at least 25% of the candle’s total volume to occur outside the swing level. This ensures the liquidity grab is meaningful. Also, validate reversal levels: for bullish setups, this would be the highest point between the previous swing and the SFP candle; for bearish setups, it’s the lowest point.
Generally, higher timeframes - like 1-hour, 4-hour, or daily charts - yield more reliable signals compared to lower timeframes. Compare two entry styles: instant entries versus confirmed entries. With confirmed entries, you wait for the next candle to close in the direction of the reversal, such as a bearish candle following a bearish SFP. Additionally, document the market context for each backtested SFP. This strategy tends to perform best in low-volume, ranging markets where liquidity grabs are more frequent.
Once backtesting validates your strategy, the next step is ensuring you can execute trades quickly to take advantage of these swift reversals.
Improving Execution with QuantVPS
After backtesting your SFP strategy, quick execution becomes essential for capturing the sharp reversals that define fake breakouts. SFP setups rely on fast rejections, and executing trades quickly ensures you can enter before the trapped breakout momentum dissipates. This is where QuantVPS comes into play, offering ultra-low latency (0–1ms) and 100% uptime - ideal for trading "Instant Reversals" that often unfold within just 1–2 candles.
With NVMe storage, QuantVPS speeds up data retrieval, enabling real-time processing of indicators. Its DDoS protection ensures uninterrupted performance during high-volatility events, exactly when SFPs are most likely to appear. This is crucial since SFP indicators often analyze up to 100,000 bars of intrabar data to calculate volume outside swing levels. QuantVPS handles these intense calculations smoothly, with no lag.
Additionally, it’s fully compatible with platforms like NinjaTrader and MetaTrader 4/5, allowing you to run professional SFP scripts and automated detection tools around the clock. Whether you’re monitoring multiple timeframes or executing automated strategies based on confirmation levels, QuantVPS ensures reliable performance, helping you avoid interruptions or slippage.
Conclusion
The Swing Failure Pattern (SFP) highlights liquidity hunts where institutions trigger retail stop-loss orders, creating opportunities for savvy traders. The key is waiting for confirmation - watch for the candle to close back within the prior range before entering. As Matthias Hossp from Morpher puts it, "By recognizing this reversal signal, you could position yourself for a profitable short trade while others are caught on the wrong side of the market". Timing is everything, and precise execution is critical.
Since SFPs often reverse quickly - sometimes within just 1–2 candles - execution speed becomes a crucial factor in profitability. This is where QuantVPS excels, offering ultra-low latency (0–1ms) and a 100% uptime guarantee. Its NVMe storage ensures smooth handling of resource-intensive calculations, even when processing up to 100,000 bars of intrabar data for volume validation.
When it comes to risk management, simplicity is key: place your stop-loss just beyond the failure wick and aim for risk-reward ratios of at least 1:3. The most reliable SFPs - those with clean breaks, quick reversals, and strong volume confirmation - can deliver success rates as high as 85–95%. Incorporating volume analysis and multi-timeframe confluence helps weed out weaker setups, allowing you to zero in on high-quality, institutional-level opportunities.
With these parameters in place, running your SFP strategy on QuantVPS ensures uninterrupted performance. The platform's 24/7 operation captures alerts across multiple timeframes and assets, whether you're scalping for quick entries or swing trading for larger moves. Plus, its DDoS protection and compatibility with tools like NinjaTrader and MetaTrader provide the reliability you need during volatile market conditions.
FAQs
How do I confirm an SFP without entering too early?
To confidently identify a Swing Failure Pattern (SFP) without jumping in too soon, patience is key. Watch for a clear rejection of the false breakout. This could show up as strong reversal signs, like a bullish or bearish candle backed by significant volume or an obvious momentum shift. Instead of rushing in, wait for confirmation through decisive candle patterns - think engulfing candles or other clear reversal setups. This approach helps confirm the breakout failure and keeps your risk in check.
What’s the best timeframe for trading SFPs?
Swing Failure Patterns (SFPs) can be applied across all timeframes, making them a reliable choice for both short-term scalping and long-term trading strategies. This flexibility means traders can use SFPs effectively, no matter their trading approach or style.
How can I filter out weak SFP signals?
To improve the reliability of Swing Failure Pattern (SFP) signals, incorporate other technical analysis tools and confirmation methods into your strategy. For instance, pairing the SFP indicator with tools like the Parabolic SAR can help gauge market trends. You can also analyze overextension zones, such as 200% or 250% levels, to pinpoint areas where price reactions are more likely. Additionally, focusing on liquidity sweeps and key levels on higher time frames can strengthen signal accuracy and reduce the chances of falling for false breakouts.


