
Calculating profit and loss (P&L) in S&P 500 futures (ES & MES) boils down to understanding tick size and tick value. A tick is the smallest price movement possible. For ES (E-mini S&P 500), one tick equals $12.50, and for MES (Micro E-mini S&P 500), it’s $1.25. Both contracts move in increments of 0.25 index points. Here's the formula to calculate P&L:
P&L = (# Ticks) × (Tick Value) × (# Contracts)
Quick Facts:
- ES Contract: $50 per index point; each tick = $12.50.
- MES Contract: $5 per index point; each tick = $1.25.
- Example: A 5-point move (20 ticks) in ES equals $250 per contract, while in MES, it’s $25.
This tick-based approach ensures precise risk management, helping traders set stop-loss orders and calculate gains or losses with clarity. Whether trading ES for larger exposure or MES for finer control, knowing tick values is essential for managing your positions effectively.
Tick Size and Tick Value Basics for ES and MES
Grasping the concepts of tick size and tick value is key to calculating profit and loss (P&L) accurately when trading futures.
What is Tick Size?
Tick size refers to the smallest possible price movement for a financial instrument. For both ES (E-mini S&P 500) and MES (Micro E-mini S&P 500) contracts, the tick size is fixed at 0.25 index points.
"Tick sizes are defined by the exchange and vary depending on the size of the financial instrument and requirements of the marketplace. Tick sizes are set to provide optimal liquidity and tight bid-ask spreads." – CME Group
This means price changes occur in increments of 0.25, such as 4,500.00, 4,500.25, 4,500.50, and so on. Since each index point contains four ticks, this standardized movement ensures that P&L changes occur in consistent, predictable amounts.
What is Tick Value?
While the tick size is the same for both contracts, the tick value differs significantly. For ES contracts, one tick equals $12.50, whereas for MES contracts, one tick equals $1.25. This 10-to-1 ratio stems from the difference in their contract multipliers:
- ES: 0.25 × $50 = $12.50 (contract multiplier = $50)
- MES: 0.25 × $5 = $1.25 (contract multiplier = $5)
| Feature | E-mini S&P 500 (ES) | Micro E-mini S&P 500 (MES) |
|---|---|---|
| Tick Size | 0.25 Index Points | 0.25 Index Points |
| Tick Value | $12.50 | $1.25 |
| Value per Index Point | $50.00 | $5.00 |
| Contract Multiplier | $50 × Index | $5 × Index |
This table highlights the key differences between ES and MES contracts. For instance, a one-tick move in the ES contract results in a $12.50 change in your P&L, while the same move in the MES contract changes your P&L by just $1.25. Let’s break this down further: a 5-point move against your position would mean a $250 loss with one ES contract but only a $25 loss with one MES contract. This contrast allows traders to adjust position sizes based on their risk tolerance, rather than simply meeting margin requirements.
These fundamentals are crucial for understanding how to calculate profit and loss, which will be discussed in the next steps.
Run 24/7 while you sleep. Keep bots, platforms, and trade copiers online on a dedicated VPS.
Low-latency VPS hosting for your trading platform.
From $59.99/mo
ES and MES Contract Specifications
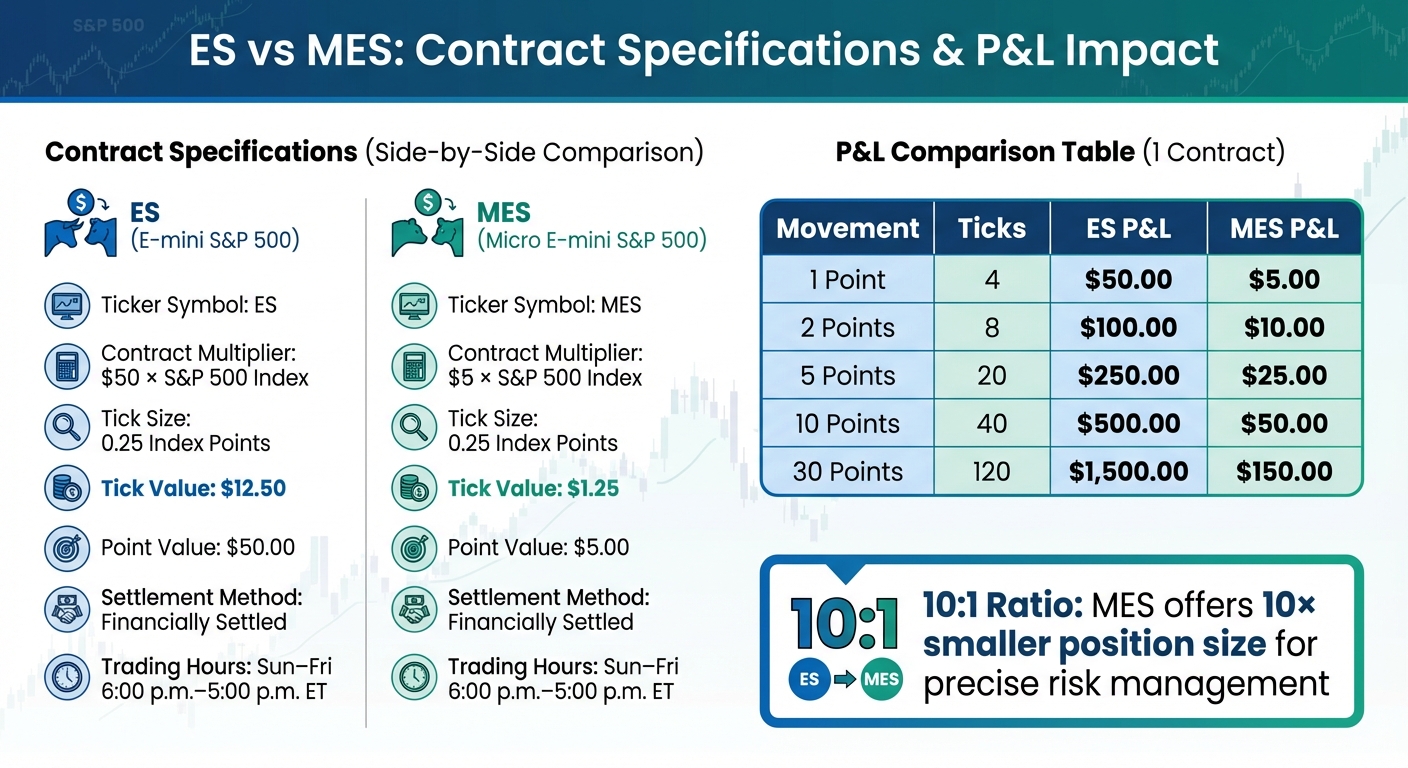
ES vs MES S&P 500 Futures Contract Specifications and P&L Comparison
Understanding the specifications of ES and MES contracts highlights the differences in dollar exposure due to their unique contract multipliers. While both share a 0.25 index point as their minimum price fluctuation, the multipliers set them apart in terms of exposure. These details are essential for grasping risk management and P&L calculations, which will be covered further along.
ES (E-mini S&P 500) Specifications
The ES contract applies a $50 multiplier, meaning every index point equals $50. Each 0.25-point tick is valued at $12.50. For instance, a 10-point move in the S&P 500 results in a $500 profit or loss per contract. ES trades on CME Globex from Sunday at 6:00 p.m. to Friday at 5:00 p.m. ET, with a daily break between 5:00 p.m. and 6:00 p.m. ET. Contracts settle quarterly in March, June, September, and December.
"ES is liquid and clean, but the tick structure forces discipline. You aren't dealing with random price increments - everything is quantized in $12.50 chunks." – Grizzly Parrot Trading
ES typically requires an initial margin of around 5%, which translates to over 20× leverage. In 2023, the ES averaged 1.81 million contracts traded daily, making it the most actively traded U.S. equity index futures contract.
MES (Micro E-mini S&P 500) Specifications
The MES contract, in contrast, uses a $5 multiplier instead of $50. This means each index point represents $5, and a 10-point move results in a $50 profit or loss per contract. While the tick size remains 0.25 points, the tick value drops to $1.25, making MES more accessible for smaller accounts or traders learning how to become a futures trader and experimenting with new strategies. MES contracts trade during the same hours as ES and follow the same quarterly settlement schedule.
| Specification | E-mini S&P 500 (ES) | Micro E-mini S&P 500 (MES) |
|---|---|---|
| Ticker Symbol | ES | MES |
| Contract Multiplier | $50 × S&P 500 Index | $5 × S&P 500 Index |
| Tick Size | 0.25 Index Points | 0.25 Index Points |
| Tick Value | $12.50 | $1.25 |
| Point Value | $50.00 | $5.00 |
| Settlement Method | Financially Settled | Financially Settled |
| Trading Hours (ET) | Sun–Fri 6:00 p.m.–5:00 p.m. | Sun–Fri 6:00 p.m.–5:00 p.m. |
This 10-to-1 multiplier provides flexibility in position sizing. For example, an 8-tick stop represents a $100 risk in ES but only $10 in MES. This makes MES particularly appealing to traders aiming to fine-tune their position sizes based on specific risk tolerances rather than simply adhering to minimum margin requirements. These specifications directly affect how dollar gains or losses are calculated from tick movements, a topic that will be explored in the next section.
How to Calculate Profit and Loss: Step-by-Step
Let’s break down how to calculate your profit and loss (P&L) using a straightforward formula:
P&L = (# Ticks) × (Tick Value) × (# Contracts)
This formula gives you your gross profit or loss before factoring in transaction costs like exchange fees and broker commissions.
Key Components:
- Number of Ticks: This measures the price movement between your entry and exit. To calculate it, subtract your entry price from your exit price and divide the result by 0.25. For example, if you enter at 5,100.00 and exit at 5,105.25, the price moves 5.25 points. Divide 5.25 by 0.25, and you get 21 ticks.
- Tick Value: For ES contracts, the tick value is $12.50, while for MES contracts, it’s $1.25. These values are outlined in the contract specifications.
- Number of Contracts: This is simply the size of your position - the total number of contracts you’re trading.
Once you calculate the gross P&L, you’ll need to account for transaction costs to get your net P&L. Remember, fees are charged per contract for both entering and exiting a trade. So, trading multiple contracts will increase these costs.
Net P&L = Gross P&L – Transaction Costs
It’s always a good idea to double-check the tick size and contract specifications on the exchange’s product page before you start trading. These details can vary depending on the futures instrument.
In the next section, we’ll walk through some practical examples to see how this formula works in action.
P&L Calculation Examples
The formula for calculating profit and loss (P&L) is straightforward: P&L = (# Ticks) × (Tick Value) × (# Contracts). Let’s break this down with some real-world trading examples for both ES and MES futures contracts.
ES Futures P&L Examples
Example 1: 4-Tick Movement (1 Contract)
If you buy one ES contract at 5,100.00 and sell it at 5,101.00 (a 1-point or 4-tick move), your gross profit is:
4 ticks × $12.50 × 1 contract = $50.00.
Example 2: 8-Tick Movement (2 Contracts)
Going long with two ES contracts at 5,200.00 and exiting at 5,202.00 (a 2-point or 8-tick move) results in:
8 ticks × $12.50 × 2 contracts = $200.00.
Example 3: 30-Point Movement (1 Contract)
A 30-point move from 5,150.00 to 5,180.00 translates to 120 ticks (30 ÷ 0.25 = 120 ticks). The gross P&L for this trade is:
120 ticks × $12.50 × 1 contract = $1,500.00.
This example highlights how the tick structure quantifies your P&L in consistent increments of tick structure quantifies your P&L in consistent increments of $12.50.2.50.
MES Futures P&L Examples
Example 1: 4-Tick Movement (1 Contract)
Buying one MES contract at 5,100.00 and selling it at 5,101.00 (a 1-point or 4-tick move) yields:
4 ticks × $1.25 × 1 contract = $5.00.
Stay online and closer to execution. Choose a VPS location for CME futures, New York markets, London FX, API trading, and more.
Host your platform near the market route that matters.
From $59.99/mo
Example 2: 8-Tick Movement (10 Contracts)
Trading 10 MES contracts, entering at 5,200.00 and exiting at 5,202.00 (a 2-point or 8-tick move), gives:
8 ticks × $1.25 × 10 contracts = $100.00.
Example 3: 30-Point Movement (1 Contract)
A 30-point move from 5,150.00 to 5,180.00 with one MES contract equals 120 ticks, resulting in: (Similar to how MNQ tick values function for Nasdaq futures.)
120 ticks × $1.25 × 1 contract = $150.00.
ES vs. MES P&L Comparison
The difference between ES and MES contracts becomes clear when comparing P&L for similar price movements. Here’s how one contract of each performs:
| Movement | Ticks | ES P&L (1 Contract) | MES P&L (1 Contract) |
|---|---|---|---|
| 1 Point | 4 | $50.00 | $5.00 |
| 2 Points | 8 | $100.00 | $10.00 |
| 5 Points | 20 | $250.00 | $25.00 |
| 10 Points | 40 | $500.00 | $50.00 |
| 30 Points | 120 | $1,500.00 | $150.00 |
The 10:1 scaling between ES and MES offers flexibility in managing positions. For instance, trading 15 MES contracts lets you fine-tune your risk more effectively than trading 1 or 2 ES contracts. This is particularly useful for smaller accounts or when controlling exposure in volatile markets. For example, a 5-point move in ES results in a $250 swing, which could be significant depending on your account size. MES contracts provide a way to manage risk more precisely.
Next, see how QuantVPS can improve your trade execution and streamline P&L tracking.
How QuantVPS Supports Futures Trading Operations
In futures trading, every millisecond counts. The difference between entering a trade at 5,100.00 versus 5,100.25 - a single tick - can directly impact your profit and loss (P&L). QuantVPS is built to close these gaps, ensuring trades are executed with precision. This seamless execution works hand-in-hand with tick-based P&L calculations, delivering real-time accuracy that traders can rely on.
QuantVPS Features for Futures Traders
Accurate P&L tracking requires a foundation of powerful technology, and QuantVPS delivers exactly that. Operating from a Chicago data center near the CME Group’s matching engines, QuantVPS offers ultra-low latency of less than 0.52 milliseconds to the exchange. The use of direct fiber-optic cross-connects minimizes network hops, ensuring lightning-fast order routing.
The platform is powered by cutting-edge AMD EPYC and Ryzen processors, paired with high-speed DDR4/5 memory, NVMe M.2 SSD storage, and a 1Gbps network capable of bursting to 10Gbps. This robust setup eliminates processing slowdowns, even during high-volatility trading sessions. With a 99.999% uptime rating, QuantVPS ensures uninterrupted operations. It supports popular futures trading platforms like NinjaTrader, TradeStation, Sierra Chart, Quantower, and Tradovate, alongside data feeds such as Rithmic, CQG, dxFeed, TT, and IQFeed.
How QuantVPS Improves Trade Execution and P&L Tracking
For futures traders, low latency futures trading execution speed is everything. As shown in P&L scenarios, even tiny delays can lead to price discrepancies that affect outcomes. QuantVPS's optimized network ensures sub-millisecond connectivity, reducing slippage. For instance, if you place an order to buy ES at 5,150.00, a delay could result in a fill at 5,150.25, altering your position instantly. QuantVPS minimizes these risks, helping executed prices align more closely with your intended entry and exit points.
Real-time P&L tracking also depends on uninterrupted, tick-by-tick market data. With its high-performance hardware and streamlined network, QuantVPS handles the constant flow of price updates, enabling your trading platform to calculate accurate position values. For traders using trade copier software for futures across multiple accounts or managing prop firm setups, the platform’s 24/7 reliability ensures synchronized execution and consistent P&L reporting. Secure remote access via Remote Desktop (RDP), complete with multi-monitor support, allows you to monitor your strategies from anywhere while the heavy lifting happens at the Chicago data center - an ideal setup for those working with firms like Apex or Bulenox.
Summary
Accurate tick-based calculations and dependable execution are essential for trading S&P 500 futures effectively.
Tick size and tick value form the foundation of S&P 500 futures profit and loss (P&L) calculations. Using the standard formula - (Number of Contracts) × (Tick Value) × (Number of Ticks Moved) - traders can manage positions with precision. This approach eliminates guesswork, allowing for better risk management, precise stop-loss placement, and a clear understanding of how price movements impact your bottom line across different instruments.
Execution reliability is just as important as calculation accuracy. Even a single tick of slippage, whether due to network issues or downtime, can cost $12.50 per ES contract or $1.25 per MES contract. Given that S&P 500 futures trade nearly 24 hours a day, five days a week, having dependable execution and real-time data processing is critical for monitoring P&L accurately.
Pairing this math-based strategy with the ultra-low latency execution offered by QuantVPS ensures that every tick matters. Always consult the contract specifications when trading, and remember to account for broker commissions and exchange fees when calculating your net profit.
FAQs
How does the tick value impact risk management when trading ES and MES futures?
Tick value plays a key role in managing risk when trading S&P 500 futures, especially with ES (E-mini) and MES (Micro E-mini) contracts. A tick represents the smallest price movement these instruments can make, and its dollar value is crucial for calculating potential profits or losses. For instance, the tick value for the ES is $12.50, while the MES has a smaller tick value of $1.25. This knowledge helps traders set stop-loss and take-profit levels that match their risk tolerance.
Tick value also aids in determining position sizes and managing leverage. Even slight price changes can lead to noticeable gains or losses, making it essential for traders to control their exposure. For example, a five-tick move in the ES could mean a $62.50 gain or loss, depending on the trade's direction. By accounting for tick value, traders can make informed decisions to manage risk effectively and avoid taking on excessive leverage.
What’s the difference between ES and MES futures contracts?
The ES (E-mini S&P 500) and MES (Micro E-mini S&P 500) contracts differ mainly in their size and tick value. Here's a quick breakdown:
- ES Contract: Its notional value is calculated as $50 times the S&P 500 index. The tick size is 0.25 index points, with each tick valued at $12.50.
- MES Contract: This is one-tenth the size of the ES, using a $5 multiplier per index point. The tick value here is $1.25.
Both contracts have the same tick increments, but their monetary exposure sets them apart. MES is a better fit for traders with smaller accounts or those aiming to manage risk more cautiously. In contrast, ES offers greater liquidity and tighter spreads, which can be advantageous for traders working with larger accounts or employing high-volume strategies.
How do I factor in transaction costs when calculating profit and loss in S&P 500 futures?
To figure out your net profit or loss when trading S&P 500 futures, you’ll need to consider all transaction costs - like commissions, exchange fees, and NFA fees. These expenses should be deducted from your gross profit or loss, which is based on factors like price movement, tick size, and tick value.
For instance, once you calculate your gross profit or loss using the contract's tick value and price fluctuations, subtract all relevant fees to arrive at the actual net result. Many traders rely on tools like futures calculators to input key trade details - such as entry and exit prices or tick values - to estimate gross P&L. However, it's crucial to include transaction costs, whether manually or through automated tools, to get an accurate picture of your trading outcomes.
Accounting for these costs gives you a more realistic view of your trade performance, which is essential for managing risk effectively and improving your overall trading strategy.


