
Days to Cover (DTC) is a key metric that measures how many trading days it would take for short sellers to buy back all borrowed shares based on a stock's average daily trading volume. A higher DTC indicates limited liquidity, increasing the risk of a short squeeze, where short sellers are forced to cover positions, driving prices higher.
Key Takeaways:
- Formula: DTC = Total Short Interest ÷ Average Daily Trading Volume.
- High DTC (typically above 5) signals greater short squeeze potential.
- Low DTC (below 3) suggests minimal impact from short covering.
- Key Triggers: Positive news, earnings surprises, or insider activity can ignite squeezes.
- Example: GameStop’s 2021 squeeze saw a DTC of ~6 days and a price jump of 2,315%.
Monitoring DTC alongside short interest, cost to borrow, and trading volume provides valuable insights for traders seeking opportunities or avoiding risks tied to short squeezes.
What Is Days to Cover?
Days to Cover Definition
Days to Cover, often called the "short interest ratio", measures how many trading days it would take for short sellers to repurchase all their borrowed shares. This is calculated by dividing the total number of shares sold short by the stock's average daily trading volume (usually over a 30-day period). While short interest simply counts the borrowed shares, Days to Cover adds an extra layer by factoring in market liquidity. This makes it a valuable tool for understanding how easily short positions can be closed.
"Think of Days to Cover as a congestion indicator for short sellers. Using the analogy of a crowded venue where everyone needs to exit through limited doors - the higher the Days to Cover number, the more congested that exit could become." - StockTitan Research Team
Why Traders Track Days to Cover
This metric is a favorite among traders because it can signal potential market dynamics. A higher ratio, typically 5.0 days or more, suggests that short sellers may struggle to cover their positions, raising the chances of a short squeeze. On the flip side, a low ratio indicates that short sellers could exit their positions without causing much disruption to the stock's price. When the ratio climbs above 10 days, it often points to a severe market imbalance, which can lead to heightened volatility.
How to Calculate Days to Cover
The Formula: Short Interest ÷ Average Daily Trading Volume
The formula is simple:
Days to Cover = Total Short Interest ÷ Average Daily Trading Volume
Here’s what the components mean:
- Short interest refers to the total number of shares that have been borrowed and sold short.
- Average daily trading volume (ADTV) is the average number of shares traded per day over a specified period, such as the past 30 trading days.
This calculation helps estimate how many days it would take for all short sellers to cover their positions, assuming the trading volume remains constant. It’s a useful way to gauge how “crowded” the exit might be for short sellers.
Calculation Steps
- Step 1: Get the latest short interest data from a trusted source. Keep in mind that this data is often 2–4 weeks old.
- Step 2: Determine the average daily trading volume by summing up the trading volumes over your chosen period and dividing by the number of trading days.
- Step 3: Divide the total short interest by the average daily trading volume to calculate the Days to Cover.
- Step 4: Compare your result to the stock’s historical Days to Cover and its sector peers to see if the current figure stands out.
Let’s break it down with an example:
If a stock has 10,000,000 shares sold short and the average daily trading volume over the last 30 days is 2,000,000 shares, the calculation would look like this:
10,000,000 ÷ 2,000,000 = 5 days to cover.
Run 24/7 while you sleep. Keep bots, platforms, and trade copiers online on a dedicated VPS.
Low-latency VPS hosting for your trading platform.
From $59.99/mo
For context, liquid stocks typically have a ratio between 1 and 3. A ratio above 10 could signal heightened volatility risks.
Once you’ve calculated Days to Cover, the next step is choosing the right timeframe for the average volume, depending on your trading goals.
Selecting a Timeframe for Average Volume
The timeframe you use to calculate the average trading volume can significantly affect your results. A 30-day period is the standard, but shorter periods - like 5 or 10 days - might be better during volatile market conditions.
- Shorter timeframes (e.g., 5 days): These are more responsive to recent volume changes but can be skewed by temporary spikes.
- Longer timeframes (e.g., 30 days): These provide a smoother, more reliable view of trading trends but may lag behind sudden market shifts.
"The shorter the timeframe, the more responsive (but potentially noisier) the Days to Cover calculation becomes." - StockTitan
By comparing a 5-day Days to Cover with a 30-day Days to Cover, you can spot changes in liquidity. For example, a rising 5-day ratio might indicate drying liquidity and a growing risk of a short squeeze.
Here’s a quick guide to help you choose the right timeframe:
| Timeframe | Responsiveness | Data Quality | Best Use Case |
|---|---|---|---|
| 5-Day Average | Very high; reflects recent shifts | Noisy; prone to one-off anomalies | Active trading during high-volatility events |
| 10-Day Average | Balanced; mixes speed and stability | Less erratic than 5-day | Short-term tactical trading and risk assessment |
| 30-Day Average | Lower; slower to react | Smooth and reliable | Long-term analysis and sentiment tracking |
Picking the right timeframe can help you better analyze liquidity and assess the risk of a short squeeze. Whether you’re looking for immediate shifts or long-term trends, tailoring your approach to the situation will improve your insights.
How to Read Days to Cover Numbers
Days to Cover Ranges and Short Squeeze Risk Levels
Days to Cover Ranges and What They Mean
The Days to Cover (DTC) metric gives insight into how easily short sellers can exit their positions. By understanding these ranges, you can gauge the potential for a short squeeze or determine if short sellers can unwind their trades without major disruption.
Here’s a breakdown of common DTC ranges:
| Days to Cover | Squeeze Risk Level | Interpretation |
|---|---|---|
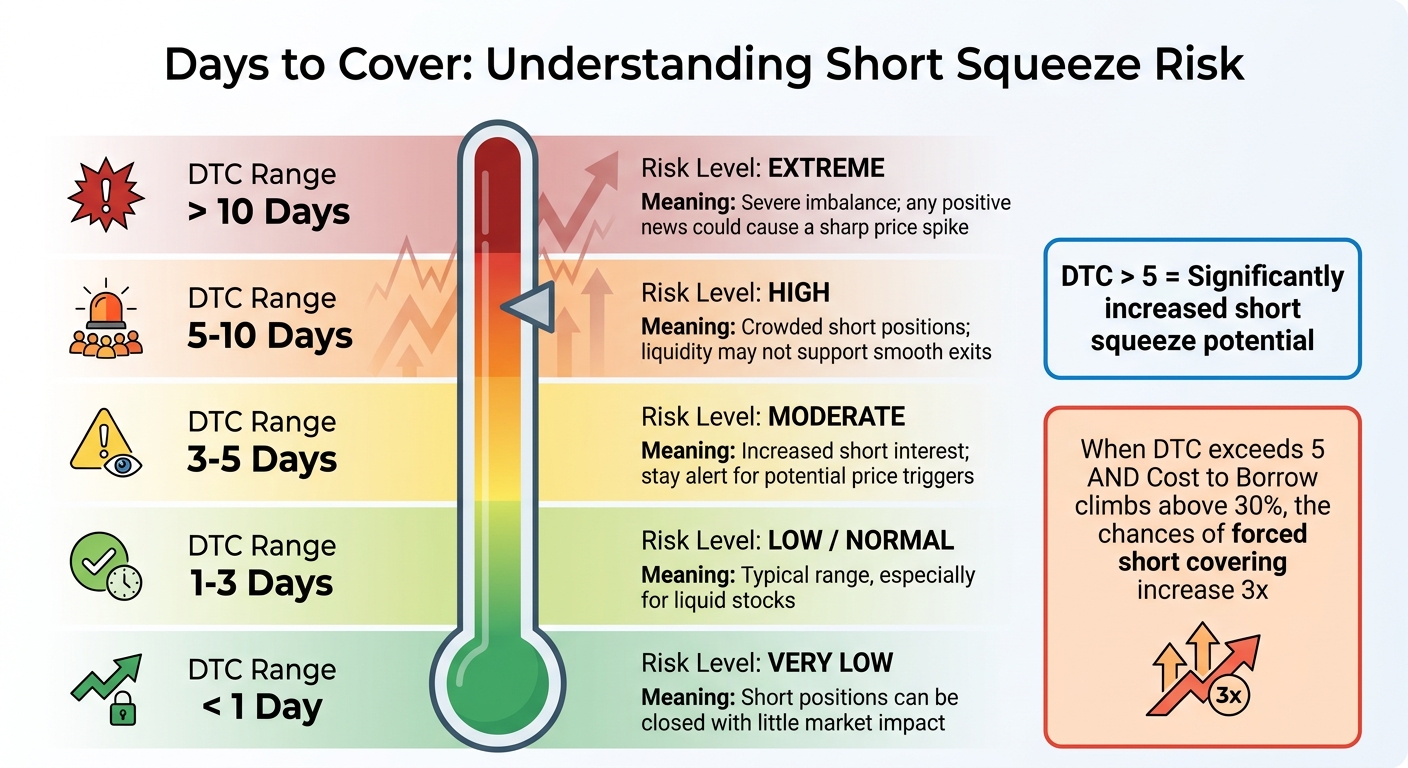
| < 1 | Very Low | Short positions can be closed with little market impact. |
| 1 – 3 | Low / Normal | Typical range, especially for liquid stocks. |
| 3 – 5 | Moderate | Increased short interest; stay alert for potential price triggers. |
| 5 – 10 | High | Crowded short positions; liquidity may not support smooth exits. |
| > 10 | Extreme | Severe imbalance; any positive news could cause a sharp price spike. |
When the DTC exceeds 5, the likelihood of a short squeeze rises significantly. Research by Jones & Lamont highlights that stocks with a DTC above 5 often experience sharp price reversals if a positive catalyst emerges. Additionally, when the DTC surpasses 5 and the Cost to Borrow climbs above 30%, the chances of forced short covering increase threefold.
To get a clearer picture, compare a stock’s DTC with its historical average and sector peers. For example, a DTC of 4 might signal heightened risk for a large-cap tech stock but could be routine for a small-cap biotech company.
Monitoring Changes Over Time
Static DTC values are useful, but tracking how they change over time can reveal even more about market dynamics. Shifts in DTC often provide clues about short sellers' behavior and liquidity conditions, which are crucial for assessing squeeze potential.
A rising DTC typically points to either growing short interest or declining liquidity - both of which increase the pressure for a squeeze. On the other hand, a falling DTC can indicate short covering or improved liquidity. Here are four patterns to watch:
- Rising Price + Rising DTC: Short sellers are doubling down on losing bets, increasing the likelihood of a squeeze.
- Rising Price + Falling DTC: Indicates short covering, which may suggest a squeeze is already underway or winding down.
- Falling Price + Rising DTC: Shorts are adding to their positions as the stock declines.
- Falling Price + Falling DTC: Suggests short sellers are closing positions and locking in profits.
Keep in mind that short interest data, a key component of DTC, is reported by exchanges twice a month with a delay of about 10 days. This lag means the DTC you calculate might not reflect current market conditions. To stay ahead, pair DTC analysis with real-time indicators like borrow rates and price action for a fuller view.
While a high DTC provides the "fuel" for a short squeeze, a "spark" - such as strong earnings, insider buying, or a technical breakout - is often needed to ignite the move.
How Days to Cover Affects Short Squeezes
This section delves into how high Days to Cover (DTC) values can intensify the conditions that lead to short squeezes, building on the earlier explanation of its calculation and significance.
Why High Days to Cover Creates Squeeze Conditions
Days to Cover essentially represents a liquidity challenge for short sellers. When this metric is high, exiting short positions becomes increasingly difficult without significantly driving up the stock price. Picture it like a packed theater with a single, narrow exit - when everyone tries to leave at once, chaos ensues.
Short squeezes are driven by limited supply. As short sellers buy shares to close their positions, they reduce the number of shares available for trading. When DTC is high, this creates a feedback loop: initial price increases trigger stop-loss orders and margin calls, forcing even more short sellers to buy. Since the daily trading volume is low compared to the total short interest, this buying pressure pushes prices even higher, leading to additional margin calls.
Studies suggest that stocks with a DTC greater than 5 are prone to dramatic price reversals when positive catalysts arise. The higher the DTC, the longer it takes for short sellers to close their positions, extending the price rally. When DTC exceeds 10 days, the potential for a massive squeeze grows significantly, as any positive trigger can ignite an explosive price movement.
These conditions are further intensified by specific market dynamics, which are explored below.
Market Factors That Increase Squeeze Pressure
Certain market forces can amplify the pressure on short sellers when DTC is elevated. One key factor is declining trading volume, which increases DTC by reducing the number of shares available for short covering.
Stay online and closer to execution. Choose a VPS location for CME futures, New York markets, London FX, API trading, and more.
Host your platform near the market route that matters.
From $59.99/mo
Rising borrowing costs add another layer of difficulty. When the cost to borrow (CTB) exceeds 30% - and especially when it surpasses 80% - the financial strain on short sellers becomes severe. Combine this with a small public float, and the squeeze potential skyrockets. Tesla’s 2020 short squeeze is a prime example. With short interest above 20% and CTB ranging from 70% to 90%, a Q4 2019 earnings beat and the launch of the Shanghai Gigafactory triggered forced buying, driving Tesla’s stock price from $90 to $900 (split-adjusted) over the course of a year.
Float constraints also play a critical role. A small float means fewer shares are available for short sellers to buy back. The ideal setup for a short squeeze typically includes short interest above 20% of the float, a DTC exceeding 5 days, and a CTB above 30%. When these factors align with a catalyst - such as an earnings surprise, insider buying, or a technical breakout - the stock price can soar.
"Stocks with DTC >5 experienced violent reversals when positive catalysts emerged; short-sale constraints create predictable return patterns." – Jones & Lamont, Journal of Financial Economics
Using Days to Cover in Trading Strategies
Finding Stocks with High Squeeze Potential
When it comes to leveraging Days to Cover (DTC) in trading, one effective approach is identifying stocks with a high potential for short squeezes. This involves analyzing DTC alongside other critical metrics to pinpoint setups with the highest probability of success. Typically, a strong short squeeze candidate will have three key characteristics: Short Interest (SI) exceeding 20% of the float, DTC greater than 5 days, and Cost to Borrow (CTB) above 30%. When these factors align, the chances of a forced covering event increase significantly.
Pay close attention to float size. Stocks with a smaller public float relative to their total shares outstanding create a supply bottleneck, which can lead to sharp price spikes. On the other hand, stocks with a larger float may not react as dramatically, even if they’re heavily shorted. Limited float combined with high short interest often sets the stage for explosive moves when buying pressure kicks in.
Borrow costs also play a critical role. Research indicates that a CTB above 30% is linked to a threefold increase in the likelihood of forced covering within 30 days. High CTB levels indicate mounting financial pressure on short sellers, reinforcing the squeeze potential.
Finally, keep an eye out for catalysts. While high DTC provides the groundwork for a squeeze, triggers such as unexpected earnings results, insider buying activity, or technical breakout patterns are often the spark that sets the move in motion.
Tracking Days to Cover Data with QuantVPS
Once you’ve identified a stock with strong squeeze potential, execution becomes the next critical step. Short squeezes can create rapid, self-reinforcing price movements as rising prices lead to margin calls and forced buying. In such fast-paced scenarios, the ability to act quickly is essential for both entering and exiting positions effectively.
This is where tools like QuantVPS shine. With its low-latency infrastructure, QuantVPS allows traders to monitor DTC and related short-interest data in real time through platforms like NinjaTrader and TradeStation. The system’s 0–1ms latency and 100% uptime ensure that you can react immediately when a catalyst triggers price movement in a heavily shorted stock. This speed advantage is especially important since DTC data, which is typically reported bi-monthly with a 10-day lag, can shift suddenly due to intraday volume spikes.
QuantVPS also supports advanced monitoring capabilities with its dedicated resources and NVMe storage, enabling traders to track multiple short squeeze candidates simultaneously. Pricing options range from VPS Lite at $59.99 per month to Dedicated Servers at $299.99 per month, offering the computing power needed to execute complex strategies while staying responsive during high-volatility events.
Where to Find Days to Cover Data
Accurate and reliable data is key when tracking Days to Cover and spotting potential short squeeze opportunities. Let’s explore some of the best sources for this information.
Data Sources for Short Interest and Volume
The most trusted sources for Days to Cover data come straight from regulatory bodies and stock exchanges. FINRA is a primary source, as it gathers short position reports from broker-dealers for all exchange-listed and OTC equity securities. This data is released bi-monthly and is available for free (non-commercial use). FINRA provides two main types of reports:
- Daily Short Sale Volume: Displays the total volume of short trades executed each day.
- Monthly Short Sale Transactions: Reflects the total open short positions.
Nasdaq also offers a bi-monthly Short Interest Report for its listed securities. This report includes important metrics like "Current Shares Report", "Avg. Daily Share Volume", and Days to Cover. Nasdaq allows users to query individual securities on its website, while full reports are accessible via secure FTP for a fee.
For a more comprehensive view of short sale volume for exchange-listed stocks, many traders combine data from Trade Reporting Facilities (TRFs), the Alternative Display Facility (ADF), and individual exchanges. Additionally, some third-party providers offer near real-time estimates, helping bridge the gap between official bi-monthly updates.
Trading Platforms with Built-In Days to Cover Metrics
If you prefer a more streamlined approach, many trading platforms now include Days to Cover metrics directly in their tools. Platforms such as ThinkorSwim and TradingView automatically update these metrics as new data becomes available, removing the hassle of manually compiling information from multiple sources.
For those seeking even faster access to current data, QuantVPS offers low latency vs. ultra-low latency (0–1ms) and 100% uptime, ensuring you can act quickly when opportunities arise. Their pricing plans include the VPS Lite plan at $59.99 per month for basic monitoring, or Dedicated Servers at $299.99 per month for more advanced, multi-chart setups. This high-performance infrastructure can give you the edge needed to stay ahead in the market.
Summary
Days to Cover is a key metric for spotting potential short squeezes. It’s calculated by dividing total short interest by the average daily trading volume. When this number exceeds 5 days, it suggests short sellers could struggle to exit their positions quickly, increasing the risk of a squeeze.
The challenge? Short interest data is updated only twice a month, making it tough to act on time. To bridge this gap, you need to watch real-time trading volume and price movements closely. Speed is everything here - short squeezes can cause price surges of 30-100% in a matter of moments.
This is where QuantVPS steps in. With 0-1ms latency and 100% uptime, it ensures your trading tools stay connected to live data feeds 24/7. Quick execution is vital, especially when a high Days to Cover stock sees a volume spike or breaking news. For traders, the VPS Lite plan at $59.99/month is perfect for basic monitoring, while the Dedicated Servers at $299.99/month are ideal for managing multiple charts and tracking several squeeze candidates at once.
While Days to Cover highlights squeeze potential, you’ll need additional confirmation. Look for factors like earnings beats, insider buying, or breakout vs. breakdown strategies. The strongest setups combine high Days to Cover (above 5) with short interest over 20% of the float and rising borrow costs.
FAQs
Can Days to Cover be misleading during sudden volume spikes?
Sudden spikes in trading volume can sometimes make the Days to Cover ratio less reliable. When trading volume shoots up quickly, the ratio might drop, creating the illusion of reduced risk. But here's the catch: if short interest remains high, the actual potential for a short squeeze could still be significant. To get a better understanding, traders should look at both volume trends and the level of short interest together.
What timeframe should I use for average daily volume when calculating DTC?
To calculate the Days to Cover ratio, use the average daily trading volume from the past 30 trading days. This timeframe offers a steady benchmark for evaluating the likelihood of a short squeeze.
How can I confirm a short squeeze setup beyond a high DTC?
When evaluating the potential for a short squeeze, it's not just about a high Days to Cover (DTC). Other key indicators to watch include a Cost to Borrow (CTB) above 30%, short interest surpassing 20% of the float, and specific catalysts like strong earnings reports, insider purchases, or activist investor activity. These elements point to significant short interest, elevated borrowing costs, and possible events that could trigger sudden buying pressure, making a short squeeze more likely.


