
TradingView and NinjaTrader cater to different trading needs in 2026. TradingView excels in cloud-based charting, broad market coverage, and a massive library of community-driven indicators. It’s ideal for traders focused on stocks, crypto, and multi-asset analysis. NinjaTrader, however, is built for futures and forex traders, offering tick-level precision, direct market access (DMA), and advanced algorithmic trading tools powered by its C#-based NinjaScript.
Key differences:
- TradingView: Browser-based, user-friendly, and great for analysis. Limited automation and execution speed.
- NinjaTrader: Desktop-based, professional-grade execution, and powerful for high-frequency and automated strategies.
Quick Comparison
| Feature | TradingView | NinjaTrader |
|---|---|---|
| Platform Type | Cloud-based (Web, Mobile) | Desktop-only (Windows) |
| Market Focus | Stocks, Crypto, Forex, Futures | Futures, Forex |
| Execution | Broker-connected (webhooks) | Direct Market Access (DMA) |
| Automation | Alerts via webhooks | Native algorithmic trading |
| Scripting | Pine Script (basic) | NinjaScript (C#-based) |
| Backtesting | Basic (bar-by-bar) | Tick-level precision |
| Hosting | Not required | VPS recommended |
| Cost | Subscription-based | License + VPS + data fees |
Bottom Line: Use TradingView for analysis and multi-asset research. Pick NinjaTrader for precise execution and advanced automation. Many traders combine both platforms for a balanced approach.
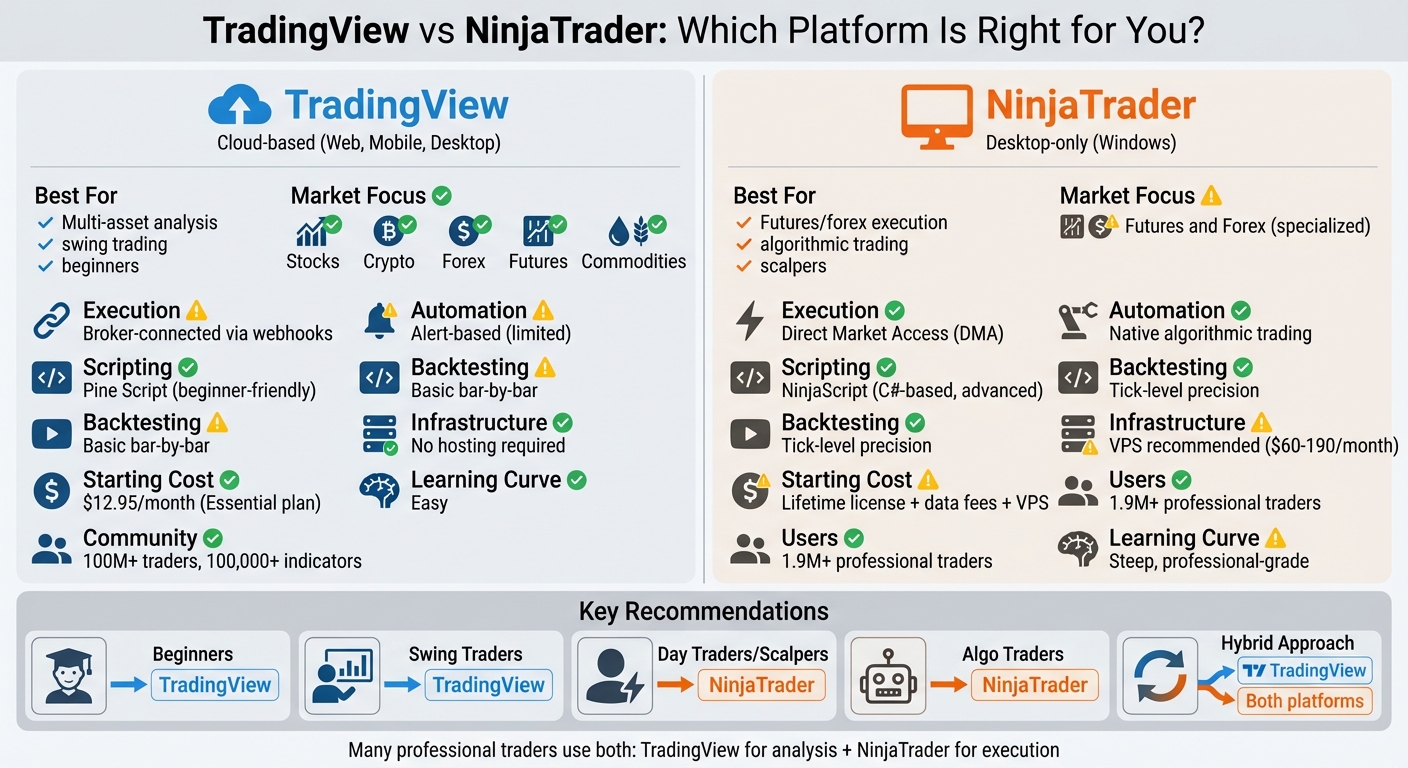
TradingView vs NinjaTrader 2026 Feature Comparison Chart
TradingView Overview for Quantitative Traders

Cloud-Based Architecture and Access
TradingView operates entirely on the cloud, eliminating the need for downloads and ensuring smooth access from any device - whether you're on a desktop, tablet, or mobile (iOS and Android). Your chart layouts, watchlists, Pine Scripts, and settings are automatically synced across platforms, making transitions between devices effortless.
One standout feature is the platform's alert system. These alerts run on TradingView's servers, monitoring markets around the clock without requiring your computer to stay on. As TradingView explains:
"Our alerts run on powerful servers. Fast and robust... available on any device and can be powered by Pine Script®."
For developers, TradingView simplifies the process by offering a ready-to-use coding environment for Pine Script, so there's no need for local setup. With access to 3.5 million instruments and multiple data feeds, it’s designed to streamline quantitative analysis.
Now, let’s dig into its charting and analysis features built for quantitative traders.
Charting and Analysis Tools
TradingView boasts over 400 built-in indicators and a massive library of more than 100,000 indicators contributed by its active community of traders. You can display up to 16 charts on a single screen, with synchronized symbols and timeframes for a comprehensive view of the markets.
The platform uses Pine Script v6, offering tools that are beginner-friendly yet powerful enough for creating advanced quantitative indicators. To enhance this, the built-in Pine Profiler helps traders optimize script performance and identify bottlenecks in their strategies. Whether you trade stocks, ETFs, futures, forex, bonds, or cryptocurrencies, TradingView supports a wide range of asset classes, making it a versatile choice for diverse quantitative strategies.
For those wanting to test strategies without financial risk, the "Paper Trading" feature allows you to simulate broker executions directly within the platform's cloud environment.
Automation and Quantitative Trading Constraints
While TradingView offers automation capabilities, it doesn’t support fully automated execution natively. Instead, it relies on sending alerts via webhooks to third-party tools like CrossTrade, which bridge the gap between TradingView and your broker. However, these webhook alerts come with latency, making them less suitable for high-frequency trading strategies.
Another limitation is how order types, such as bracket orders or trailing stops, may be managed locally on your device rather than on your broker's server. This setup increases the risk of disruptions if your connection drops. Traders seeking uninterrupted, high-speed execution often turn to the best VPS for algorithmic trading to keep their systems running 24/7.
Although Pine Script is an excellent tool for building custom indicators and strategies, it doesn’t match the power or flexibility of professional programming languages like C#, commonly used in platforms such as NinjaTrader. Complex algorithms often need to be simplified to work within Pine Script’s constraints. Additionally, backtesting on TradingView is performed on a bar-by-bar basis rather than tick-by-tick, which could miss key intra-bar price movements critical for certain strategies.
To access automation features like webhook alerts, you’ll need at least the Essential plan, which starts at $12.95 per month.
NinjaTrader Vs TradingView (2026) – Charts, Brokerage, Strategy & Pricing
NinjaTrader Overview for Quantitative Traders
NinjaTrader stands out as a desktop-based platform tailored specifically for futures and forex traders who need precision and automation. With over 1.9 million users trusting its performance-driven approach, it has become a go-to choice for quantitative traders who value execution speed and control over convenience.
Unlike cloud-based platforms, NinjaTrader operates locally on your Windows PC, requiring either a high-performance machine or a reliable VPS setup to keep your automated strategies running seamlessly. This local setup ensures complete control over execution speed and system resources, which is vital for traders running complex algorithms.
Run 24/7 while you sleep. Keep bots, platforms, and trade copiers online on a dedicated VPS.
Low-latency VPS hosting for your trading platform.
From $59.99/mo
What makes NinjaTrader particularly appealing is its focus on Direct Market Access (DMA) for futures and forex trading. This setup delivers high-speed execution, reducing slippage - an essential factor for algorithmic strategies. With intraday margins starting at $50 for Micro E-mini futures and commissions as low as $0.09 per Micro contract, it offers an affordable solution for active traders.
Now, let’s dive into NinjaScript, the platform’s powerful tool for algorithmic trading.
Algorithmic Trading with NinjaScript
NinjaScript is the heart of NinjaTrader’s appeal for quantitative traders. Built on C#, it provides a robust programming environment capable of handling intricate algorithmic logic that goes far beyond the capabilities of simpler, script-based languages. With NinjaScript, you can integrate external DLLs, access system-level functions, and create highly customized strategies tailored to your trading needs.
For those without coding experience, the Strategy Builder offers a visual, point-and-click interface to create strategies. However, if you’re comfortable writing code, NinjaScript allows you to design custom indicators, risk management tools, and execution algorithms with professional-level precision.
Kris Lassen from LizardTrader.com highlights this flexibility:
"NinjaTrader's flexibility has been key in helping us reach more traders and grow our business with advanced solutions tailored to their needs."
To save time, you can tap into the NinjaTrader Ecosystem, which hosts over 1,000 third-party add-ons, indicators, and pre-built strategies. This community-driven resource lets you focus on refining your edge instead of starting from scratch.
Backtesting, Optimization, and Market Replay
NinjaTrader’s Strategy Analyzer is a dedicated tool for testing automated strategies against historical data. It supports multi-parameter optimization, allowing you to experiment with different variables to find the most profitable configurations before putting real money on the line.
One standout feature is the tick-level market replay, which lets you record market data and replay it later. This allows you to evaluate how your strategy would have performed under real-time conditions, without any financial risk.
| Feature | Purpose | Benefit for Futures/Forex Traders |
|---|---|---|
| Strategy Analyzer | Historical Backtesting | Test strategies against years of market data |
| Optimization | Parameter Refinement | Pinpoint the best settings for specific market conditions |
| Market Replay | Real-time Simulation | Observe strategy behavior using tick-by-tick data |
| NinjaScript | Custom Development | Build advanced, tailored algorithmic systems |
Thanks to its C# foundation, NinjaScript’s backtesting engine can handle complex strategies, including intricate entry/exit rules and advanced risk management setups. For accurate backtesting, you’ll need historical data provided by official exchanges, especially for contracts requiring exchange-sourced data.
VPS Hosting and Infrastructure Requirements
Given NinjaTrader’s advanced features, it demands equally capable hardware. Because it’s a desktop-based platform, a high-performance setup or VPS is essential for running automated strategies 24/7 without interruptions.
Single-threaded CPU performance is critical, as NinjaTrader assigns each instrument to a single thread. Look for processors with clock speeds of 3.5 GHz or higher, such as the AMD Ryzen 9 9950X, which boasts single-thread Passmark scores around 4,297. For storage, NVMe SSDs are a must, as they handle tick data and market depth far more efficiently than standard SSDs. Additionally, 16GB to 32GB of RAM is recommended for complex strategies or multi-platform setups.
Proximity to key trading hubs is also crucial. For CME futures like ES, NQ, and CL, hosting your server in Aurora, IL, or Chicago ensures ultra-low latency under 2 ms, which is vital for maintaining queue priority in automated strategies. As Optimus Futures explains:
"The best VPS for futures trading in 2026 is not simply the server with the lowest advertised ping - it's a Chicago- or Aurora-proximate machine that keeps your platforms, algorithms, and charting stable through volatile market conditions."
A VPS adds stability, ensuring your automated strategies, OCO orders, and trailing stops remain active even during local internet or power outages.
For NinjaTrader users, QuantVPS offers hosting plans optimized for futures trading. These plans start at $59.99/month for the VPS Lite package (4 cores, 8GB RAM, 70GB NVMe) and go up to $299.99/month for dedicated servers with 16+ cores, 128GB RAM, and 2TB+ NVMe storage - ideal for running multiple strategies simultaneously.
When choosing a VPS, avoid underclocked Xeon processors. Instead, opt for Ryzen 7/9 or Intel i7/i9 processors with clock speeds of 3.5 GHz or higher. To maintain performance, clear the NinjaTrader 8 cache weekly (found in the "db" folder).
Feature Comparison: TradingView vs. NinjaTrader
Now that we've explored what each platform brings to the table, let's dive into a side-by-side comparison of the features that matter most for quantitative trading.
Charting, Analysis, and Market Coverage
TradingView is a cloud-based platform that works seamlessly across web browsers, desktops, and mobile devices. On the other hand, NinjaTrader is a desktop-based application designed for Windows, leveraging local computing power for tick-by-tick precision.
In terms of market coverage, TradingView spans a wide variety of asset classes, including stocks, crypto, forex, futures, commodities, bonds, and economic data. NinjaTrader, however, focuses primarily on futures and forex markets, catering to traders who need specialized tools for these areas.
One of TradingView's standout features is its massive community. It provides access to a vast library of built-in indicators and community scripts, along with over 100 fundamental metrics and financial ratios directly integrated into its charts. This makes it a great choice for traders who value multi-asset research and social sentiment analysis.
NinjaTrader, by contrast, excels in order flow analysis and market microstructure. Features like footprint charts, market depth visualization, and volume-based range bars are tailored for futures traders who rely on sub-second tick data and detailed order book insights.
| Feature | TradingView | NinjaTrader |
|---|---|---|
| Platform Type | Cloud-based (Web, Desktop, Mobile) | Desktop-only (Windows) |
| Chart Types | 20+ options, including Candles, Renko, TPO, Footprint | Tick, Volume, Range, Footprint |
| Built-in Indicators | Extensive library, including community scripts | Thousands via third-party ecosystem |
| Market Coverage | Diverse: Stocks, Crypto, Forex, Futures, Commodities, Bonds | Specialized: Futures and Forex |
| Drawing Tools | 110+ synced tools across devices | Precision tools for desktop |
| Data Quality | Aggregated (ideal for swing/position trading) | Tick-level data (for scalping/HFT) |
| Learning Curve | Easy and beginner-friendly | Steep, professional-grade |
| Hybrid Use | Social sentiment and market scanning | Granular order flow and execution |
As Pineify aptly puts it:
"TradingView is the undisputed champion for charting and analysis... NinjaTrader, on the other hand, is the specialist in execution, particularly for futures and forex."
Automation and Strategy Development
The scripting capabilities of each platform play a key role in determining their automation potential. TradingView's Pine Script is user-friendly and cloud-based, making it easy to share strategies within the community. However, its simplicity limits its ability to handle complex algorithms or integrate with external systems.
NinjaTrader, on the other hand, uses NinjaScript, a C#-based scripting language that offers professional-grade flexibility. This allows for integration with external DLLs and access to deeper system-level functions, making it an excellent choice for traders who need to execute sophisticated, high-complexity algorithms.
When it comes to backtesting, NinjaTrader's Strategy Analyzer provides institutional-level testing with tick-level historical data and advanced features like walk-forward analysis. TradingView's Strategy Tester, while functional, is more basic and lacks the granularity needed for high-frequency trading.
| Capability | TradingView | NinjaTrader |
|---|---|---|
| Scripting Language | Pine Script (simple, beginner-friendly) | NinjaScript (C#-based, advanced) |
| Automation Type | Alerts and webhooks | Native algorithmic trading |
| Backtesting | Basic (cloud-based) | Tick-level precision with Strategy Analyzer |
| Optimization | Basic parameter testing | Advanced (walk-forward, genetic, multi-objective) |
| Market Replay | Visual-only Bar Replay | Tick-by-tick Market Replay |
| External Integration | Limited (webhooks) | Full DLL and .NET integration |
| Infrastructure | Cloud-based (no setup required) | Desktop/VPS (requires hosting for 24/7 operation) |
Reza Bagheri from Opofinance sums it up well:
"TradingView is an analysis-first platform... NinjaTrader is an execution-first platform, built for high-performance futures and forex trading."
For beginners in algorithmic trading, TradingView's Pine Script offers a more accessible starting point. However, if your strategies demand advanced logic, tick-level accuracy, or high-frequency execution, NinjaTrader is the go-to platform.
Order Execution and Performance
Order execution is another area where these platforms differ significantly. NinjaTrader is designed for Direct Market Access (DMA), offering tick-level precision and ultra-fast order processing. Its Advanced Trade Management (ATM) system lets you predefine complex strategies, including multi-target and stop-loss orders, for seamless automation.
TradingView, on the other hand, relies on broker connections via webhooks or manual entry. While this cloud-based approach is convenient, it can introduce latency, making it less suitable for high-frequency strategies where every millisecond counts. As Pineify notes:
"TradingView's limitations become apparent when you need professional execution speeds... it's not designed for high-frequency trading."
In terms of broker connectivity, TradingView integrates with a wide range of brokers across forex, crypto, and stocks. NinjaTrader focuses more narrowly on futures and forex, offering deep integrations with providers like Interactive Brokers and StoneX. Interactive Brokers, for example, is highly rated on both platforms and offers futures execution costs as low as $0.25 per contract for high-volume traders.
| Factor | TradingView | NinjaTrader |
|---|---|---|
| Execution Model | Broker-connected (webhooks/API) | Direct Market Access (DMA) |
| Latency | Moderate (cloud/browser-based) | Low (desktop/VPS-optimized) |
| Order Types | Standard (Market, Limit, Stop) | ATM, OCO, Trailing Stops |
| Reliability | Relies on webhook delivery | Stability via local/VPS setup |
| Scalping Support | Limited | High (optimized for fast execution) |
| Primary Focus | Flexibility across assets | Precision for futures and forex |
For traders seeking top-tier reliability, VPS hosting can elevate NinjaTrader's performance. By running locally or on a VPS, NinjaTrader ensures that automated strategies, OCO orders, and trailing stops remain active even during internet or power outages. Hosting in locations like Aurora, IL, or Chicago can reduce latency to under 2 milliseconds - critical for maintaining queue priority in automated futures strategies.
If you're trading on longer timeframes and prefer a browser-based interface, TradingView might meet your needs. However, for traders who prioritize millisecond-level speed, tick-level precision, and 24/7 automation, NinjaTrader is the clear winner.
Stay online and closer to execution. Choose a VPS location for CME futures, New York markets, London FX, API trading, and more.
Host your platform near the market route that matters.
From $59.99/mo
Pricing and Cost Analysis
To truly understand the costs of each platform, it's important to look beyond just subscription fees. TradingView operates on a subscription-based model with monthly or annual payments, while NinjaTrader uses a more traditional software model, offering a one-time lifetime license fee for full access to its trading tools.
Platform Subscription and Licensing Costs
Here’s how the subscription models compare:
TradingView provides a free tier with basic tools, ideal for casual traders exploring charting and analysis. Paid tiers unlock more advanced features like additional indicators, faster data updates, and multi-chart layouts. The pricing is straightforward - subscriptions cover most user needs.
NinjaTrader, on the other hand, offers a free version mainly for simulation purposes, allowing traders to test strategies without coding or financial risk. For live trading, users can opt for a recurring lease or a one-time lifetime license. However, NinjaTrader users face extra costs that TradingView users don’t, such as professional-grade tick data fees. Non-professional users pay separate fees, like $12/month for a CME bundle or $4/month for individual exchange data. While both platforms come with potential data fees, TradingView's subscriptions bundle most charting features.
A key difference lies in infrastructure. TradingView uses a cloud-based system that automatically syncs charts and analysis across devices. In contrast, NinjaTrader is desktop-based, and for 24/7 automated trading with institutional-grade execution, users need external VPS hosting - a recurring cost that can significantly add to overall expenses.
In short, TradingView’s all-in-one subscription keeps extra costs to a minimum, whereas NinjaTrader users must also account for VPS hosting to achieve optimal performance.
VPS Hosting Costs for NinjaTrader
For NinjaTrader users planning to run automated trading around the clock, VPS hosting is a critical expense to consider.
QuantVPS offers specialized plans with servers in Chicago, delivering ultra-low latency of less than 0.52ms to CME Group matching engines. This low latency is crucial during high-impact events like Non-Farm Payroll.
QuantVPS provides three main plans:
- VPS Lite: Priced at $59.99/month (or $41.99/month with annual billing), this plan includes 4 CPU cores, 8GB RAM, and 70GB NVMe storage. It’s suitable for 1–2 charts but lacks multi-monitor support.
- VPS Pro: At $99.99/month (or $69.99/month annually), this plan offers 6 CPU cores, 16GB RAM, 150GB NVMe storage, and support for up to 2 monitors. It’s ideal for 3–5 charts.
- VPS Ultra: Designed for high-demand trading, this plan costs $189.99/month (or $132.99/month annually) and provides 24 CPU cores, 64GB RAM, 500GB NVMe storage, and support for up to 4 monitors, handling 5–7 charts with ease.
All plans come with 1Gbps+ network speeds, unmetered bandwidth, Windows Server 2022, and compatibility with major futures data feeds like Rithmic, CQG, dxFeed, TT, and IQFeed.
| Plan | Monthly Cost | Annual Cost (Monthly) | CPU Cores | RAM | Storage | Monitors | Best For |
|---|---|---|---|---|---|---|---|
| VPS Lite | $59.99 | $41.99 | 4 | 8GB | 70GB NVMe | 1 | 1–2 charts |
| VPS Pro | $99.99 | $69.99 | 6 | 16GB | 150GB NVMe | 2 | 3–5 charts |
| VPS Ultra | $189.99 | $132.99 | 24 | 64GB | 500GB NVMe | 4 | 5–7 charts |
When calculating NinjaTrader costs, you’ll need to include the platform license, monthly data fees, and VPS hosting. For example, a trader using the VPS Pro plan with annual billing pays about $70/month for hosting, plus $12/month for CME data - totaling $82/month before factoring in the license. TradingView’s all-in-one subscription avoids these extra costs, making it a more budget-friendly option for traders who don’t require tick-level precision or 24/7 automation. However, for high-frequency futures traders, the VPS investment can be a game-changer, reducing slippage and protecting against hardware or internet failures.
Trader Profiles and Platform Recommendations
Trader Types in 2026
Knowing your trader profile is key to picking the right platform. By 2026, trading has divided into distinct categories, each with specific needs and tools.
Beginner traders are just starting out, often without coding skills or deep market knowledge. They need platforms that are straightforward, helping them learn without being overwhelmed by technical complexities.
Swing and position traders take a longer-term approach, holding positions for days or weeks. They focus on multiple asset classes like stocks, crypto, and forex. These traders value platforms that offer cloud-based access across devices and broad market coverage, rather than prioritizing lightning-fast execution.
Active intraday traders and scalpers work within short timeframes, relying on precise tick-level data, fast order execution, and advanced tools to spot and act on small price changes.
Quantitative and algorithmic traders are the most technically advanced group. They design automated systems to trade without manual input, depending on features like detailed backtesting and strategy optimization with historical tick data and professional-grade infrastructure. These traders often require C# programming support and reliable VPS hosting to ensure uninterrupted operation of their strategies.
Here’s a breakdown of platform recommendations tailored to these trader types.
Platform Recommendations by Trader Profile
For beginners, TradingView is the go-to choice. Its browser-based interface and paper trading simulator - with a $100,000 virtual balance - make it a great starting point. Beginners can explore without financial risks, and TradingView’s Pine Script allows for basic coding experiments without being intimidating. Plus, its free tier lets users test the waters before upgrading.
While beginners prioritize simplicity, swing traders and multi-asset investors need broader market access. TradingView’s cloud-based platform syncs charts and alerts across devices, covering stocks, crypto, forex, and commodities. Its community of over 100 million traders also offers shared analyses and insights, making it a valuable learning hub. For these traders, the Essential ($14.95/month) and Plus ($29.95/month) plans typically provide the necessary features without requiring extra infrastructure.
For active intraday traders and scalpers, NinjaTrader stands out. It delivers institutional-grade execution with tick-level accuracy. Features like Advanced Trade Management (ATM) allow one-click execution of complex strategies, while its advanced order flow visualization tools give the granular market data that scalpers rely on. However, NinjaTrader requires a lifetime license and additional VPS hosting to ensure optimal performance.
Quantitative and algorithmic traders benefit from NinjaTrader’s robust C# environment, which supports complex automation and 24/7 trading when paired with high-performance VPS hosting. As noted:
TradingView's limitations become apparent when you need professional execution speeds or want to build complex automated systems. – Pineify
Many quantitative traders adopt a hybrid strategy, using TradingView for initial research and its excellent charting tools, while relying on NinjaTrader for precise execution and automation. This combination leverages the strengths of both platforms, ensuring flexibility and efficiency.
Conclusion and Decision Framework
When it comes to deciding between TradingView and NinjaTrader, the choice ultimately depends on how well the platform aligns with your trading approach. As Reza Bagheri from OpoFinance points out:
"The ninjatrader vs tradingview decision is not about which platform is objectively 'best,' but which is best for you."
TradingView offers a cloud-based solution ideal for analysis, accessible from any device, and supports a wide range of asset classes with over 100,000 community-built indicators. On the other hand, NinjaTrader is a Windows desktop application, specifically designed for professional futures and forex traders who need tick-level precision, advanced automation capabilities using C#, and in-depth backtesting features. These unique strengths make each platform suitable for different trading needs.
Interestingly, many traders find value in leveraging both platforms - using TradingView for market analysis and NinjaTrader for precise trade execution.
Here’s a quick comparison of how each platform excels based on specific trading goals:
| Trading Goal | Best Platform | Key Reason |
|---|---|---|
| Multi-asset swing trading | TradingView | Extensive market coverage and seamless device synchronization |
| High-frequency futures scalping | NinjaTrader | Low-latency execution and Advanced Trade Management (ATM) |
| Social trading & idea sharing | TradingView | Large community and a wealth of public scripts |
| Complex algorithmic trading | NinjaTrader | Powerful C# environment and advanced backtesting |
| Mobile-first monitoring | TradingView | Outstanding mobile app with full chart synchronization |
| Professional order flow analysis | NinjaTrader | Built-in footprint charts and detailed market depth tools |
Before committing real money, take advantage of the risk-free trial options on both platforms to see which one fits your trading style best.
FAQs
How do TradingView and NinjaTrader differ in their market focus and platform design?
TradingView is a go-to platform for multi-asset technical analysis, offering a browser-based solution that makes it simple to analyze a variety of markets, including stocks, crypto, forex, and commodities. One of its standout features is its focus on social trading, enabling users to share trading ideas and strategies with a global community. Plus, its web-first design and mobile compatibility mean there’s no need for downloads or installations - just open your browser and start exploring.
On the flip side, NinjaTrader caters to professional futures and forex traders who demand fast order execution and advanced automation tools. It’s built as a Windows desktop application and provides high-performance features, along with seamless broker integration for direct trading.
How do TradingView and NinjaTrader compare when it comes to automation for algorithmic trading?
TradingView leans heavily on Pine Script, a scripting language designed for creating alert-based scripts. These scripts are great for sending notifications or webhook signals; however, they don’t support direct trade execution. This setup makes TradingView a solid option for traders who want to focus on generating signals and then rely on external tools to place trades.
Meanwhile, NinjaTrader takes automation to the next level with its proprietary NinjaScript language. With NinjaScript, users can design, backtest, and implement fully automated trading strategies that can execute trades directly through supported brokers. It also supports advanced order types like OCO (One Cancels Other), brackets, and trailing stops, giving traders more flexibility and precision.
If your goal is to have a fully automated trading system that handles everything from strategy to execution, NinjaTrader is the clear winner. On the other hand, TradingView is a better fit for those primarily interested in generating trading signals without direct execution.
How do the costs of TradingView and NinjaTrader compare for high-frequency trading?
The pricing models of TradingView and NinjaTrader cater to different types of traders, particularly when it comes to high-frequency trading.
TradingView offers a straightforward tiered subscription system. You can choose from a free plan or paid options like Essential at $12.95/month, Plus at $28.29/month, and Premium at $49.95/month. These plans come with fixed costs and no additional fees for trades, making it a predictable choice for traders focused primarily on analysis rather than execution.
NinjaTrader, in contrast, provides free access for charting and simulation. However, live trading requires either a $99 monthly subscription or a one-time lifetime license fee of $1,499. Beyond these upfront costs, NinjaTrader also charges per-contract execution fees, ranging from $1.29 to $0.59 per contract side, and imposes a $35 monthly inactivity fee on idle accounts.
For traders engaging in high-frequency strategies, NinjaTrader's per-trade costs can accumulate rapidly due to the high volume of trades. That said, it offers direct market access and low-latency execution, which are essential for these strategies. While TradingView is a more affordable and predictable option, it lacks the infrastructure needed for executing trades at the speed required for high-frequency trading. Ultimately, the decision between the two depends on whether you value cost predictability or the speed and automation necessary for high-frequency trading.


