
Footprint charts give traders a detailed view of market activity, showing volume at each price level and revealing buyer/seller dynamics. Unlike traditional candlestick charts, these tools help identify bid/ask imbalances, absorption zones, and price exhaustion points. This article covers the best platforms for footprint charting, including their features, data feeds, and pricing.
Key Platforms:
- Sierra Chart: Offers Numbers Bars, Delta Divergence, and stacked imbalances. Ideal for professional futures traders. Costs ~$36/month.
- Quantower: Features Cluster Charts and DOM Surface for multi-asset trading. Pricing starts at $70/month or $1,590 lifetime.
- ATAS: Known for user-friendly cluster charts and Smart DOM tools. Free Start plan; paid plans cost €24.95 to €89.95/month.
- Bookmap: Focuses on real-time liquidity visualization with heatmaps. Free Digital plan; Global $49/month and Global+ $99/month.
- NinjaTrader: Provides Volumetric Bars and SuperDOM for futures traders. Free version available; full suite costs $99/month.
- Jigsaw Trading: For order flow specialists with a one-time fee of $879. For more, see our guide to order flow trading software.
- MotiveWave: Combines footprint tools with advanced charting. Pricing varies; includes a 14-day trial.
- VolFix.net: Precision-focused platform for institutional traders. Pricing not publicly listed.
- TradeStation: Offers footprint-style views through EasyLanguage add-ons. Pricing depends on chosen tools.
- MultiCharts: Supports custom order flow indicators and strategy testing. Costs $99–$299/month.
Quick Comparison Table:
| Platform | Key Features | Data Feeds | Price |
|---|---|---|---|
| Sierra Chart | Numbers Bars, Delta Divergence | CQG, Rithmic | ~$36/month |
| Quantower | Cluster Charts, DOM Surface | Rithmic, CQG | $70/month |
| ATAS | Cluster Charts, Smart DOM | Rithmic, CQG | Free; €24.95 to €89.95/month |
| Bookmap | Heatmaps, Volume Dots | dxFeed, Rithmic | Free; $49 to $99/month |
| NinjaTrader | Volumetric Bars, SuperDOM | CQG, Rithmic | Free–$99/month |
| Jigsaw Trading | Depth & Sales, Auction Vista | Rithmic, CQG | $879 (one-time) |
| MotiveWave | Volume Imprint, Cumulative Delta | Major brokers | Varies |
| VolFix.net | Cluster Charts, Delta Analysis | Institutional | Not listed |
| TradeStation | Footprint-style add-ons, Market Depth | TradeStation data | Varies |
| MultiCharts | Custom Indicators, Strategy Testing | CQG, Rithmic | $99–$299/month |
These platforms cater to traders of all levels, from scalpers to institutional professionals, offering tools for futures, stocks, crypto, and forex markets.
ATAS, Bookmap and Quantower prices checked on their own sites on 10 Oct 2026.
What a Footprint Chart Shows
A footprint chart shows the volume traded at each price inside every bar, split into trades that hit the bid (sellers) and trades that lifted the ask (buyers). A candlestick shows only the open, high, low and close; the footprint shows who traded at each price on the way. Platforms use different names for it: Numbers Bars (Sierra Chart), Cluster Charts (Quantower, ATAS), Volumetric Bars (NinjaTrader) and Volume Imprint (MotiveWave).
How to Read a Footprint Chart
Read a footprint one price row at a time. Compare the volume sold at the bid with the volume bought at the ask, then check the bar's delta and where most of the volume traded. Five readings cover most setups.
| Reading | What it is | What it suggests |
|---|---|---|
| Bid x Ask | Each row shows volume sold at the bid on the left and bought at the ask on the right, for example 50 x 190 | More volume on one side shows which side was aggressive at that price |
| Delta | Ask volume minus bid volume, for one row or the whole bar | Positive delta means buyers were more aggressive; negative means sellers were |
| Imbalance | Ask volume at one price is much larger than bid volume one tick below, or the reverse, above a ratio you set in the platform | Strong one-sided pressure at that price |
| Stacked imbalances | Several imbalances on the same side at consecutive prices | A zone that often acts as support (buying) or resistance (selling) if price returns |
| POC (point of control) | The price with the most volume in the bar | The level where most business was done; price often reacts when it comes back to it |
Example: Reading One Footprint Bar
The numbers below are made up to show the method. Each row is one price level in a single bar, with bid volume on the left and ask volume on the right.
| Price | Bid x Ask | What to notice |
|---|---|---|
| 4501.00 | 15 x 40 | High of the bar: buying dried up here |
| 4500.75 | 60 x 210 | Buy imbalance (210 vs 50 one tick below) |
| 4500.50 | 50 x 190 | Buy imbalance (190 vs 45 one tick below) |
| 4500.25 | 45 x 520 | POC (most volume) and buy imbalance (520 vs 80 one tick below) |
| 4500.00 | 80 x 30 | Low of the bar |
Read together, three buy imbalances stacked from 4500.25 to 4500.75 and a bar delta of +740 (990 bought at the ask, 250 sold at the bid) point to aggressive buyers. The POC at 4500.25 is the level to watch if price comes back down. Thin volume at the high (15 x 40) suggests buying ran out at the top of the bar.
Free Footprint Chart Options
You can try footprint charts without paying for software, but each free option limits the data you get. Free plans checked on 10 Oct 2026:
| Platform | Free option | Limits |
|---|---|---|
| ATAS | Start plan at €0, with footprint (cluster) charts included | Futures data is delayed 15 minutes; real-time data only for crypto |
| NinjaTrader | Free plan with no monthly fee | Order Flow+, which includes Volumetric Bars, unlocks once you add funds to a live NinjaTrader account |
| Quantower | Free limited version | Cluster charts need the paid Volume Analysis extension or the full license |
| Bookmap | Digital plan, free | A heatmap rather than a footprint; real-time crypto only, with US stocks and futures delayed |
NAS100 vs NQ: Why Footprints Need Futures Data
NAS100 is a CFD priced by your broker, so its volume counts only that broker's ticks, not trades on a central exchange. A footprint built on it can't show real buying and selling at each price. For Nasdaq-100 order flow, chart the CME futures instead: the E-mini Nasdaq-100 (NQ) or the Micro E-mini Nasdaq-100 (MNQ).
Data Feed Needs for Footprint Charts
A footprint is only as good as its data: it needs every trade, unfiltered, marked as hitting the bid or lifting the ask. For CME futures, most platforms in this list connect through Rithmic, CQG or dxFeed, and our dxFeed vs Rithmic comparison explains how the two feeds differ. Check that the feed also provides tick-by-tick history, so the platform can rebuild past footprint bars when you open a chart.
1. Sierra Chart
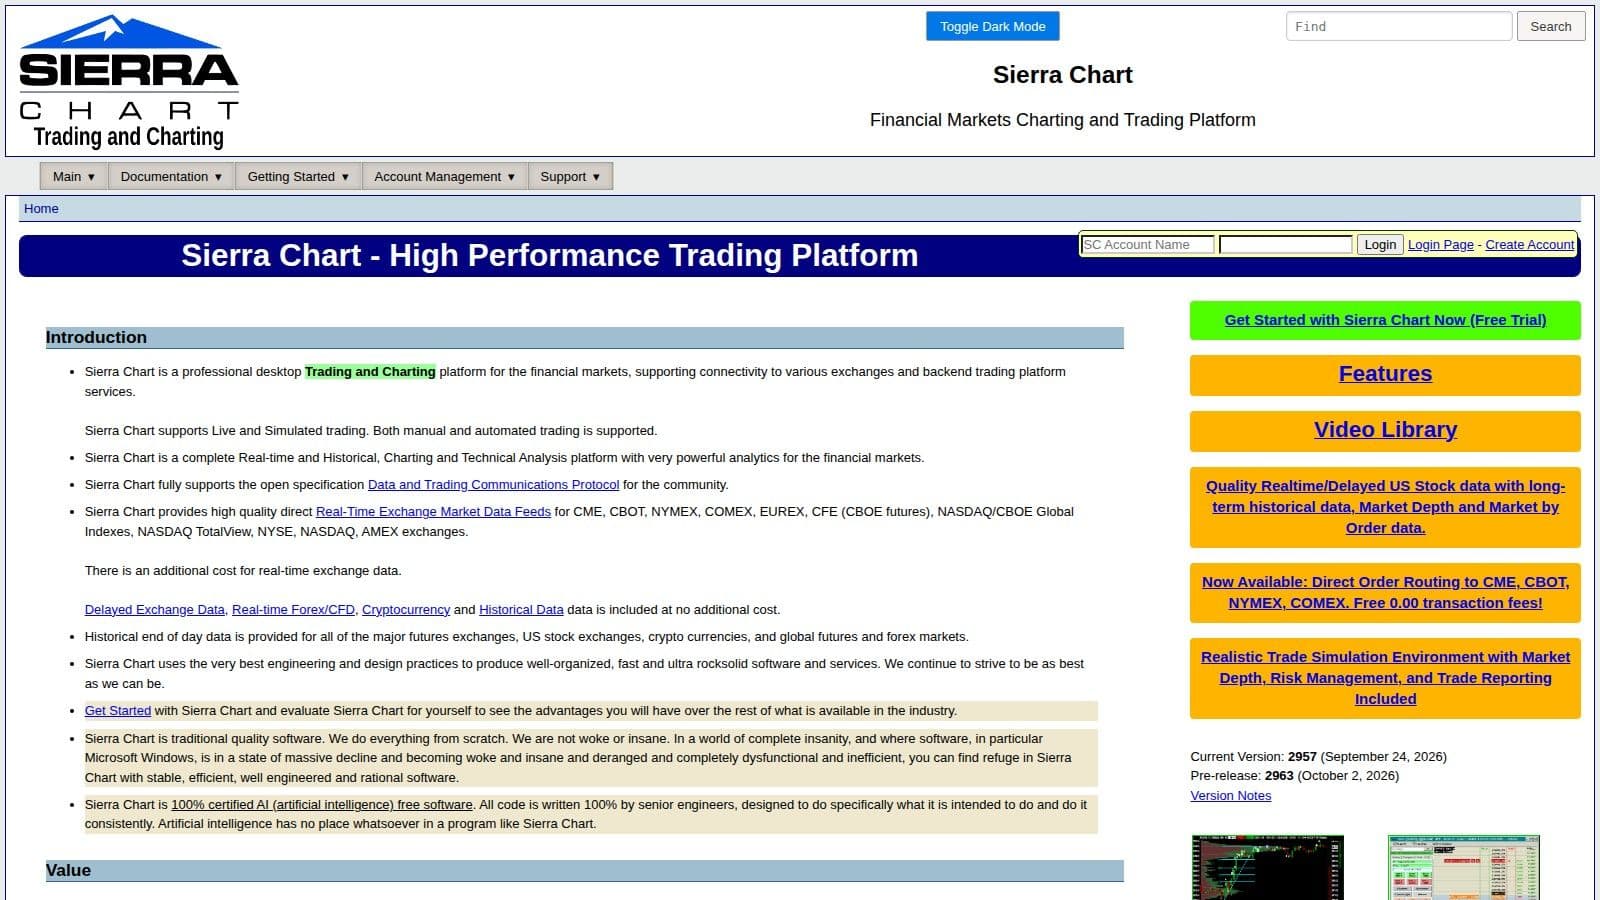
Sierra Chart refers to its footprint charts as "Numbers Bars", a fitting label for a platform designed with professional traders in mind. It’s for those who require raw tick data and complete flexibility in visualizing market structures.
Footprint and Delta Visualization Features
Numbers Bars provide a detailed breakdown of bid/ask volume and delta at each price level within a bar, helping traders pinpoint where aggressive buying and selling are concentrated. Beyond standard delta analysis, the platform offers tools like Cumulative Delta and Delta Divergence, which identifies when price and delta move in opposite directions. Specialized triggers, such as Delta Slingshot and Delta Trap, are also available to flag potential reversals.
Sierra Chart further enhances analysis with features like stacked imbalances, which highlight price levels dominated by one side of the market. Advanced studies, including Candle Taper, Ended Auction, and Poor Structure, provide deeper insights by detecting volume exhaustion, completed auctions, and low-volume zones. The Dominator tool is another standout, isolating high-intent trades by highlighting instances where volume and tick-based deltas surpass specific thresholds.
Order Flow and Depth-of-Market Tools
Sierra Chart’s order flow tools complement its delta features, offering a suite for serious traders. The platform includes a Depth-of-Market (DOM) interface similar to Jigsaw, along with heatmap-style views of historical resting orders. Traders can access dynamic volume profiles, available in 30-minute or 24-hour formats, as well as filtered Time and Sales data. Additionally, multi-column footprints with customizable price/volume layouts and volume profile overlays can be integrated into charts.
Compatible Data Feeds and Pricing
Sierra Chart supports CQG, Rithmic, and Denali data feeds, ensuring compatibility with major exchanges like CME, CBOT, COMEX, and NYMEX. Because footprint data is tick-by-tick, many users host the platform on a CME VPS in Chicago to keep feed latency in the low milliseconds. For CME data on popular contracts, pricing starts at approximately $12 per month - or as low as $4 through broker-funded plans. A standard subscription to Sierra Chart costs about $36 per month.
"The upside, however, is that they have really good, unfiltered historical data." – Trader Dale
Best for Which Type of Trader
Sierra Chart is best suited for professional futures traders who value accurate data and extensive customization options over a sleek user interface. While the platform has a steep learning curve - Axia Futures notes that "for new users the studies interface in Sierra Chart can look quite daunting" - those who invest the time will access a set of professional-grade tools at a competitive price point.
Order flow
Built for scalpers. Heatmaps on dedicated resources.
Order-flow heatmaps and DOM ladders run on dedicated CPU, memory and NVMe, so your charts keep responding during volatility.
See the dedicated hardware







From $29.99/mo · Windows or Linux
For always-on heatmaps and order flow, deploy a Bookmap VPS or choose an ATAS-ready trading server.
2. Quantower
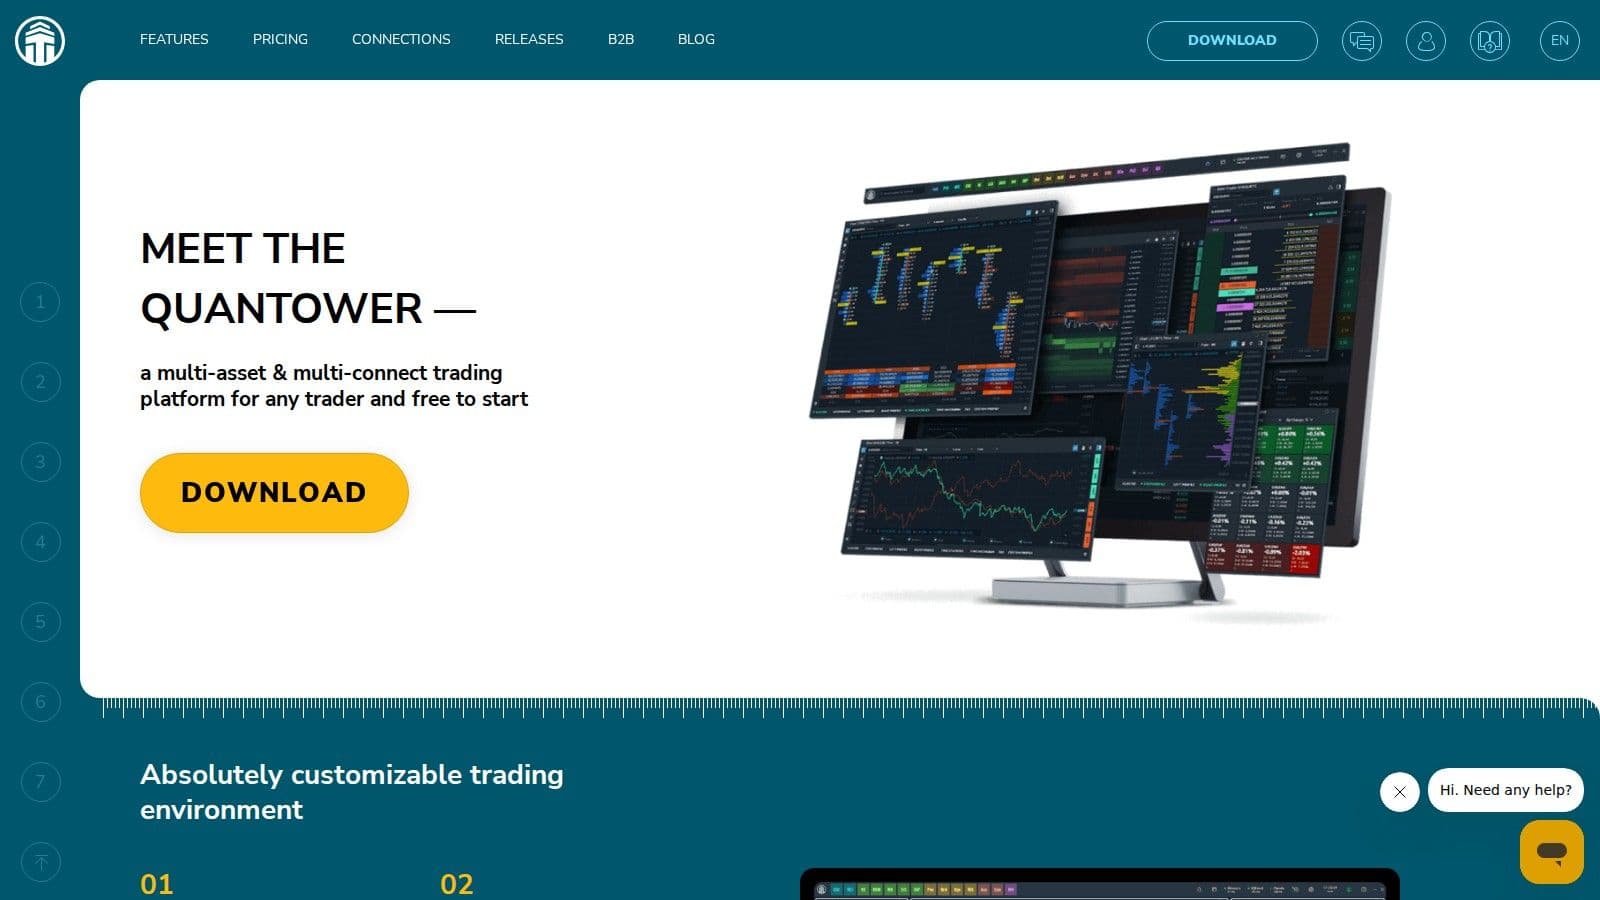
Quantower refers to its footprint charts as "Cluster Charts" and has built a strong reputation for integrating order flow tools across various asset types. Since its launch in 2017, this multi-asset platform has catered to futures trading strategies, stocks, options, crypto, and forex traders. Like other platforms in this category, Quantower uses footprint charts to provide insights into real-time market activity. Its detailed footprint and delta analysis stand out as key features.
Footprint and Delta Visualization Features
The Cluster Charts break down traded volumes at each price level, highlighting buyer and seller activity. Users can explore multiple delta views, including raw Delta, Delta %, and Cumulative Delta. Additional metrics include Buy/Sell Volume, Buy/Sell Volume %, Trades, Average Size, Max One Trade Volume, and Filtered Volume. The Filtered Volume feature is particularly useful, as it filters out smaller trades, allowing traders to focus on institutional-level activity by eliminating retail noise.
Order Flow and Depth-of-Market Tools
Quantower goes beyond footprint charts with its DOM Surface technology, a 3D visualization tool that displays real-time market liquidity and the location of large resting orders. Other tools include Volume Profiles, Time Statistics, Time Histograms, and Historical Time & Sales. The platform also supports multiple VWAP lines, such as Anchored VWAP, and offers over 50 built-in indicators along with unlimited custom overlays.
Compatible Data Feeds
Quantower supports real-time tracking through integrations with Rithmic, CQG, and dxFeed. The pricing options include a monthly subscription of $70 or a $1,590 lifetime license. For traders using Optimus Futures, a white-labeled version called Optimus Flow is available at no extra charge.
Best for Which Type of Trader
Quantower’s comprehensive features make it particularly suitable for active intraday and order flow traders who need a customizable workspace across multiple asset types. Reviewers at asmarterchoice.org highlight its user-friendly interface and responsiveness, making it a solid option for both beginners and seasoned traders. However, its smaller community compared to NinjaTrader means there are fewer third-party tutorials available.
"Quantower prides itself on having a highly advanced system that offers all the tools you need to get stuff done." – asmarterchoice.org
3. ATAS (Advanced Times and Sales)
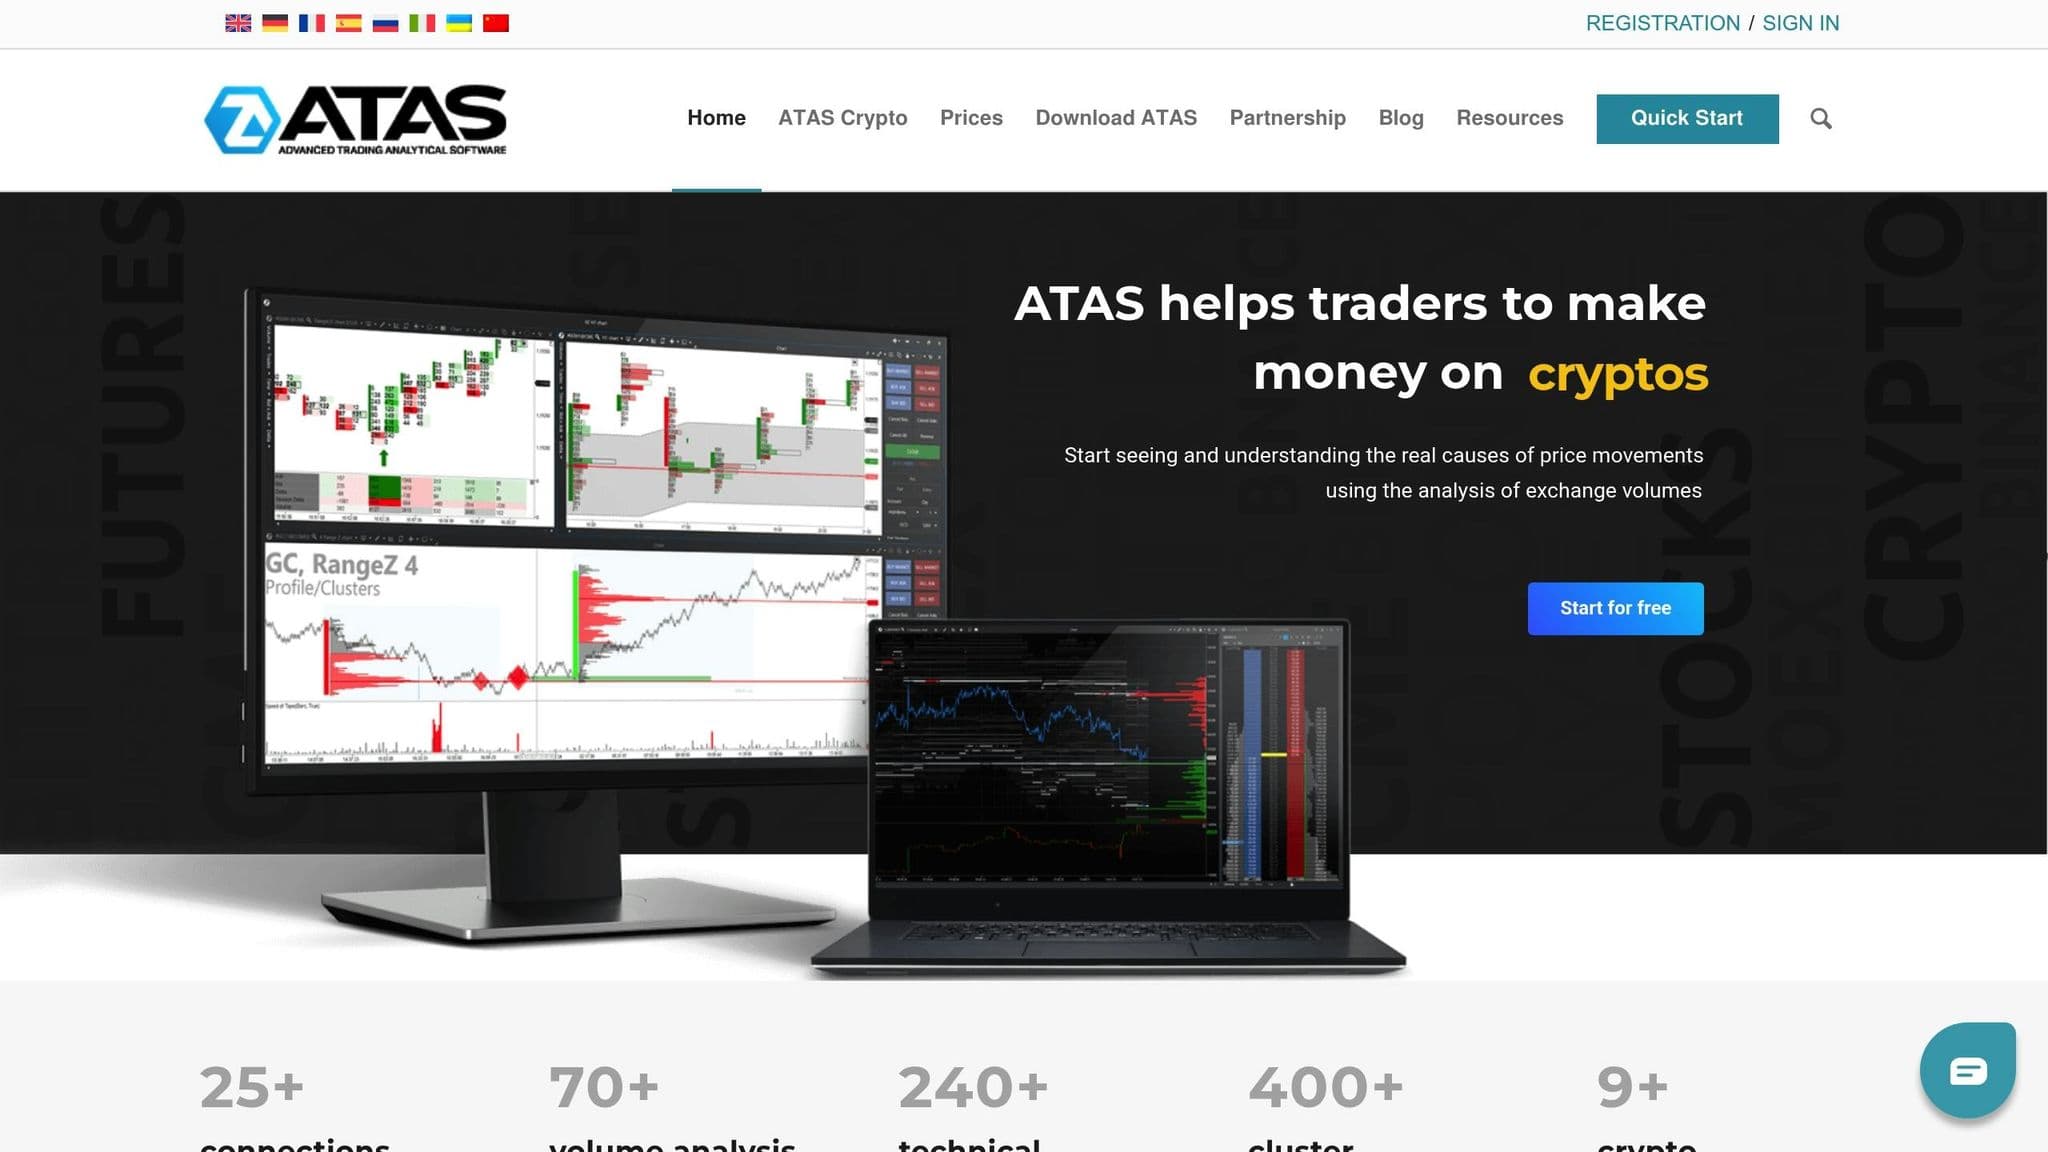
ATAS is a platform specifically designed for traders who rely on volume and delta analysis. Its standout feature is its cluster charts, which provide a detailed view of volume distribution and liquidity changes. This makes it easier to identify where significant orders are taking place. Thanks to its clear visuals and swift performance, ATAS has gained popularity among European traders and professionals trading CME futures. Let’s take a closer look at its footprint and delta visualization tools.
Footprint and Delta Visualization Features
ATAS’s cluster charts break down each price level, uncovering market imbalances. By analyzing delta - the difference between bid and ask volume - traders can spot aggressive buying or selling activity at crucial price points. The platform offers over 70 built-in order flow tools, including features like “Big Trades” to highlight large institutional transactions and “Smart Tape” to cut through market noise. Additionally, it provides multi-dimensional profiles that incorporate volume, delta, trades, time, and bid/ask data.
Order Flow and Depth-of-Market Tools
The platform’s Smart DOM (Depth of Market) tool is designed to enhance trading efficiency by visualizing resting limit orders, enabling one-click trading, and offering access to extensive historical tick data for backtesting. ATAS also allows traders to combine TPO (Time Price Opportunity) charts with Volume Profiles, giving a dual perspective on where the market spent the most time versus where the highest volume occurred - two metrics that often diverge.
Compatible Data Feeds
ATAS works with major data providers like CQG, Rithmic, and dxFeed. It also connects directly to exchanges such as MOEX, NYSE, NASDAQ, and even cryptocurrency platforms like Bitfinex and BitMex. ATAS has a free Start plan, and paid plans cost €24.95 (Plus), €69.95 (Pro) and €89.95 (Ultra) per month, or €19.95 to €49.95 per month on yearly billing (checked on 10 Oct 2026). A 14-day trial gives access to the paid tools.
Best for Which Type of Trader
ATAS is particularly well-suited for traders who prioritize detailed order flow analysis. It’s a favorite among professional intraday traders, scalpers, and volume analysts seeking an in-depth view of market dynamics. Its Euro-based pricing and native support for the Moscow Exchange make it especially appealing to European traders. At the same time, CME professionals value its specialized tools for analyzing high-precision data, especially for instruments like the E-mini S&P 500 and Nasdaq. Some users may find its data-rich interface challenging to master.
"ATAS (Advanced Trading Analytical Software) is a professional platform designed for in-depth order flow and volume analysis. It visualizes real market activity using footprint and cluster charts, showing where large traders enter the market and how liquidity shifts." – Coinpaper Editorial Board
4. Bookmap
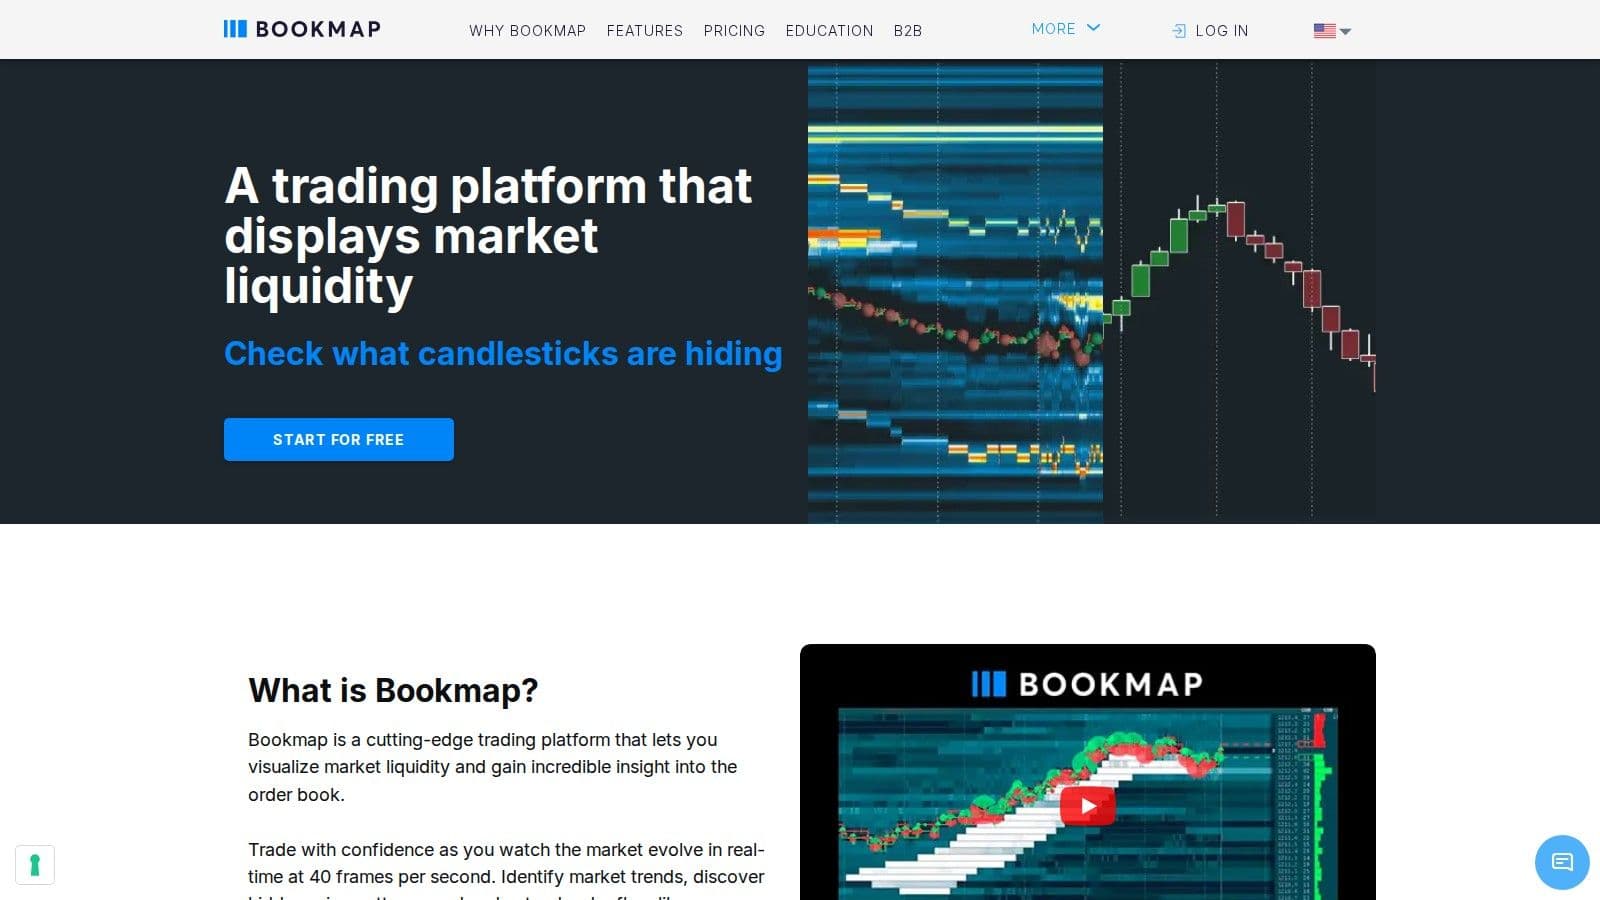
Bookmap takes a different approach to order flow analysis. Instead of focusing only on completed trades like traditional footprint charts, it visualizes the limit order book - showing where buy and sell orders are waiting before they’re executed. Its heatmap updates at an impressive 40 frames per second, using a gradient from red to blue to display historical liquidity. This, combined with its integrated features, provides traders with a clearer understanding of market activity.
Footprint and Delta Visualization Features
Bookmap enhances traditional footprint charts by blending Cumulative Volume Delta (CVD) with Volume Profile columns. This combination tracks the net difference between buying and selling pressure over time. Executed trades are represented as "Volume Dots", which are layered directly onto the heatmap for added clarity. The platform also includes advanced tools like iceberg order detection, large trade identification, and indicators for imbalances and absorption patterns. For crypto traders, it offers a specialized Liquidation Indicator.
Order Flow and Depth-of-Market Tools
Beyond its visualization features, Bookmap provides deeper market insights with its DOM Pro tool. This tool gives a detailed look at the order queue, especially when paired with Market-by-Order (MBO) data from providers like Rithmic or BMData. It’s particularly useful for identifying institutional order sizes. Additionally, Bookmap’s stop detection feature helps traders spot large hidden orders, making it easier to identify key supply and demand zones shaped by institutional activity.
"Bookmap is built specifically to visualize order flow in real time. Unlike traditional charts or indicators, it reveals how price interacts with liquidity, giving traders insight into who is in control at each level." – Bookmap
Compatible Data Feeds
Bookmap supports a wide range of data feeds, connecting to major exchanges like CME, CBOT, COMEX, and NYMEX through its BookmapData service. It also integrates with providers such as Rithmic, CQG, and dxFeed, along with cryptocurrency exchanges like Binance, Coinbase, and Kraken. For crypto traders, free live data is available, while stock and futures data require additional arrangements.
Best for Which Type of Trader
Bookmap is designed for scalpers, day traders, and order flow specialists who rely on real-time insights into institutional liquidity and trapped traders. Its powerful features make it a standout tool among footprint chart platforms. Pricing options include a free Digital plan, Global at $49/month and Global+ at $99/month, or $39 and $79 per month on yearly billing (checked on 10 Oct 2026). Keep in mind, additional data fees may apply.
5. NinjaTrader
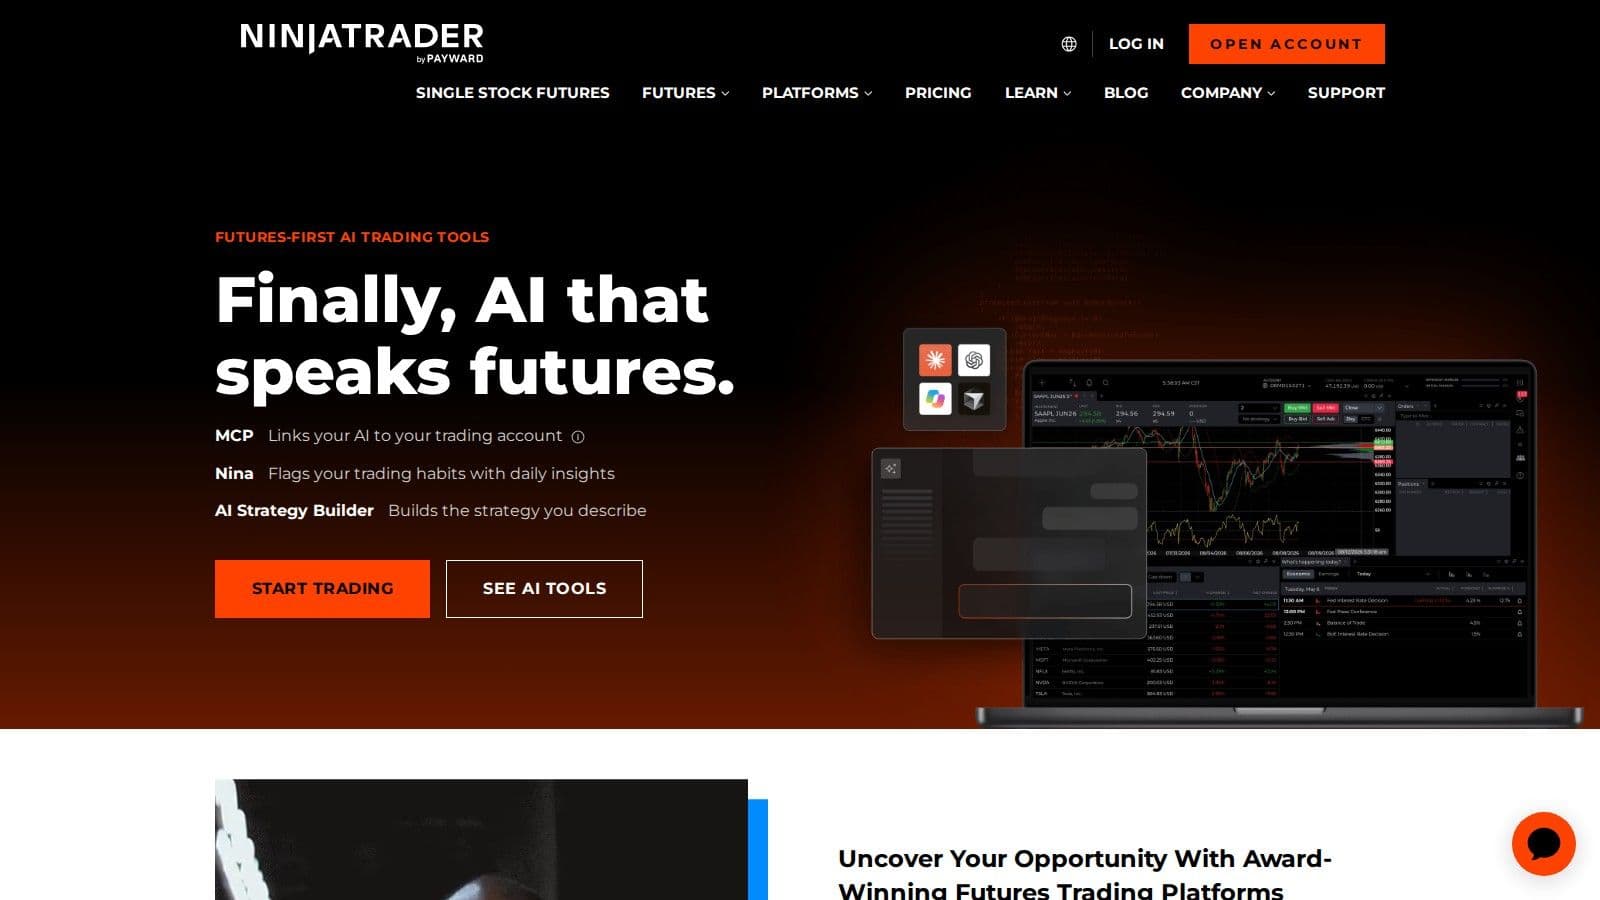
NinjaTrader brings its own approach to footprint charts, offering tools like Volumetric Bars to display buy and sell volume at each price level. The platform’s Order Flow + Suite combines these bars with cumulative delta analysis and the SuperDOM, a depth-of-market tool designed for visualizing resting orders and enabling direct trade execution.
Footprint and Delta Visualization Features
NinjaTrader’s volumetric bars provide a detailed view of delta at each price level, along with cumulative delta, which tracks the ongoing balance of buy versus sell volume over time. The charts automatically highlight imbalances and mark the Point of Control (POC) - the price level with the highest trading activity. For those looking to expand functionality, a range of third-party add-ons, such as AnalyticaChart 4, can enhance these visual tools. With NinjaTrader’s SuperDOM, these insights can translate into direct trading actions.
Order Flow and Depth-of-Market Tools
The SuperDOM offers a real-time look at the limit order book, showing where buy and sell orders are waiting to be executed. By enabling Tick Replay, traders can capture complete historical tick data. Additional features like the Market Depth Map and Trade Detector help identify key zones of volume concentration, absorption, and exhaustion, making it easier to make informed decisions in real time.
Compatible Data Feeds
To fully leverage NinjaTrader’s order flow and Depth-of-Market tools, live market data is essential. The platform connects to major futures exchanges, such as CME, CBOT, COMEX, and NYMEX. Data costs are reasonable, with standard CME fees around $12 per month per exchange or $30–$40 for bundled packages. Traders with funded accounts who execute at least one trade per month can access CME data for a discounted rate of $4 per month.
Best for Which Type of Trader
NinjaTrader is designed for active futures traders, day traders, and scalpers who rely on real-time insights to track market momentum and identify key turning points. While a free version of the platform is available, the full Order Flow + Suite costs $99 per month, or $59 if subscribed to separately. With its combination of built-in tools, affordable data options, and extensive third-party integrations, NinjaTrader has become a go-to platform for retail order flow traders.
6. Jigsaw Trading
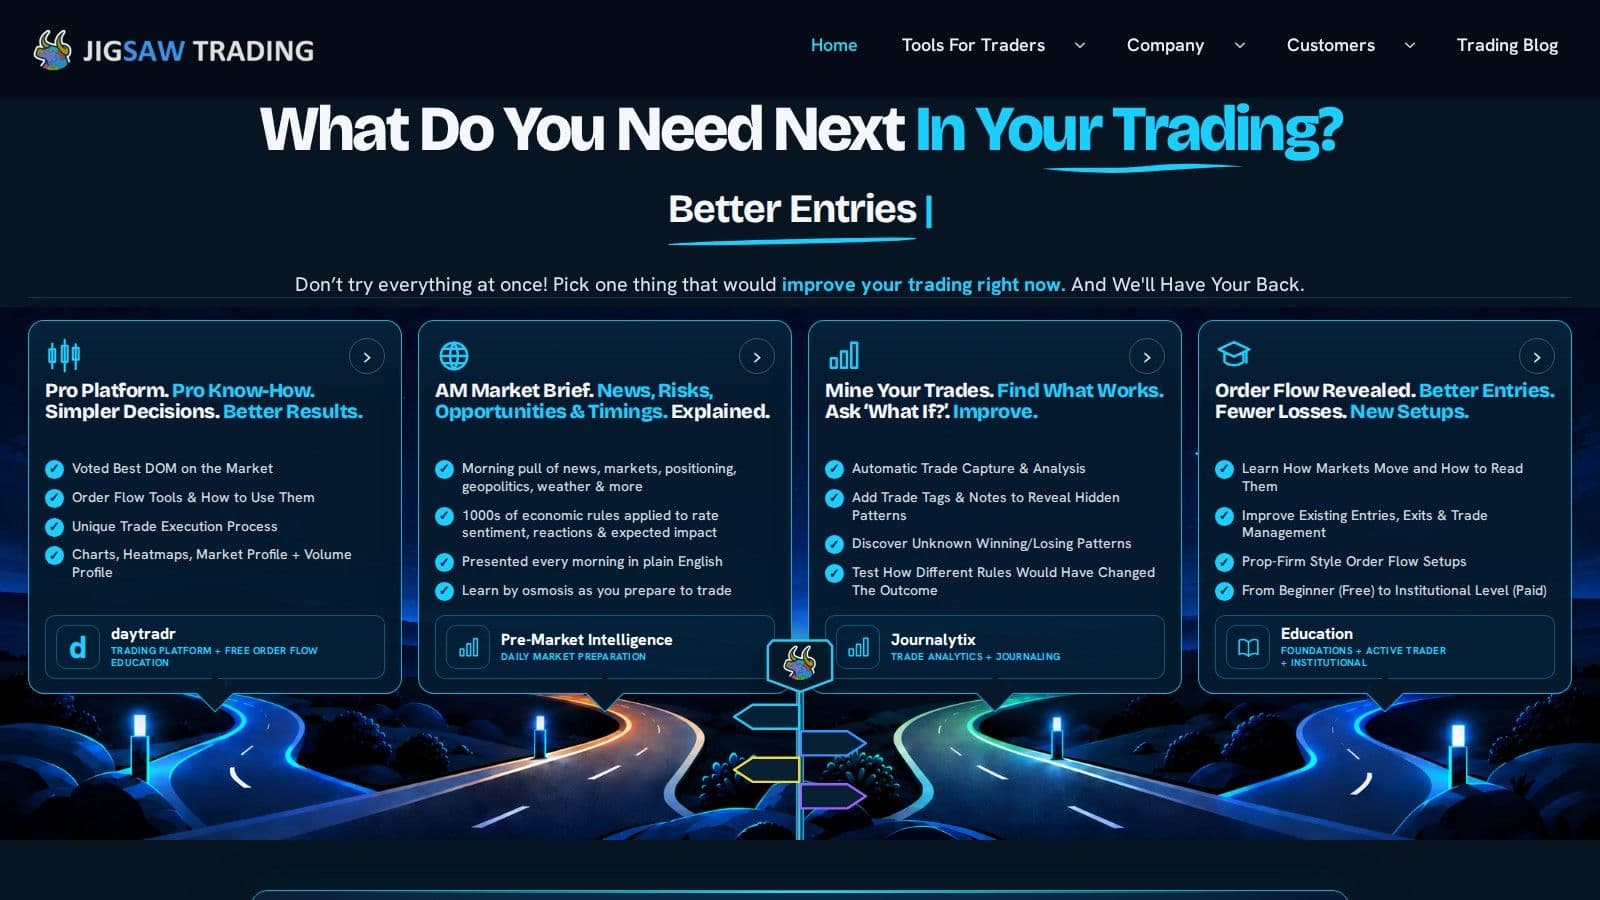
Jigsaw Trading is a platform for traders who rely on order flow trading analysis and market depth visualization. Since its launch in 2011, it has built a user base of over 3,500 traders, offering tools that provide real-time insights into futures and stock markets.
Order Flow and Depth-of-Market Tools
The platform’s interface is designed to give traders a clear, real-time view of bid/ask activity. Using dynamic models and indicators, it supports a range of trading strategies that depend on understanding market depth and order flow.
Compatible Data Feeds
Jigsaw Trading integrates with leading data providers, including Rithmic, CQG, and Tradovate. This allows traders to access real-time tick data from major exchanges like CME, CBOT, COMEX, and NYMEX. For those with funded brokerage accounts and consistent monthly activity, CME data fees can drop to just $4 per month - a notable cost-saving advantage.
Best for Which Type of Trader
Jigsaw Trading is ideal for experienced futures traders who prioritize order flow mechanics in their strategies. It is known for its advanced approach to order flow analysis. That said, its steep learning curve can be a challenge for beginners. Starting at $879 for the most basic version, it’s a significant investment best suited for seasoned traders ready to dive deep into order flow dynamics.
7. MotiveWave
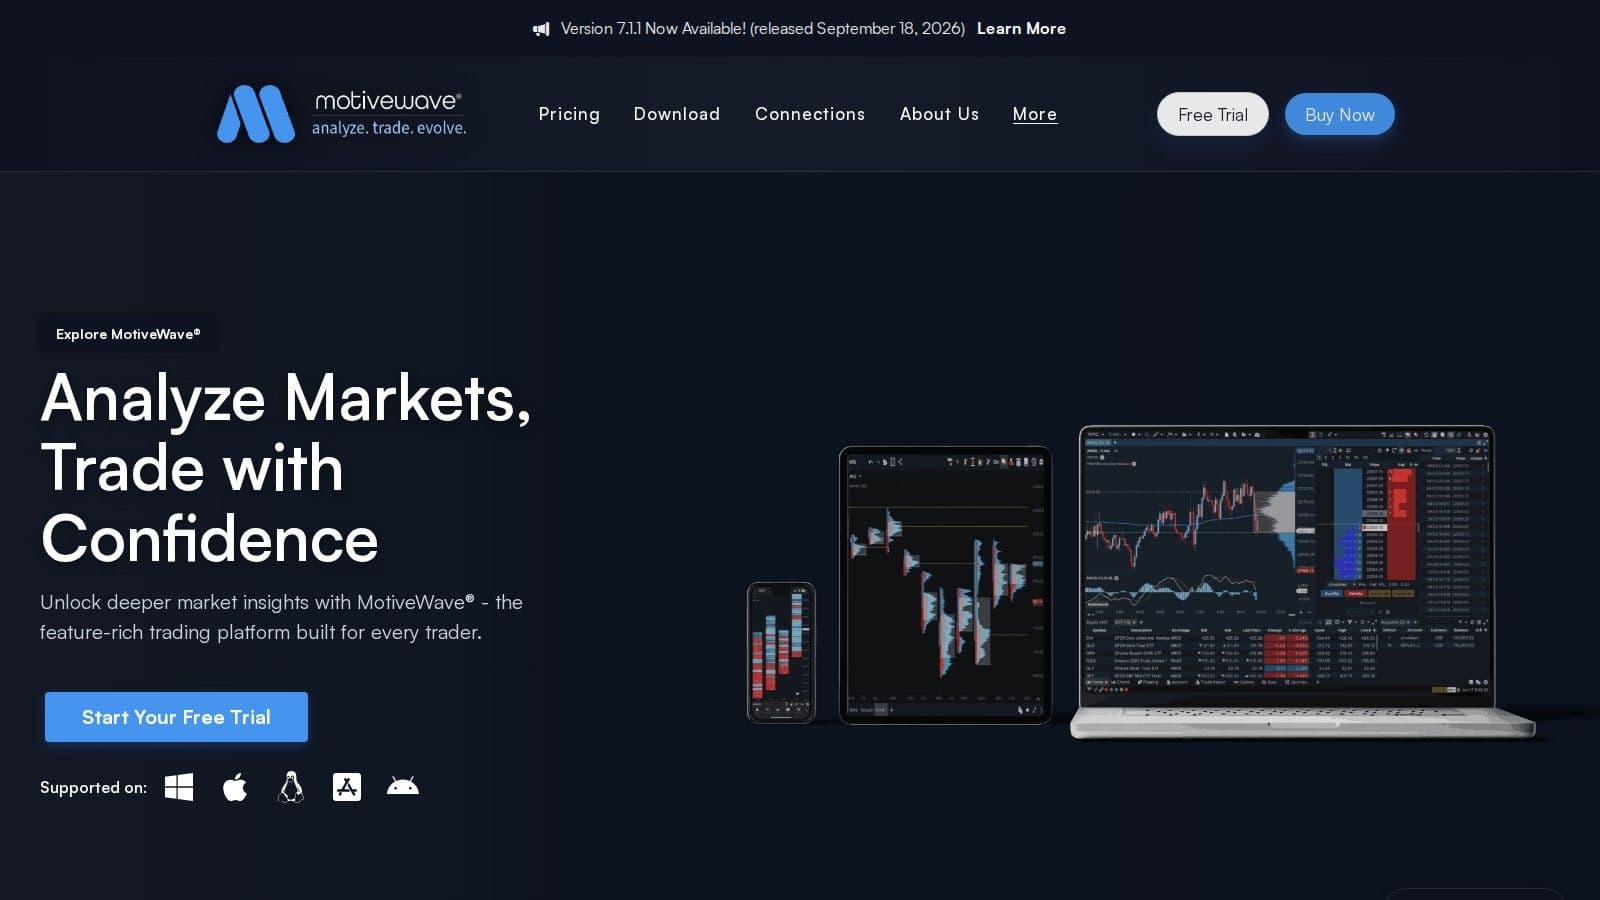
MotiveWave blends traditional technical analysis with advanced order flow capabilities, making it a go-to platform for traders who want the best of both worlds. Its professional-grade charting tools and deep customization options stand out, but what really sets it apart are its footprint and order flow tools. Let’s take a closer look.
Footprint and Delta Visualization Features
MotiveWave’s Volume Imprint study is its version of footprint charts, designed to break down volume into bid and ask components using historical tick data. You can choose from five display options - Profile, Bid/Ask, Ladder, Delta, and Volume - to analyze market activity in detail. The platform also includes Cumulative Delta and Delta Volume studies, which track the net difference between buying and selling pressure, giving traders a clear sense of market sentiment. Additionally, the Big Trades Study pinpoints where large institutional orders are being executed. For a quick snapshot, an optional summary profile provides a ladder-style overview of market activity at a glance.
Uptime
99.999% uptime. Built for 24/7 trading reliability.
Your VPS runs in Tier IV datacenters with redundant power and network, monitored 24/7 on site.
See the uptime SLAFrom $29.99/mo · Windows or Linux
Order Flow and Depth-of-Market Tools
The Order Flow Studies Pack offers 11 powerful tools, including Bid/Ask Volume, Big Trades Study, Cumulative Delta, Delta Volume, and Depth of Market (DOM). The DOM is fully customizable, allowing traders to tweak columns, set exit strategies, create templates, and view both resting orders and recent trades. It also integrates features like TPO/Market Profile, dynamic Volume Profile, and anchored VWAP with three standard deviation bands for more comprehensive analysis.
Compatible Data Feeds
To function effectively, MotiveWave relies on high-quality historical tick data and supports most popular data feeds. These feeds provide real-time data for stocks, forex, cryptocurrencies, and futures. For the platform’s full functionality, the data feed must include Level II or Depth of Market data.
Best for Which Type of Trader
MotiveWave is designed for professional traders and analysts, especially discretionary swing and intraday futures traders who need more than just basic volume data. Its order flow insights make it a strong choice for those looking to improve their trading strategies. MotiveWave offers a polished user interface and includes the Order Flow Studies Pack in its Order Flow, Professional, and Ultimate Editions. For those curious to try it out, the platform provides a 14-day trial of the Ultimate Edition.
8. VolFix.net
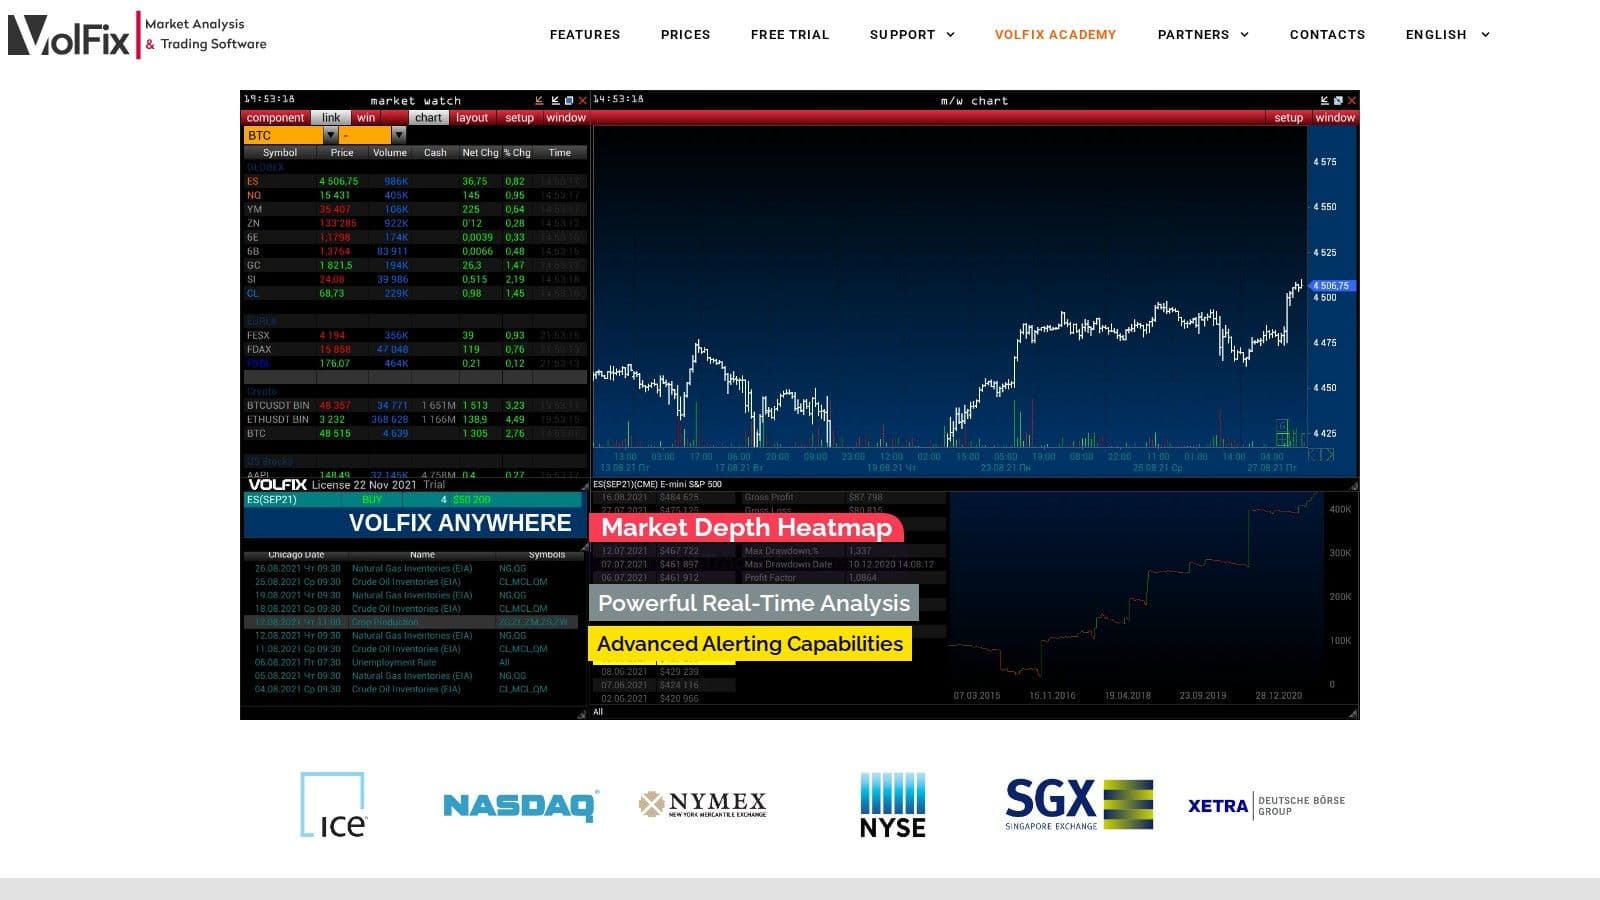
VolFix.net is a specialized platform for volume analysis and order flow trading. With its focus on precision and advanced visual tools, it offers traders a powerful way to interpret market activity. Known for its cluster charts and detailed filtering options, this platform is built for professionals seeking deep insights.
Footprint and Delta Visualization Features
At the heart of VolFix.net are its Cluster Profile and Box Chart tools. These visualizations break down volume distribution, trade counts, and delta at each price level, offering a clear view of market behavior. The platform's delta analysis - whether per bar, cumulative, or at specific price levels - helps traders quickly identify aggressive buying or selling. Additionally, its volume filters make it easier to pinpoint large institutional trades while filtering out retail noise.
Order Flow and Depth-of-Market Tools
VolFix.net goes beyond standard footprint charts by including Market Profile and Volume Profile features. These tools reveal where trading activity clusters over time and at specific price levels, giving traders a better understanding of market trends. The Box Chart is particularly useful for highlighting aggressive buying and selling within individual price bars, offering a detailed look at market dynamics. Designed for active futures trading, the platform handles high-speed data with ease.
Compatible Data Feeds
To function effectively, VolFix.net relies on precise tick-by-tick data, especially from CME Group exchanges. This level of detail is crucial for accurately visualizing bid/ask imbalances, volume clusters, and delta. The platform's ability to process unfiltered historical data ensures reliable footprint analysis for backtesting strategies. With direct exchange connections, traders benefit from real-time data and can respond instantly to market changes.
Best for Which Type of Trader
VolFix.net is ideal for professional traders and institutional teams focused on futures and stocks. Its advanced filtering tools and cluster visualizations make it particularly valuable for those working with high-volume instruments and needing precise volume analysis.
9. TradeStation (with EasyLanguage Add-Ons)
TradeStation isn't a footprint charting platform first, but you can add footprint views with indicators written in EasyLanguage, its scripting language, either your own or from third-party developers. The tick-chart versus time-chart comparison helps separate the chart's sampling method from the order-flow detail shown in a footprint.
Footprint and Delta Visualization Features
Footprint-style indicators on TradeStation break each bar into the trades executed at the bid and at the ask, usually with a delta reading. Because they are add-ons, features such as imbalance marking, cumulative delta and volume profiles depend on the indicator you choose.
Order Flow and Depth-of-Market Tools
TradeStation's own order flow tool is its Market Depth window. It shows Level 2, the resting limit orders to buy and sell at each price, with a detail pane for order activity at every level.
Compatible Data Feeds
TradeStation charts run on the market data TradeStation supplies through your account, including real-time futures data from CME Group exchanges, so you don't connect CQG, Rithmic or dxFeed as you would on most platforms here. Footprint charting still depends on real-time tick data, so subscribe to real-time data for each market you plan to read.
Best for Which Type of Trader
TradeStation suits active traders who want broker, data and charts in one account and are comfortable adding an EasyLanguage footprint indicator. Traders who want footprints built in may prefer one of the dedicated platforms above.
10. MultiCharts (with Order Flow Indicators)
MultiCharts is a powerful platform for order flow analysis, thanks to its PowerLanguage scripting and advanced backtesting tools. This combination enables traders to dive deep into custom strategy development while rigorously testing their ideas.
Footprint and Delta Visualization Features
With its scripting capabilities, MultiCharts allows users to create order flow indicators, such as footprint-style charts and volume delta overlays. These tools can be customized to fit specific trading needs. The platform also provides access to comprehensive historical data, which is essential for precise order flow analysis. Its visualizations are particularly well-suited for systematic strategy development.
Order Flow and Depth-of-Market Tools
MultiCharts shines in its ability to automate portfolio-level strategy testing. It offers detailed performance metrics, making it a go-to choice for traders who rely on backtesting to refine their order flow-based strategies.
Compatible Data Feeds
To support its advanced features, MultiCharts works with top-tier data providers like CQG, Rithmic, and Interactive Brokers. These connections ensure access to high-quality, unfiltered tick data, which is crucial for accurate analysis. The platform also offers Level II or Depth of Market (DOM) data, giving traders a clear view of the bid-ask matrix and volume clusters at each price level.
Best for Which Type of Trader
MultiCharts is ideal for systematic traders focused on strategy development, backtesting, and automation. If your trading revolves around order flow data, this platform offers the tools you need. MultiCharts provides a 30-day free trial, with subscription plans ranging from $99 to $299 per month. Our guide to MultiCharts licensing and costs compares the free, subscription and lifetime options in more detail.
Platform Comparison Table
Here's a quick look at how different platforms stack up in terms of key features, data feed compatibility, visualization tools, and monthly costs.
| Platform | Key Visualization Tools | Compatible Data Feeds | Ideal For | Platform Fee |
|---|---|---|---|---|
| Sierra Chart | Number Bars, Delta Divergence, Stacked Imbalances, DOM Heatmaps | CQG, Rithmic, Denali, Teton | Professional futures traders needing unfiltered historical data | ~$36 |
| Quantower | Cluster Charts, Time Statistics, Historical T&S, DOM Surface | Rithmic, CQG, Tradovate, Binance, Interactive Brokers | Multi-asset traders (futures, crypto, forex, stocks) | ~$70 |
| ATAS | Footprint, DOM, Level II Data, Smart Tape, Volume Profiles | Rithmic, CQG, TT, IQFeed | European and CME traders prioritizing clarity and speed | Free to €89.95 |
| Bookmap | Heatmap, Volume Dots, CVD, Iceberg Detection, MBO Data | BookmapData, dxFeed, Rithmic | Traders focused on liquidity visualization and limit order book dynamics | Free to $99 |
| NinjaTrader | Volumetric Bars, Cumulative Delta, VWAP, SuperDOM | Kinetick, CQG, Rithmic | Retail futures traders seeking a large community and third-party plugins | Free–$99 |
| Jigsaw Trading | Depth & Sales, Auction Vista (Heatmap), Reconstructed Tape | Rithmic, CQG, IQFeed, NinjaTrader integration | Order flow specialists and execution-focused traders | $879 (one-time) |
| MotiveWave | Footprint Studies, Historical Tick Data, Summary Profiles, Delta Overlays | Most major brokers and data feeds | Discretionary swing and intraday futures traders | Varies |
| VolFix.net | Cluster Charts, Imbalance Delta, Profile Analysis | Professional-grade institutional feeds | Institutional traders and volume analysis specialists | Not publicly listed |
| TradeStation | Volume Delta Analysis, Footprint-style Plugins via EasyLanguage | TradeStation proprietary feeds | Traders using EasyLanguage for custom indicators | Varies |
| MultiCharts | Footprint-style Charts, Volume Delta Overlays via PowerLanguage | CQG, Rithmic, Interactive Brokers | Systematic traders focused on backtesting and automation | $99–$299 |
Key Highlights
This table provides an overview of the platforms discussed earlier, making it easier to pinpoint which one aligns with your trading needs. Here are some standout points:
- Sierra Chart is a top choice for traders who need access to unfiltered historical data.
- Bookmap shines with its real-time liquidity visualization, delivering 40 frames per second.
- ATAS combines user-friendly design with professional-grade tools.
- For budget-conscious traders, NinjaTrader offers a free version that works well with third-party indicators, avoiding the $99 monthly fee.
- Jigsaw Trading appeals to serious order flow traders with its one-time $879 fee, though it comes with a steep learning curve.
Keep in mind that platform fees listed above do not include data feed costs, which typically start at around $12 per month per exchange. Discounts may be available for high-volume accounts.
What Hardware Order Flow Platforms Need
Footprint charts and heatmaps process every trade and order book update in real time, so the hardware that matters most is fast CPU cores and enough RAM. Busy markets like ES, NASDAQ futures or crude oil, several charts at once and long tick histories all add to the load.
Our ATAS VPS page lists the setups traders use for order flow.
Dedicated CPU cores matter as much as raw speed. On a server with shared cores, another workload can slow your charts at the moment the market moves fast, which is when order flow data matters most. Tools that scan large histories, such as iceberg detection or historical depth, add more load, so leave headroom above your everyday use.
QuantVPS Performance plans run on AMD Ryzen 9 9950X CPUs with dedicated cores and DDR5 memory, and the pricing page sizes each plan by how many charts or strategies you run at once (checked on 10 Oct 2026). For CME futures, host the platform on a Chicago VPS, near the exchange.
Conclusion
Footprint chart platforms give futures traders an edge by offering a level of detail that traditional candlestick charts simply don't provide. They reveal the precise volume flow at the bid and ask prices, uncovering insights like absorption, iceberg orders, and institutional activity that are otherwise hidden.
Richard Wyckoff, a renowned market theorist, once said: "Study your charts not from the point of view of comparison of stock formations and behavior patterns, but from the point of view of motives of those who dominate it and successes and failures of buyers and sellers when they struggle for power at each move." This philosophy is at the heart of order flow trading tools, emphasizing the importance of clear and precise data visualization.
These platforms are built to handle massive amounts of data in real time. Tools like Bookmap, for instance, can display market activity at up to 40 frames per second, processing thousands of bid/ask updates every moment. To keep up, the platform needs fast, dedicated CPU cores and enough RAM, so complex visuals like heatmaps, volumetric clusters, and 3D DOM surfaces render without delays. Test display responsiveness with the actual instruments, data feed and monitor layout before relying on the setup.
FAQs
What are footprint charts, and how do they provide more insight than traditional candlestick charts?
Footprint charts offer futures traders a deeper look into market activity, going well beyond the basics of traditional candlestick charts. While candlesticks focus on price movement - specifically the open, high, low, and close - footprint charts take it a step further by displaying the actual volume traded at each price level within a single candle. They provide insights into bid-side and ask-side volume, volume delta, and order flow imbalances, offering a clear picture of which side - buyers or sellers - had the upper hand during that time.
To put it simply, candlestick charts show where the price moved, but footprint charts reveal how it moved and why. By visualizing the distribution of trades and the flow of orders, footprint charts enable traders to better understand market behavior, giving them the tools to make more informed trading decisions.
What is the best footprint chart platform for beginners in order flow trading?
For those new to order flow trading, NinjaTrader is often a go-to platform. One of its biggest advantages is the free version, which gives users access to essential charting features. This means you can examine footprint charts and start exploring without any upfront investment. Plus, it’s compatible with popular add-ons like Jigsaw, GomMP, and OrderFlow+, which can take your order flow analysis to the next level as you become more experienced.
NinjaTrader also offers extensive tutorials and detailed documentation. These resources make it easier for beginners to grasp key concepts like reading footprint charts, identifying bid/ask imbalances, and monitoring market depth. On top of that, the platform boasts an active community and a treasure trove of shared resources, making it an ideal choice for anyone just starting their trading journey.
How can GPU servers improve the performance of order flow trading platforms?
Platforms like Bookmap, Sierra Chart, and Quantower handle thousands of bid/ask updates every second, and most of that work falls on the CPU and memory, not a graphics card. For a trading server, fast dedicated CPU cores and enough RAM do more for smooth heatmaps, delta clusters and DOM tools than a GPU.
Size the server by how many charts and DOM windows you run at once, and leave headroom for volatile sessions. This matters most for futures traders who analyze live market depth and detect imbalances in real time.


