
When it comes to trading, tick charts and time charts are two essential tools that serve different purposes. Tick charts form bars after a set number of trades, offering a detailed view of market activity during high-volume periods. Time charts, on the other hand, generate bars at fixed intervals, providing a consistent and steady view of trends regardless of trading activity.
Key Takeaways:
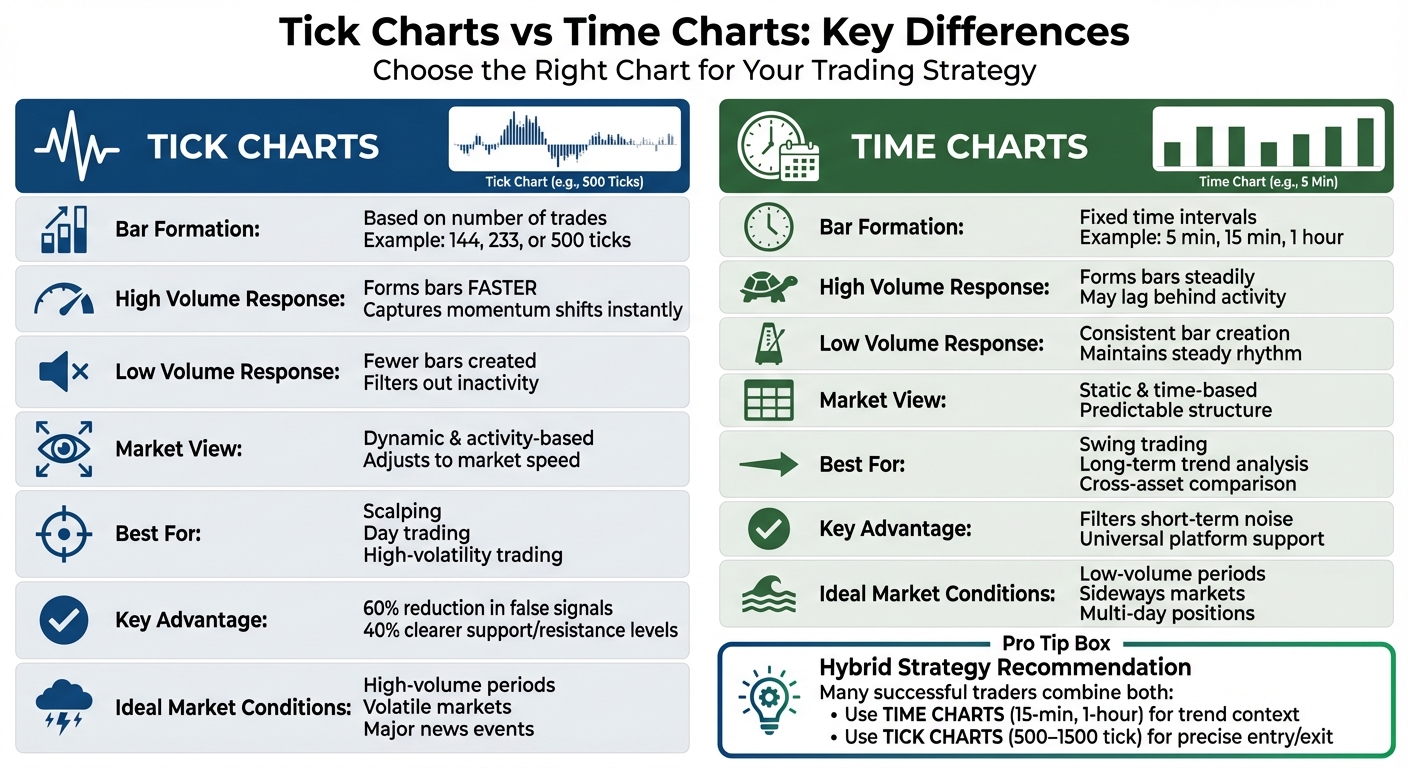
- Tick Charts: Best for scalping and day trading. They react to market activity, forming bars faster during high trading volume and slowing down during quiet periods. Ideal for spotting micro-trends and precise entry points.
- Time Charts: Perfect for swing trading and long-term analysis. Bars form at regular intervals (e.g., 5 minutes, 1 hour) and work well in low-volume or sideways markets. Great for identifying broader trends and comparing assets.
Quick Comparison:
| Feature | Tick Charts | Time Charts |
|---|---|---|
| Bar Formation | Based on number of trades | Fixed time intervals |
| High Volume | Forms bars faster | May lag behind activity |
| Low Volume | Fewer bars, less noise | Consistent bar creation |
| Best For | Scalping, day trading | Swing trading, trends |
Choose the right chart based on your trading strategy and market conditions. Tick charts are great for precision in active markets, while time charts excel in providing a steady view of trends. Many traders combine both for a balanced approach.
Tick Charts vs Time Charts: Complete Comparison Guide for Traders
What Are Tick Charts?
A tick chart builds new bars based on the number of trades, not time. Instead of generating a bar every few minutes or hours, a tick chart creates one after a set number of transactions - like 144, 233, or 610 trades - have occurred. How quickly a bar forms depends entirely on market activity. Each bar captures key metrics: the "Open" reflects the first trade, the "High" and "Low" record the price extremes within that sequence, and the "Close" marks the final trade. Traders often configure tick charts using Fibonacci-based intervals, which are common benchmarks. This adaptability makes tick charts particularly useful during volatile market conditions.
How Tick Charts Work
A bar is completed once the specified number of trades, or ticks, is reached. For instance, a 144-tick chart generates a new bar after exactly 144 transactions. This structure allows tick charts to adjust to market activity, offering detailed insights during busy periods while filtering out unnecessary noise during slower times.
"Unlike time-based charts, which periodically construct bars/candles in fixed blocks of time... tick charts create bars based on the number of successive ticks, irrespective of the elapsed time." - TradingView
The speed at which bars form becomes a real-time indicator of market momentum. Faster bar formation can signal an increase in activity, which might hint at a potential trend reversal or continuation. Additionally, platforms like TradingView provide access to as many as 40,000 tick-based bars, allowing traders to analyze detailed historical market behavior.
Benefits of Tick Charts
Tick charts stand out because they cut through market noise during quiet periods. Since bars are only created when actual trades occur, they avoid the "empty candles" that time-based charts often display during low-activity periods.
For scalpers and day traders, tick charts offer a closer look at short-term price swings that might be hidden within a single time-based candle. During breakouts or periods of high volatility, tick bars close faster due to increased trading activity, providing earlier entry signals and clearer views of potential trend reversals compared to traditional time charts. This level of precision is especially helpful for traders focusing on small, quick profits or monitoring price behavior around key support and resistance levels in real time.
"Tick charts are beneficial because they allow traders to gather information about market activity. Since tick charts are based on a certain number of transactions per bar, we can see when the market is most active, or sluggish and barely moving." - Investopedia
What Are Time Charts?
A time chart organizes trading data into bars that form at fixed time intervals - like 1, 5, or 15 minutes, or even 1 hour - regardless of how many trades occur during that period. Once the set time interval ends, a new bar is created automatically. This predictable structure makes time charts a staple tool in technical analysis.
Run 24/7 while you sleep. Keep bots, platforms, and trade copiers online on a dedicated VPS.
Low-latency VPS hosting for your trading platform.
From $59.99/mo
Each bar summarizes key trading data: the Open from the first trade, the High from the highest price, the Low from the lowest price, and the Close from the last trade during the interval. For instance, on a 60-minute chart, bars form at consistent times, such as 9:30 a.m., 10:30 a.m., and so on throughout the trading session.
"Time is the only consideration in this computation, meaning that volume and trading activity has no bearing. Thus, there will always be the same number of bars per trading day when using the same time interval."
– Investopedia
How Time Charts Work
The closing of a bar on a time chart is dictated solely by the clock. For example, a 5-minute bar will close exactly 5 minutes after it begins, no matter how much or how little trading occurs during that time. This time-based consistency ensures that a 60-minute chart will produce the same number of bars every trading day, making it easier to compare historical data.
Trading platforms typically offer a range of time intervals, from as short as 1 second to as long as 10 years (equivalent to 86,400 seconds, 1,440 minutes, or 12 months). When one interval ends, the next bar begins with the first trade recorded after the previous one closes.
Benefits of Time Charts
Time charts bring several advantages to the table, starting with their ability to simplify market data. By grouping trades into fixed intervals, they filter out short-term noise, making it easier to spot long-term trends. This standardized format also allows traders to compare different assets side by side, as the time intervals remain consistent across charts.
"Time charts provide a uniform way to view different assets, allowing traders to compare them and assess their performance."
– Alison Plaut, Contributor, Benzinga
Even in low-volume or sideways markets, time charts maintain a steady rhythm, producing bars at regular intervals regardless of trading activity. This makes them especially valuable for swing traders and investors who focus on broader market trends. Additionally, classic chart patterns - like pennants, wedges, and triangles - are often applied to time-based intraday charts to guide trading decisions.
Tick Charts vs Time Charts: Key Differences
The primary distinction lies in how bars are formed. Time charts stick to a fixed schedule, regardless of trading activity, while tick charts adjust bar creation based on the number of trades.
This difference shapes how each chart reacts to market conditions. During periods of high trading volume, tick charts generate bars quickly, capturing even the smallest shifts in momentum. Meanwhile, time charts maintain their steady rhythm, which can lag behind rapid market movements. On the flip side, when trading slows down, tick charts essentially "pause", ignoring periods of inactivity. Time charts, however, continue printing bars on schedule, which can result in cluttered visuals with minimal price movement.
Comparison Table
| Feature | Tick Charts | Time Charts |
|---|---|---|
| Bar Trigger | Set number of trades (e.g., 500 ticks) | Fixed time intervals (e.g., 5 minutes) |
| High Volume Response | Bars form faster, showing momentum shifts | Bars form steadily, potentially lagging |
| Low Volume Response | Fewer bars, filtering out inactivity | Consistent bar creation, adding potential clutter |
| Market View | Dynamic and activity-based | Static and time-based |
| Noise Filtering | Filters out inactive periods | Smooths short-term price volatility |
| Best For | Scalping, day trading, high-volatility trading | Swing trading, long-term trends |
| Consistency | Variable bar duration | Uniform bar duration |
Bar Formation Mechanism
The way bars are created explains why these chart types behave so differently. Time charts are predictable, producing bars at regular intervals. This uniformity makes it easier to analyze historical trends and spot recurring patterns.
Tick charts, on the other hand, rely on the number of trades. For example, a 200-tick chart generates a new bar after 200 trades occur. During a volatile breakout, this might happen in seconds, while during a lull, it could take minutes. Some traders even use Fibonacci-based tick settings - like 144, 233, or 610 ticks - to strike a balance between responsiveness and smoother price movements. These unique mechanics influence how each chart captures shifts in trading volume.
Response to Market Volume
One of the standout features of tick charts is their sensitivity to market activity. When trading volume spikes - such as during the release of major economic data - a tick chart reacts instantly, forming bars more frequently to reflect the speed and intensity of the market. In contrast, a time chart, like a 5-minute chart, condenses this flurry of activity into fewer bars, potentially masking crucial trading signals.
"Tick-based charts form bars based on the number of transactions rather than fixed time periods, providing you with a more granular view of the market."
– TradingView
This responsiveness makes tick charts particularly appealing for scalpers looking to capitalize on fast-moving markets. At the same time, time charts offer a consistent view of trends, making them a reliable tool for swing traders and those analyzing long-term movements. Choosing between the two depends largely on your trading strategy and the type of market activity you're targeting.
Pros and Cons of Tick Charts vs. Time Charts
Every trading chart comes with its own set of strengths and weaknesses. Knowing these trade-offs can help you choose the right tool for your trading strategy and the specific market conditions you’re working with.
Comparison Table
| Chart Type | Advantages | Disadvantages |
|---|---|---|
| Tick Charts | • Detailed View: Captures micro-patterns like flags and pullbacks during fast market moves - patterns that time charts often miss. • Momentum Insights: Reflects the true strength of a move by focusing on transaction count rather than elapsed time. • Efficient During Inactivity: Compresses periods of low activity, such as lunch hours, into fewer bars. • Earlier Signals: Reduces false signals by 60% and provides 40% clearer support and resistance levels. |
• Platform Challenges: Many platforms don’t support backtesting, server-side alerts, or mobile access for tick charts. • Overload in Volatile Markets: Can produce too many bars during high volatility, making it harder to analyze effectively. • Non-Standard: Requires tuning for each asset or contract and is harder to compare across different markets. |
| Time Charts | • Trend Clarity: Offers a smoother view of long-term trends by filtering out short-term market noise. • Broad Compatibility: Supported by all trading platforms and apps, with years of historical data available. • Consistency: Provides a stable structure for time-based strategies and simplifies cross-asset comparisons. |
• Missed Action: Can overlook significant price movements within a single time bar, delaying trade signals. • Low-Volume Bars: Continues printing bars even during periods of inactivity, which can clutter the chart. • Fixed Intervals: Doesn’t adjust to shifts in market speed or volatility, which might compress high trade volumes into a single bar. |
Each chart type serves a different purpose, making them suitable for various trading scenarios. Traders often combine both chart types to get the best of both worlds: tick charts for detailed execution and time charts for broader context. This approach ensures a comprehensive view without duplicating efforts.
One thing to keep in mind: tick charts are resource-heavy. High-volume spikes can cause platform lag, especially if you’re running multiple charts at once. Time charts, on the other hand, are much less demanding on your system, making them a better fit for traders using older hardware or managing several monitors. This technical aspect is another factor to consider when deciding which chart type aligns best with your trading style.
When to Use Tick Charts
Tick charts shine in fast-paced markets, offering traders a detailed view of every price movement as it unfolds.
High-Volume Market Conditions
Tick charts are particularly useful during periods of heightened trading activity. They adapt to transaction surges by speeding up bar formation when activity spikes - like during a Federal Reserve announcement or a major earnings release - and slowing down during quieter moments. This flexibility filters out unnecessary noise while emphasizing meaningful price shifts. For instance, a 1,000-tick chart might generate twenty bars in a single minute during a high-impact event, but only two bars the next minute as trading activity settles.
"A tick chart shows the real heartbeat of the market. Instead of smoothing activity into time bars, it reveals the sequence of trades." - MoonTrader Team
This ability to capture the market's rhythm makes tick charts a natural fit for strategies like scalping and day trading.
Scalping and Day Trading Scenarios
Tick charts are a go-to tool for scalpers and day traders because they highlight micro-movements in the market. These charts allow traders to time their entries and exits with precision, as each candle represents a fixed number of trades. The size of these candles often reflects trading volume, signaling moments of strong conviction when prices change rapidly.
Stay online and closer to execution. Choose a VPS location for CME futures, New York markets, London FX, API trading, and more.
Host your platform near the market route that matters.
From $59.99/mo
Many traders combine tick charts with time-based charts for a more comprehensive approach. For example, they might use a 15-minute chart to identify the broader trend and key support or resistance levels, then switch to a 500-tick or 1,000-tick chart to fine-tune their trades. For ultra-fast scalping, traders often experiment with smaller tick intervals to capture even the tiniest price fluctuations. Platforms like TradingView enhance this strategy by offering up to 40,000 bars for tick-based intervals, providing the granular detail needed for rapid trading decisions.
Keep an eye out for "churning", where excessive sideways bars suggest fading momentum. Recognizing this pattern can signal the right time to exit a trade.
When to Use Time Charts
Time charts are particularly useful in markets with low activity or sideways movement, offering a reliable framework for analysis regardless of market conditions.
Low-Volume or Sideways Markets
One of the key strengths of time charts is their ability to maintain a steady rhythm, even during periods of low trading activity. For example, during pre-market hours, lunchtime lulls, or holiday-shortened sessions, a 15-minute chart will still produce bars consistently at set intervals. On the other hand, tick charts may generate very few bars during these quieter periods, making them less effective for analysis.
"Time charts offer consistent visualization of market activity throughout the day." - Alison Plaut, Contributor, Benzinga
This consistency is especially helpful in range-bound markets - where prices fluctuate between support and resistance levels. Time charts filter out minor, inconsequential price movements, offering a simplified and standardized view of the market. This clarity allows traders to better identify when the market is gearing up for a significant move. Such a structured approach is ideal for strategies that focus on longer-term trends.
Swing Trading Applications
Swing traders, who often hold positions for several days or weeks, find time charts invaluable for identifying broader trends and historical price cycles. Charts with longer intervals, like 60-minute or daily time frames, can highlight patterns such as triangles, wedges, and pennants - patterns that might be too subtle or fragmented in tick charts. The fixed intervals of time charts also make it easier to compare price action across various assets, helping traders spot relative strength or weakness. This feature aligns well with the trend analysis needed during low-volume periods.
"Time charts can help traders identify long-term trends and patterns more easily to show historical price movements and cycles." - Anna Yen, CFA, Contributor, Benzinga
Swing traders often follow strategies like the 11 a.m. trading rule, which suggests that if a trend reversal hasn’t occurred by 11 a.m. EST, the chances of a major shift later in the day decrease. Time charts are particularly effective for tracking such intraday milestones. By filtering out short-term noise, they allow traders to concentrate on the more significant movements that influence multi-day positions.
Combining Tick Charts and Time Charts
Experienced traders often use a combination of tick charts and time charts to refine their strategies. The key is to let time charts provide the broader market context while using tick charts for precise execution. For example, traders might rely on time-based intervals like 15-minute or 60-minute charts to identify overall trends, then switch to tick charts to zero in on entry and exit points during periods of high trading activity.
"A tick chart in trading works differently. Instead of time, each bar forms after a set number of trades. This way, you see the real order flow - the 'heartbeat' of the market." - MoonTrader Team
Hybrid Strategies Table
Different trading styles pair these chart types in unique ways. Below is a table outlining how traders combine them to balance market analysis with execution precision:
| Trading Style | Primary Chart (Trend) | Complementary Chart (Entry) | Benefits |
|---|---|---|---|
| Scalping | 1‑Minute or 5‑Minute Time | 144 or 233 Tick | Filters noise; delivers ultra-fast entry signals during high-volume periods. |
| Day Trading | 60‑Minute Time | 500 or 1,500 Tick | Aligns intraday entries with hourly trends; uncovers "smart money" movements. |
| Swing Trading | Daily or Weekly Time | 4,500 Tick | Identifies precise entry points within long-term trends using high-interval tick charts. |
| Futures (ES) | 1,500 Tick | 500 Tick | Combines multiple tick timeframes to manage volatility without time-based delays. |
These setups provide a structured way to integrate both chart types into your trading strategy.
Implementation
To make the most of these charts, arrange them side-by-side in your trading workspace. Start by analyzing the broader trend on the time chart - look for key levels like support and resistance, moving averages, or chart patterns. Once you've established the overall direction, shift your focus to the tick chart. This is where you'll spot micro-trends and breakout signals that time charts might miss.
However, tick charts come with a practical challenge: they require significant computing power. Since they process every trade, they can be resource-intensive, especially during market opens or major news events. To avoid lag, consider using robust VPS systems. These provide the stable processing power and low-latency connections that consumer-grade hardware often struggles to deliver consistently.
For post-trade analysis, tick charts offer an unparalleled level of detail. They allow you to review every step of your trade, from where your stop loss was triggered to instances of slippage that might go unnoticed on time charts. This granular view is invaluable for refining your strategy, helping you understand why certain trades succeeded or failed.
Conclusion
Deciding between tick charts and time charts depends on your trading style and the market conditions you face. Tick charts excel in high-volume scenarios, capturing every single transaction. This makes them perfect for scalpers and day traders who need to spot micro-trends as they develop. On the other hand, time charts provide a steady, consistent view, making them a better fit for swing traders analyzing longer-term trends - especially during periods of lower market activity when tick data becomes less frequent.
A balanced approach often works best. Use time charts (such as 15-minute, hourly, or daily intervals) to identify market context and key levels, then switch to tick charts for more precise trade execution during active periods. As Carl from XABCD Trading points out, tick charts are particularly useful in volatile or low-liquidity markets, while time charts help filter out noise to focus on broader trends.
It’s important to note that tick charts require a reliable technical setup. Their real-time data processing can overwhelm consumer-grade hardware during periods of high volatility. To ensure smooth performance, consider using a dependable VPS system to handle the load. This technical aspect is essential for maintaining an effective charting strategy.
If you’re exploring platforms, options like NinjaTrader, TradeStation, and Sierra Chart offer native support for tick charts. TradingView also provides tick-based intervals (from 1T to 1000T), though it comes with limitations such as the lack of server-side alerts and advanced backtesting features. For those fine-tuning tick settings, Fibonacci-based intervals (like 144, 233, or 610) can align well with an instrument’s average volume and trading rhythm.
Ultimately, the choice of chart type should align with your trading strategy and technical capabilities. Let your strategy dictate the tools you use - not the other way around. Experiment with both chart types, track your performance, and refine your approach to find what works best for your specific market conditions.
FAQs
What tick setting should I use?
The ideal tick setting varies based on your trading style and the market's behavior. Many traders opt for settings between 500 and 2,000 ticks. If you're into short-term trades or scalping, 500 ticks is a common go-to. It offers enough detail while keeping market noise manageable. Ultimately, tweak your settings to align with your trading strategy and the activity level of the market you're monitoring.
Do tick charts work for stocks and crypto?
Tick charts are effective tools for both stocks and cryptocurrencies. Since they are based on trade activity rather than time, they excel in tracking rapid price movements often seen in these fast-moving markets. For traders who prioritize timing and understanding market dynamics, tick charts offer a useful way to gain deeper insights.
Can I use both chart types together?
Combining tick charts with time charts can bring depth to your trading strategy. Tick charts excel at capturing fine details of market activity, making them perfect for short-term trades like scalping. On the other hand, time charts give you a clearer picture of overall trends by displaying data over fixed time intervals. By using both, you can match the precise entry and exit points identified through tick charts with the broader trend analysis offered by time charts. This dual approach provides a well-rounded perspective on market conditions.


