
Risk of ruin is the probability that a run of losses takes your trading account down to a level where you can no longer trade, such as zero or a prop firm's loss limit. For trades with a fixed win probability p, a loss probability q = 1 − p and wins and losses of equal size, the classic formula is risk of ruin = (q / p)^N, where N is how many risk units your account holds. With p = 0.55 and 20 units, the formula gives about 1.8%.
Key points:
- What it measures: the chance of hitting your ruin line before your edge plays out, not the chance of losing one trade.
- What drives it: your win probability, your payoff per trade and how much you risk per trade.
- Where the formula comes from: the gambler's ruin problem in probability theory (Grinstead and Snell, Introduction to Probability, section 12.2).
- The big lever: risking less per trade raises N, and the result falls fast as N rises.
What Risk of Ruin Means in Trading
In trading, risk of ruin is the probability that losses push your account below the level you need to keep trading. Wikipedia notes that traders use the term "to refer to the risk of losses reducing a trading account below minimum requirements to make further trades" (Wikipedia: Risk of ruin).
Your ruin line is the level you set, and it does not have to be zero. It can be the margin your broker requires, the maximum loss on a funded account, or the most you are willing to lose before you stop and rethink.
Every trader loses trades, so a loss is not ruin. Risk of ruin asks a different question: given your win rate, payoff and size, how likely is a losing run long enough to end the game?
The Risk of Ruin Formula
The basic formula treats each trade like a bet that wins or loses one fixed unit. If your win probability p is higher than your loss probability q, the chance of eventual ruin is (q / p) raised to the power N. If p is equal to or lower than q, ruin is certain given enough trades.
Risk of ruin = (q / p)^N, when p > q
Risk of ruin = 1, when p ≤ q
- p: the probability that a trade wins.
- q: the probability that a trade loses, so q = 1 − p.
- N: your capital units: the distance to your ruin line divided by the dollar risk per trade. A $10,000 buffer and $500 risk per trade gives N = 20.
You will also see the formula written with an edge term. If your edge per trade is E = p − q, then (1 − E) / (1 + E) equals q / p, so ((1 − E) / (1 + E))^N gives the same answer.
Order flow
Built for scalpers. Heatmaps on dedicated resources.
Order-flow heatmaps and DOM ladders run on dedicated CPU, memory and NVMe, so your charts keep responding during volatility.
See the dedicated hardware





From $29.99/mo · Windows or Linux
Where the Formula Comes From
The formula is the gambler's ruin result from probability theory. Grinstead and Snell's Introduction to Probability (section 12.2, "Gambler's Ruin") works out the chance that a gambler with a stake of z units is ruined before reaching a target of M units, with win probability p on each one-unit bet.
Letting the target M grow without limit gives the case of an "infinitely rich adversary". The book shows that if q < p, the probability of eventual ruin "approaches (q/p)^z", and if q > p, it approaches 1. When p = q = 1/2, ruin also becomes certain as M grows.
The problem itself is old: Wikipedia traces it to a 1656 letter from Pascal to Fermat and to Christiaan Huygens's 1657 book on games of chance (Wikipedia: Gambler's ruin). For traders, z is simply N, your account measured in risk units.
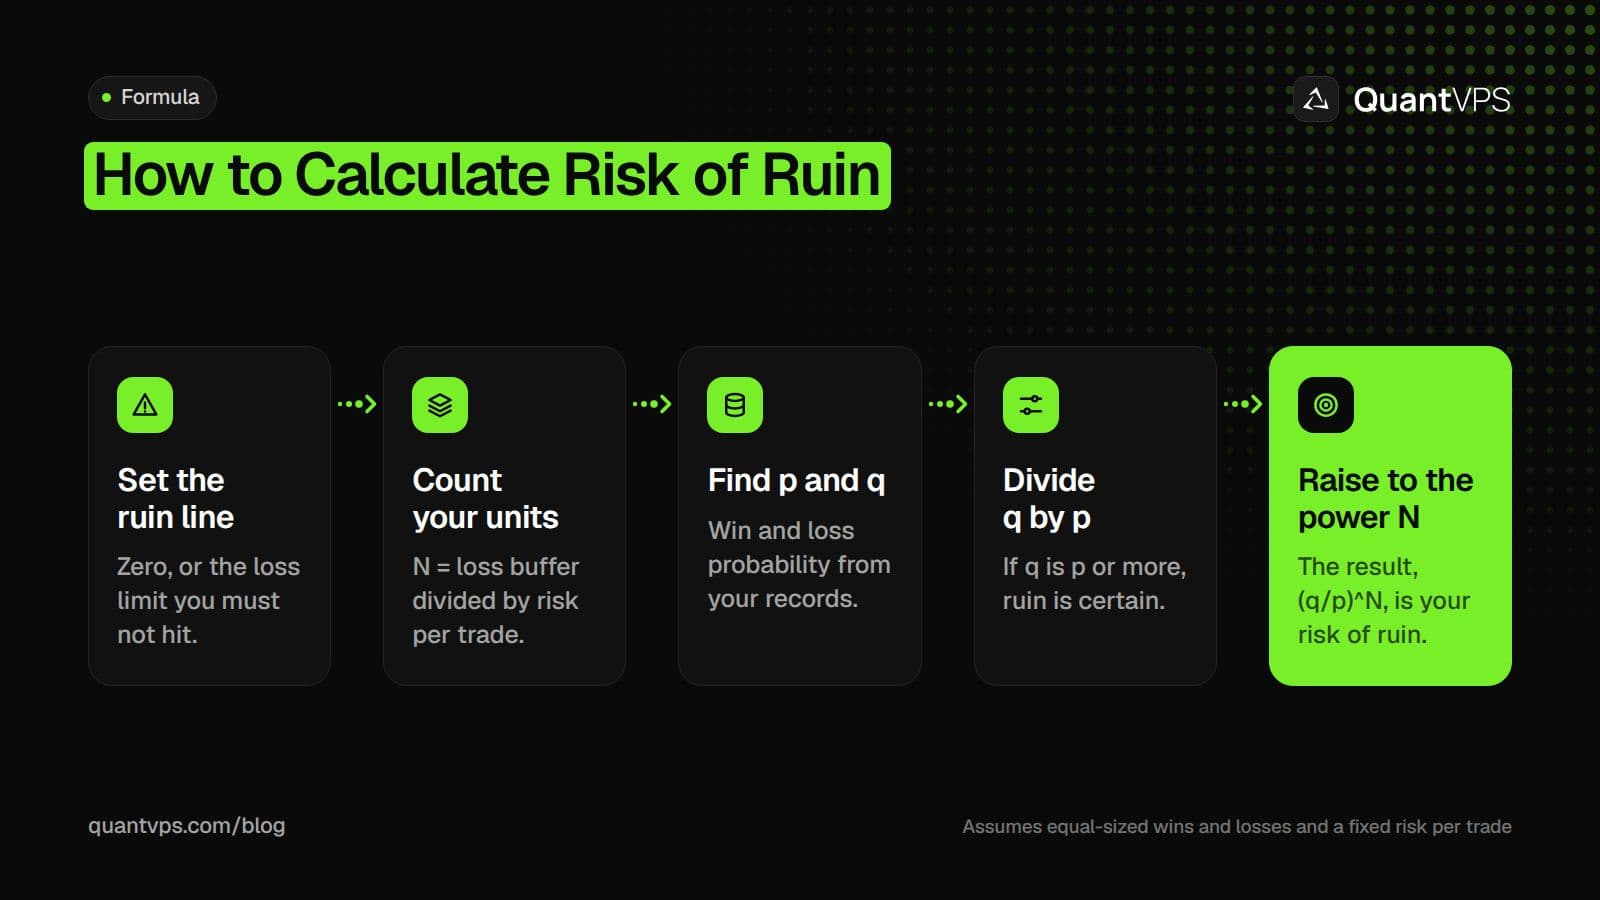
The basic risk of ruin formula in five steps. It assumes wins and losses of equal size and the same dollar risk on every trade.
The Assumptions Behind It
The formula is exact only when its assumptions hold, and real trading breaks most of them. Read the result as the output of a model, not as a forecast.
- Equal payoff: every win and every loss is the same size (1:1).
- Fixed dollar risk: you risk the same amount on every trade, not a percentage of the balance.
- Independent trades: one result does not change the odds of the next.
- A known, constant p: your true win probability never changes. In practice you only have an estimate from past trades.
- No end point: you keep trading until you are ruined, unless you add a profit target (see the prop firm example below).
Worked Example: One Win Rate, Three Position Sizes
Position size has a large effect on risk of ruin. The example below keeps the win probability fixed and changes only the risk per trade.
Assumptions: a $10,000 account, ruin means losing the whole $10,000, every trade wins or loses the same dollar amount, trades are independent, and the win probability is p = 0.55 (so q = 0.45). These numbers are chosen to show the arithmetic; they are not typical results.
- q / p = 0.45 / 0.55 = 0.8182.
- Risk $500 per trade: N = $10,000 / $500 = 20.
- Risk of ruin = 0.8182^20 = 0.0181, about 1.8%.
| Risk per trade | Capital units (N) | Risk of ruin at p = 0.55 | Risk of ruin at p = 0.52 |
|---|---|---|---|
| $1,000 (10% of the account) | 10 | 0.1344 (13.4%) | 0.4491 (44.9%) |
| $500 (5%) | 20 | 0.0181 (1.8%) | 0.2017 (20.2%) |
| $200 (2%) | 50 | 0.00004 (0.004%) | 0.0183 (1.8%) |
Two things stand out. Cutting risk per trade from $1,000 to $200 drops the result from 13.4% to 0.004% at p = 0.55. And a slightly lower win probability of 0.52 raises every row: at $500 a trade the figure goes from 1.8% to 20.2%.
At p = 0.50 the formula gives 1 for every row. With no edge and no end point, a long enough losing run eventually arrives whatever your size.
Risk of Ruin With a Prop Firm Drawdown
On a funded account or evaluation, your ruin line is the firm's maximum loss limit, not zero. Divide that limit by your risk per trade to get N, then apply the same formula.
Most evaluations also have a profit target, so the right question is "what is the chance of hitting the loss limit before the target?" Grinstead and Snell give that two-sided formula: with a stake of z units and a target of M units, the probability of ruin is ((q/p)^M − (q/p)^z) / ((q/p)^M − 1) when p ≠ q, and (M − z) / M when p = q = 1/2.
Assumptions: a $2,000 loss limit that stays fixed, a $3,000 profit target, equal-sized wins and losses, and independent trades. These are example numbers, not any firm's rules.
| Risk per trade | Units to the limit (z) | Units to the target (M − z) | Chance of hitting the limit first at p = 0.55 | At p = 0.50 |
|---|---|---|---|---|
| $200 | 10 | 15 | 0.129 (12.9%) | 0.60 (60%) |
| $100 | 20 | 30 | 0.018 (1.8%) | 0.60 (60%) |
The p = 0.50 column is the same for both sizes. With no edge, smaller trades only make the evaluation take longer; they do not change the odds. With an edge, smaller trades give it more trades to show up before the limit is reached.
A trailing limit makes this harder, because the floor rises with your peak balance and N shrinks after a winning run you give back. Our guide to the trailing drawdown shows how that floor moves, and our guide on how to pass a prop firm challenge covers sizing inside those rules.
Uptime
99.999% uptime. Built for 24/7 trading reliability.
Your VPS runs in Tier IV datacenters with redundant power and network, monitored 24/7 on site.
See the uptime SLAFrom $29.99/mo · Windows or Linux
When Wins and Losses Are Not Equal
The basic formula only covers wins and losses of the same size. If your average win is twice your average loss, or your losses vary, you need a different method.
The common answer is simulation. Investopedia notes that risk of ruin calculations "can be conducted using a value-at-risk (VaR) measure or through techniques like monte carlo simulation" (Investopedia). A simple Monte Carlo test works like this:
- Export your closed trades with their net profit or loss after costs.
- Pick a ruin line, such as a 30% drawdown or a funded account's loss limit.
- Draw trades at random from your list to build thousands of possible sequences.
- Count the share of sequences that touch the ruin line. That share is your simulated risk of ruin.
The result is only as good as your trade list. A short sample, or one from a single market regime, can make your edge look larger than it is. Read it next to your profit factor, which compares gross profit to gross loss on the same trades.
Percentage sizing also changes the model. If you risk a fixed share of the current balance, the account shrinks with each loss and never reaches exactly zero in theory, so define ruin as a drawdown level and simulate it.
How to Lower Your Risk of Ruin
You lower risk of ruin by risking less per trade, by having a real edge, and by keeping losses at the size you planned. Size is the one you control directly.
- Risk less per trade. Each step up in N cuts the result, as the table above shows.
- Check your win rate on enough trades. A win probability measured over a few dozen trades is a weak input.
- Keep losses at the planned size. Moving a stop or adding to a loser breaks the equal-loss assumption and raises the real risk.
- Set a stop line above your ruin line. A daily or weekly loss limit ends a bad run before it reaches the account limit.
- Keep automation online. If a bot or platform manages your exits, running it on a trading VPS keeps it working when your home PC or internet connection goes down.
FAQs
What is the formula for risk of ruin?
For trades with equal-sized wins and losses and a fixed dollar risk, risk of ruin = (q / p)^N when p > q, where p is the win probability, q = 1 − p and N is your account divided by your risk per trade. If p is equal to or lower than q, ruin is certain given enough trades.
What is a good risk of ruin?
There is no standard figure. It depends on how much of the account you can afford to lose and on how reliable your win rate is. Because the inputs are estimates, a cautious approach is to size so that the formula gives a result close to zero, which leaves room for the win rate to be wrong.
Is risk of ruin the same as maximum drawdown?
No. Maximum drawdown is the largest peak-to-trough fall that already happened in your results. Risk of ruin is a probability that a future losing run reaches a level you choose.
Can risk of ruin ever be zero?
Not under this model. With a win probability below 1 and a finite account, (q / p)^N is always above zero, though it can be very small when N is large.


