
A grid trading strategy places buy orders at set intervals below the current price and sell orders at set intervals above it, inside a price range you choose. Each time price dips to a level and then rises to the next one, the grid buys low and sells one level higher, so it earns from price swinging back and forth rather than from calling the direction. It works only while price stays in the range and swings enough to cover fees; a strong trend out of the range leaves you holding a falling asset or sitting in cash while price runs away.
Key points:
- Best conditions: a market moving sideways with regular swings inside your range.
- Main settings: lower price, upper price, number of grids, arithmetic or geometric spacing, and investment.
- Main risk: a trend. A fall below the range leaves you holding the asset at a loss; a rise above it leaves you in cash.
- Fees matter: every completed grid pays two trading fees, so too many grids can leave little or nothing per trade.
What Is Grid Trading?
Grid trading is a rules-based strategy that turns a price range into a ladder of resting orders. Binance describes it this way: "orders are placed above and below a set price, creating a grid of orders at incrementally increasing and decreasing prices" (Binance Spot Grid FAQ).
The strategy makes no forecast about direction. It assumes price will keep moving back and forth inside the range, and it collects the gap between levels each time a buy and the sell above it both fill. Bybit's grid FAQ says grid strategies "are suitable for volatile and sideways markets" (Bybit grid FAQ).
How a Grid Trading Strategy Works
A grid buys at each level below the price and sells at each level above it. When a buy fills, a sell is placed one level higher; when that sell fills, a buy goes back one level lower.
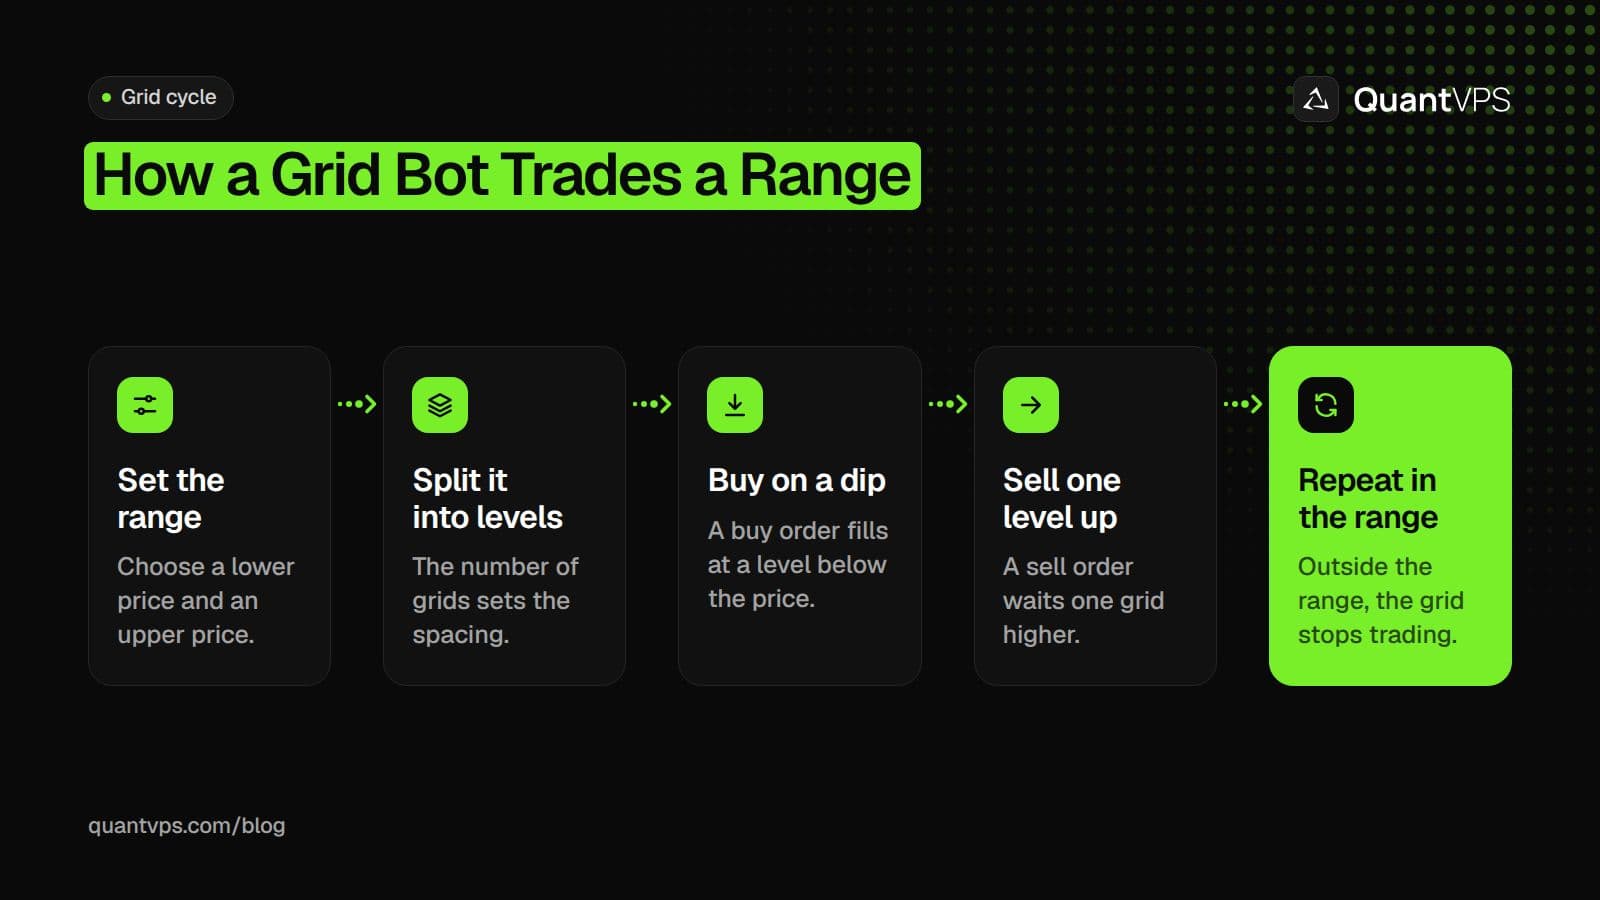
A grid bot earns from price moving back and forth between levels. Once price leaves the range, it stops placing new orders.
Assumptions for this example: a range of 90 to 110, 10 grids with arithmetic spacing, 1 unit per order, price at 100 when the grid starts, and fees left out until the next section. The numbers are an illustration, not a real market.
- Levels: (110 − 90) / 10 = 2, so the levels are 90, 92, 94 and so on up to 110.
- Start: buy orders rest at 98, 96, 94, 92 and 90. To have something to sell, the grid also buys 5 units at about 100 for sell orders at 102, 104, 106, 108 and 110. Binance and Bybit both describe buying the base asset at market when a grid starts (Bybit).
- A swing: price dips to 98, the buy fills, and a sell is placed at 100. Price rises back to 100, the sell fills, and the grid has made 2 per unit on that pair before fees.
Order flow
Built for scalpers. Heatmaps on dedicated resources.
Order-flow heatmaps and DOM ladders run on dedicated CPU, memory and NVMe, so your charts keep responding during volatility.
See the dedicated hardware





From $29.99/mo · Windows or Linux
Grid Trading Settings Explained
Every grid comes down to a few settings: where the range sits, how many levels it has, how they are spaced and how much money backs them. Each one is a trade-off.
| Setting | What it does | Trade-off |
|---|---|---|
| Lower price | Bottom of the range; no buys below it | Set it too high and a normal dip takes price out of the range |
| Upper price | Top of the range; no sells above it | Set it too low and a rally leaves you in cash early |
| Number of grids | How many levels the range is split into | More grids: more trades, less per trade, more fees |
| Spacing mode | Arithmetic (equal price gap) or geometric (equal percentage gap) | See the comparison below |
| Investment | Total funds behind the orders | Must cover holding every buy level if price falls through the range |
| Trigger or entry price | Starts the grid only when price reaches a set level | May never start if price does not get there |
| Stop loss and take profit | Ends the grid at a price below or above the range | A stop locks in a loss; no stop leaves you holding |
Arithmetic vs Geometric Grids
In an arithmetic grid every level is the same price distance apart; in a geometric grid every level is the same percentage apart. Binance's FAQ puts it this way: "In Arithmetic mode, each grid has an equal price difference. In Geometric mode, each grid has an equal price difference ratio."
Binance's parameters page gives the profit per grid for each mode, net of a trading fee c, and uses c = 0.1% in its example (Binance grid parameters). Applied to the 90 to 110 range with 10 grids and the same 0.1% fee:
| Arithmetic | Geometric | |
|---|---|---|
| Spacing | 2.00 between levels | Ratio of (110 / 90)^(1/10), about 1.0203 |
| Profit per grid after fees | From about 1.65% (top level) to 2.02% (bottom level) | About 1.82% at every level |
| Why | The same 2.00 gap is a bigger percentage of a lower price | Every gap is the same percentage |
| Fits | Narrow ranges, where the percentage gap barely changes from level to level | Wide ranges, where an equal price gap would be very uneven in percentage terms |
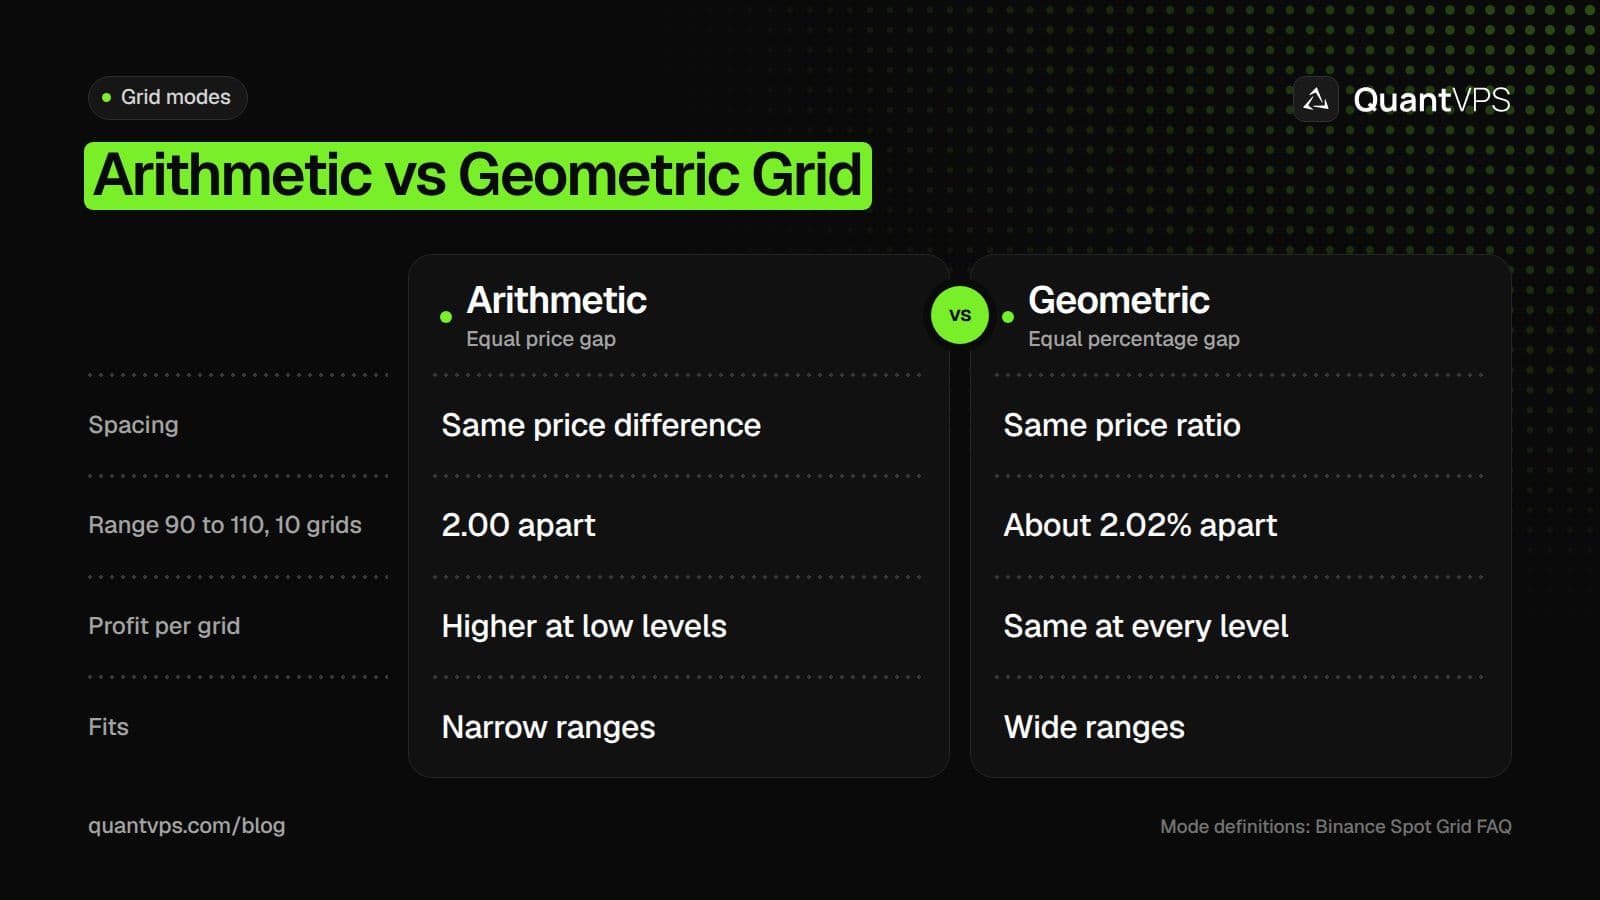
Arithmetic grids space levels by price; geometric grids space them by percentage.
Those are percentages per completed buy and sell pair, not returns on the whole investment. How many pairs complete depends entirely on how price moves.
Grid Bots on Binance, Bybit and KuCoin
All three exchanges offer a spot grid bot with a lower price, an upper price and a number of grids. The details below come from each exchange's own help pages, checked on 31 Oct 2026; features not listed may still exist, but they were not stated in the pages checked.
| Feature (checked on 31 Oct 2026) | Binance Spot Grid | Bybit Spot Grid Bot | KuCoin Spot Grid |
|---|---|---|---|
| Setting the parameters | AI, Popular or Manual tabs | AI Strategy or Manual tab | AI parameters, your own settings, or copy another user's |
| Spacing modes | Arithmetic or Geometric | Not stated in the pages checked | Not stated in the page checked |
| When price leaves the range | No orders executed above the upper or below the lower price | Strategy suspended; resumes if price returns to the range | Stops buying below the lower limit and selling above the upper limit |
| Start at a set price | Trigger price | Not stated in the pages checked | Entry price |
| Exit settings | Stop loss and take profit; "Sell All Base Coins on Stop" on by default | Trailing Up, with a Trailing Stop recommended alongside it | Take profit and stop loss |
| Fees | Profit per grid formula deducts trading fees | Only spot trading fees when orders fill | Not stated in the page checked |
The Bybit Trailing Up details come from its Trailing Up guide. The KuCoin details come from its Spot Grid help article. Bybit also states that you can run up to 50 Spot Grid Bots at once and that spot grid bots carry no liquidation risk because they trade the spot market.
Grid Trading Risks
The biggest risk in grid trading is a trend. A grid is built for a range, and when price leaves that range the strategy either holds a losing position or stops earning.
Price Falls Through the Lower Price
In a fall, the grid keeps buying at every level on the way down. Binance warns that "Trading Bots will consistently execute all orders as soon as the specified intervals are reached. Execution may even apply in situations of a rapid collapse or strong rise of a digital asset."
In the example above, a straight fall to 85 fills all five buys at 98, 96, 94, 92 and 90. The grid now holds 10 units that cost 970 in total (5 at 100 and 5 averaging 94), worth 850 at 85: a loss of 120 before fees, with no completed pairs to offset it. Below 90 the grid places no new orders.
This is why the grid's own profit figure can mislead. Bybit explains that "it's possible to have a positive Grid Profit while simultaneously experiencing a negative Total P&L," because unrealized losses on the tokens the bot holds can be larger than the realized grid profits.
Uptime
99.999% uptime. Built for 24/7 trading reliability.
Your VPS runs in Tier IV datacenters with redundant power and network, monitored 24/7 on site.
See the uptime SLAFrom $29.99/mo · Windows or Linux
Price Rises Through the Upper Price
In a rally, the grid sells its holdings level by level and ends up all in cash. In the example, a rise to 115 sells the 5 units at 102 to 110 for 530, a gain of 30 on their cost of 500 before fees. Holding those 5 units instead would have left them worth 575, and the 470 set aside for the buy orders earned nothing.
Bybit warns that its Trailing Up feature, which shifts the range up after price, "may result in high-price buys during market reversals."
Other Risks
- Fees and too many grids. Each completed pair pays a buy fee and a sell fee. KuCoin notes that lower intervals mean more trades with less profit or loss on each one.
- Leverage. A futures grid uses leverage, so a move against it can be liquidated. A spot grid cannot be liquidated, but it can still lose most of its value if the asset does.
- Yield displays. Bot screens can show annualized yields based on a short run. Binance's parameters page scales a run of just under 11 days up to a full year; a short window says little about the next one.
How to Set Up a Grid Trading Strategy
Set up a grid by choosing the market first, then the range, then the number of grids, and only then the amount.
- Pick a ranging market. Look for a pair that has moved sideways between clear highs and lows, not one in a strong trend.
- Set the range from the chart. Put the lower and upper prices near support and resistance that price has respected.
- Choose the grid count from fees. Use your exchange's profit per grid figure and make sure each grid clears the round-trip fee by a clear margin.
- Plan the exits. Decide in advance whether you will stop the grid if price closes below the range, and set a stop loss if the exchange offers one.
- Size for the worst case. Only commit an amount you could hold with every buy level filled and price below the range.
- Test first. Backtest the range and grid count on past data, or start small.
Grid trading is one of many automated approaches. Our guide to trading bot strategies sets grid trading next to trend following, mean reversion, DCA and other bot setups, with rules for each.
Running Your Own Grid Bot
An exchange's built-in grid bot runs on the exchange, so it keeps working when your computer is off. A grid you script yourself through an exchange API has to run somewhere that stays online, because crypto markets never close.
A crypto VPS runs your bot and its API connections around the clock. QuantVPS offers crypto VPS plans in Tokyo for Binance and Bybit, London for Kraken and New York for Coinbase. For bots on other markets, the same setup on a trading VPS keeps your scripts and platforms running when your home PC or connection drops.
FAQs
Is grid trading profitable?
It can be, but there is no guarantee. A grid earns from swings inside its range and loses when price trends out of it, so the result depends on the market's path, your settings and fees. Judge it on total profit and loss, not grid profit.
Does grid trading work in a trending market?
Not well. In a downtrend the grid keeps buying and ends up holding the asset at a loss; in an uptrend it sells out early and sits in cash. Grids are built for sideways markets.
How many grids should I use?
There is no single best number. More grids mean smaller gaps, more trades and more fees per unit of profit, while fewer grids mean bigger gaps and fewer trades. Pick a count where the profit per grid clearly exceeds the round-trip fee.


