
The ICT Unicorn Model Strategy simplifies trading by focusing on high-probability setups where Fair Value Gaps (FVG) align with Breaker Blocks (BB). This overlap, called the "Unicorn Zone", signals areas influenced by institutional orders. The strategy works across forex pairs like GBP/USD, EUR/USD, and futures such as NQ, ES, and Gold (XAU/USD).
Key Highlights:
- Bullish Setup: Look for liquidity sweeps followed by a sharp reversal in the Discount Zone (lower 50% of the price range).
- Bearish Setup: Focus on liquidity sweeps with a reversal in the Premium Zone (upper 50% of the price range).
- Entry & Exit: Enter trades when price retraces into the Unicorn Zone. Use precise stop-loss levels (10–20 pips beyond FVG/BB) and aim for a 1:2 risk-to-reward ratio.
- Timing Matters: High-volume periods like the London Open (2:00–5:00 AM EST) and New York Open (7:00–10:00 AM EST) yield better results.
- Win Rates: Traders report 50–70% success rates with strict filters.
To refine your approach, backtest the strategy using platforms like NinjaTrader or TradeStation via QuantVPS, ensuring reliable data and performance. This method prioritizes precision, discipline, and structured execution for consistent results.
Bullish and Bearish Unicorn Setups
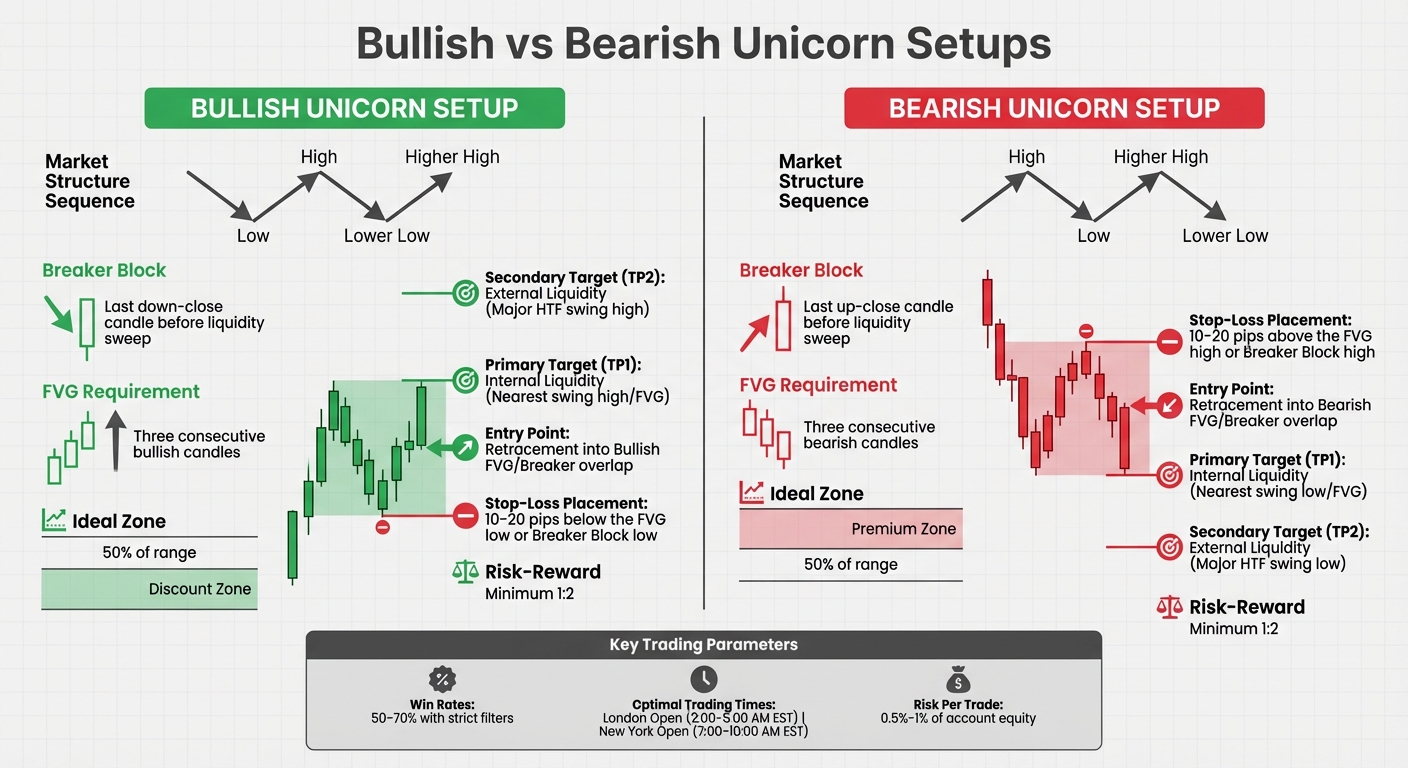
Bullish vs Bearish ICT Unicorn Trading Setups Comparison
The Unicorn Model highlights two different trading setups based on market direction. These setups uncover where institutional traders have trapped retail participants, offering you a chance to align your trades with the so-called "smart money." Both setups rely on a combination of liquidity sweeps, breaker blocks, and fair value gaps (FVGs), which are core elements of the ICT Unicorn strategy.
How to Identify Bullish Unicorn Setups
A bullish Unicorn setup starts with a downward liquidity sweep, followed by a sharp reversal. The price sequence looks like this: a Low (L), then a High (H), followed by a Lower Low (LL) that takes out stops below the initial low, and finally a Higher High (HH) that signals a shift in market structure.
The key area to watch is the Unicorn Zone, which forms when a bullish FVG appears. This happens when three consecutive bullish candles create a gap between the high of the first candle and the low of the third candle. This gap must also sit within the range of a bullish Breaker Block, which is the last down-close candle before the liquidity sweep.
These setups are most effective in the Discount Zone - the lower 50% of the current price range - and during high-volume trading periods like the London Open (2:00 AM–5:00 AM EST) or the New York Open (7:00 AM–10:00 AM EST). For best results, the FVG should be formed by large-bodied candles moving quickly. In volatile markets like Gold (XAU/USD), these setups can capture price moves of 50–100 pips during peak hours.
"A price return to a bullish breaker block is a bullish trade setup worth considering."
- Michael Huddleston, Founder of ICT
To confirm a bullish setup, look for the RSI to exit oversold conditions (below 30) or overbought conditions (above 70), along with MACD crossovers. Only enter the trade when the price retraces into the overlap zone of the FVG and breaker block. Once you've mastered bullish setups, the next step is to understand bearish conditions.
How to Identify Bearish Unicorn Setups
A bearish Unicorn setup is essentially the reverse of the bullish pattern. The sequence begins with a High (H), followed by a Low (L), then a Higher High (HH) that sweeps liquidity above the initial high, and finally a Lower Low (LL) that confirms a market structure shift.
The Unicorn Zone for bearish setups forms when a bearish FVG is created. This occurs when three consecutive bearish candles leave a gap between the low of the first candle and the high of the third candle. This gap must overlap with a bearish Breaker Block, which is the last up-close candle before the liquidity sweep. These setups work best in the Premium Zone, or the upper 50% of the price range.
| Feature | Bullish Unicorn Setup | Bearish Unicorn Setup |
|---|---|---|
| Market Structure | Low → High → Lower Low → Higher High | High → Low → Higher High → Lower Low |
| Breaker Block | Last down-close candle before liquidity sweep | Last up-close candle before liquidity sweep |
| FVG Requirement | Three consecutive bullish candles | Three consecutive bearish candles |
| Ideal Zone | Discount Zone (lower 50% of range) | Premium Zone (upper 50% of range) |
| Stop-Loss Placement | 10–20 pips below the FVG low | 10–20 pips above the FVG high |
Only enter a bearish trade when the price retraces into the overlap zone of the FVG and breaker block. By following all the filters - like time of day, premium/discount zones, and multi-timeframe alignment - traders have reported win rates of 50% to 70%. It's crucial to trade only when every element of the setup aligns. Up next, we'll explore how to execute these setups with precision.
NEVER MISS A TRADE
Your algos run 24/7
even while you sleep.
99.999% uptime • Chicago, New York, London & more data centers • From $59.99/mo
How to Execute Trades with the ICT Unicorn Model
Once you've spotted a valid Unicorn setup, the next step is executing the trade with precision. Success often depends on how you enter the trade, where you place your stop-loss, and when you decide to exit. Let’s break down the steps to turn these setups into actionable trades.
Using Multiple Timeframes to Confirm Trades
Unicorn trades work best when the bias from higher timeframe (HTF) charts aligns with the entry on lower timeframe (LTF) charts. Start with a top-down approach: use a higher timeframe like the 1-hour or 4-hour chart to determine market bias, then switch to a lower timeframe like the 5-minute chart to pinpoint your entry.
Before entering a trade, confirm the price is in the right zone using Fibonacci retracement levels. For bearish trades, look for prices above the 50% retracement level. For bullish trades, focus on prices below the 50% level. This ensures you're not buying at a peak or selling at a low.
"A 5-minute Unicorn setup is much stronger if the 15-minute or 1-hour chart confirms the same direction."
- Abe Cofnas, Author
Make sure your LTF entry aligns with the HTF bias. Instead of chasing initial price moves, wait for the price to retrace into the Unicorn Zone. Aim to execute trades during high-volume periods like the London and New York Opens, when market activity is at its peak.
| Trading Style | Higher Timeframe (Bias/Context) | Lower Timeframe (Execution/Entry) |
|---|---|---|
| Swing Trading | Weekly | Daily or 4-Hour |
| Intraday Trading | Daily | 15-Minute or 30-Minute |
| Classic Day Trading | 1-Hour | 5-Minute |
| Scalping | 1-Hour or 15-Minute | 1-Minute |
Once your trade bias is confirmed, it’s time to focus on the details: entry points, stop-loss levels, and profit targets.
Setting Entry Points, Stop-Loss, and Profit Targets
After confirming your setup, the next step is executing the trade with precision. Use the Unicorn Zone identified through multi-timeframe analysis to guide your decisions.
- Entry Points: Enter when the price retraces into the Unicorn Zone. Avoid entering right at the Market Structure Shift (MSS). For a more cautious approach, consider entering at the boundary of the Fair Value Gap (FVG) or its 50% midpoint.
- Stop-Loss Placement: Your stop-loss is your safety net. For bullish setups, place your stop 10–20 pips below the FVG's low or the Breaker Block low, whichever is lower. For bearish setups, position it 10–20 pips above the FVG's high or the Breaker Block high, whichever is higher. This buffer helps protect against minor market fluctuations.
-
Profit Targets: Use a two-tier strategy:
- Primary Target (TP1): The nearest draw on liquidity, such as a previous session high/low, equal highs/lows, or a higher timeframe price delivery array.
- Secondary Target (TP2): External liquidity at major HTF swing points. Always aim for at least a 1:2 risk-to-reward ratio. For example, if you're risking $100, your first target should yield at least $200 in profit.
| Feature | Bullish Unicorn Setup | Bearish Unicorn Setup |
|---|---|---|
| HTF Context | Price in Discount Zone (<50% range) | Price in Premium Zone (>50% range) |
| Entry Point | Retracement into Bullish FVG/Breaker overlap | Retracement into Bearish FVG/Breaker overlap |
| Stop-Loss | 10–20 pips below FVG low or Breaker low | 10–20 pips above FVG high or Breaker high |
| Primary Target (TP1) | Internal Liquidity (Nearest swing high/FVG) | Internal Liquidity (Nearest swing low/FVG) |
| Secondary Target (TP2) | External Liquidity (Major HTF swing high) | External Liquidity (Major HTF swing low) |
| Risk-Reward | Minimum 1:2 | Minimum 1:2 |
If the price moves beyond the defined boundaries before your entry, cancel the trade. Stick to sound risk management principles by risking only 0.5% to 1% of your account equity per trade.
Backtesting the ICT Unicorn Model Strategy on QuantVPS
Backtesting is a critical step in refining how you execute the Unicorn Model, ensuring it's dependable before you dive into live trading. It’s about validating the strategy against your trading style and the markets you prefer, without risking real money. Using a VPS guarantees uninterrupted uptime, so your tests run smoothly without hiccups.
For the ICT Unicorn Model, focus your backtesting efforts on spotting overlaps between a Fair Value Gap (FVG) and a Breaker Block within specific contexts like Kill Zones and Premium/Discount zones. Ideally, aim to gather 50–100 qualifying setups across different markets to ensure your sample size is statistically solid. If you’re working with higher-timeframe strategies, you might need 6–12 months of historical data when backtesting on QuantVPS.
Once you’ve got the basics down, it’s time to configure your backtests for success.
How to Set Up ICT Unicorn Backtests
STOP LOSING TO LATENCY
Execute faster than
your competition.
Sub-millisecond execution • Direct exchange connectivity • From $59.99/mo
Pick a trading platform that offers advanced charting and backtesting capabilities. Platforms like NinjaTrader and TradeStation integrate seamlessly with QuantVPS, letting you replay historical data while manually or automatically identifying Unicorn setups.
Start by establishing the trend bias on higher timeframes, such as the 4-hour or Daily charts. Then, refine your entries on lower timeframes like the 5-minute or 15-minute charts. Tools like Flux Charts and FibAlgo come with built-in backtesting dashboards, tracking performance metrics directly within your platform. These tools use "Overlap Algorithms" to pinpoint intersections between Breaker Blocks and FVGs, reducing the chance of manual mistakes.
For the best results, focus your backtests on high-volatility periods, particularly during the London Kill Zone (2:00 AM–5:00 AM EST) and the New York Kill Zone (7:00 AM–10:00 AM EST). Keep detailed records of every backtest entry, including the session, premium/discount zone, and timeframe. This helps you identify patterns, like specific market phases (e.g., consolidation periods) where the model may not perform as well. Many traders in the ICT community report win rates between 50% and 70% when applying all filters correctly.
Choosing the Right QuantVPS Plan for Backtesting
Once your backtesting framework is in place, it’s time to choose a QuantVPS plan that matches your processing needs. Handling multi-timeframe data and running automated indicators requires enough CPU and RAM to manage "Overlap Algorithms" that scan for institutional displacement candles.
| Plan | Cores | RAM | Storage | Best For |
|---|---|---|---|---|
| VPS Pro | 6 | 16GB | 150GB NVMe | Standard backtesting and multi-monitor setups (up to 2). |
| VPS Pro+ | 6 | 16GB | 150GB NVMe | Heavy optimization and simultaneous strategy tests. |
For most traders using NinjaTrader or TradeStation with automated Unicorn indicators, VPS Pro at $99.99/month (or $69.99/month billed annually) is sufficient to backtest 3–5 charts at once. If you’re running parameter sweeps or testing multiple strategy variations simultaneously, go for VPS Pro+ at $129.99/month (or $90.99/month billed annually) for extra processing power.
Another key advantage: QuantVPS servers are strategically located near major broker data centers. This reduces latency, allowing your backtesting algorithms to process market signals more efficiently. The result? Your historical replay aligns much more closely with real-world trading conditions.
Conclusion
The ICT Unicorn Model Strategy offers a targeted framework for pinpointing high-probability trade entries where a Fair Value Gap aligns perfectly with a Breaker Block. Instead of chasing the market, this approach emphasizes patience - waiting for the price to revisit the Unicorn Zone after a liquidity sweep and executing trades with clearly defined risk parameters.
Start by determining market bias on higher timeframes like the Daily or 4-hour charts, then refine your entries on lower timeframes such as the 5-minute or 15-minute charts. Focus your trading during peak institutional activity times: the London Kill Zone (2:00–5:00 AM EST) and the New York Kill Zone (7:00–10:00 AM EST). Stick to bullish setups in Discount zones and bearish setups in Premium zones for better consistency.
To build confidence in this strategy, backtest 30–50 historical trades. Many traders report win rates between 50–70% when applying strict filters. Manage your risk carefully - allocate just 1–2% of your total capital per trade, and set stop-losses 10–20 pips beyond the boundaries of the FVG candle or Breaker Block.
For seamless execution and backtesting, a reliable trading infrastructure is essential. QuantVPS provides the tools needed to support this strategy without disruptions. The VPS Pro plan, priced at $69.99/month (billed annually), is designed for multi-timeframe analysis and automated indicators. For more advanced needs, the VPS Pro+ plan at $90.99/month (billed annually) supports parameter sweeps and simultaneous strategy testing. With low-latency connections to broker data centers, you can ensure your backtesting results closely match live trading conditions. This dependable setup creates a solid foundation for systematic trading.
FAQs
How do I confirm a real Unicorn Zone versus a random overlap?
To identify a genuine Unicorn Zone, look for an exact overlap between two key elements: a Breaker Block (a structural shift following a failed order block) and a Fair Value Gap (FVG) (an imbalance caused by swift price movement). This precise alignment highlights high-probability entry points, often influenced by institutional activity. The overlap must be precise - any approximation won’t qualify the zone as a true Unicorn.
What’s the best way to set targets when liquidity is unclear?
When liquidity conditions seem uncertain, it's essential to concentrate on key support and resistance zones revealed through price action. According to the ICT Unicorn Model Strategy, areas where fair value gaps (FVGs) and breaker blocks intersect tend to serve as reliable, high-probability levels. To navigate these effectively, set dynamic targets, carefully observe how prices react at these zones, and adapt your approach to reflect real-time market behavior. This method helps minimize risks associated with unclear liquidity.
How many backtests do I need before trading this live?
When deciding how many backtests to run before trading a strategy live, there’s no hard-and-fast rule. That said, extensive testing is highly encouraged. Some traders, for instance, have conducted backtests on 100 or more trades to gauge how well their strategy performs. Running a large number of tests not only boosts confidence in the strategy but also ensures it aligns with your trading objectives before you take it live.


