
To backtest on TradingView, add a strategy to your chart from the Indicators menu, and the Strategy Report (the Strategy Tester) opens below the chart with its results on the bars loaded. Set commission, slippage and order size in the strategy's Properties tab first, then read profit factor, max drawdown and the list of trades. Backtesting works on every plan; Deep Backtesting and high bar detail need Premium or Ultimate (TradingView, checked on 10 Oct 2026).
Key points:
- Where: Indicators menu (or the / key), then a strategy from Technicals, Community or your own scripts.
- Costs are off by default: commission is none and slippage is 0 ticks until you set them.
- Data: intraday backtests use the bars loaded on the chart, from 5K on Basic to 40K on Ultimate.
- Deep Backtesting: Premium and Ultimate, on up to 2 million bars and 1 million trades.
- Repainting: a strategy can look better on history than it trades live. Check for it before you trust a result.
What the TradingView Strategy Tester Is
The Strategy Tester runs a Pine Script strategy over historical bars and reports how it would have traded. TradingView's newer help pages call it the Strategy Report: "Indicators display data and signals on the chart, while strategies automatically generate a result report." Only one strategy can run on a chart at a time.
Inside it, a "broker emulator" fills the strategy's orders. On historical bars it only knows open, high, low and close, so it assumes how price moved inside each bar, as TradingView's Pine Script strategies guide explains. That assumption is the source of most gaps between backtests and live results.
How to Add a Strategy to the Chart
You add a strategy the same way as an indicator. These steps follow TradingView's Strategy Report guide, checked on 10 Oct 2026:
- Open Supercharts and load the symbol and timeframe you want to test.
- Click Indicators in the top toolbar, or press the / key.
- Search for a strategy, or open Technicals → Strategies for built-in ones or Community for shared ones. Your own Pine strategies and favourites are listed too.
- The Strategy Report opens at the bottom of the screen with the results.
- Click the gear icon to open Settings, then the Properties tab, before you read any numbers.
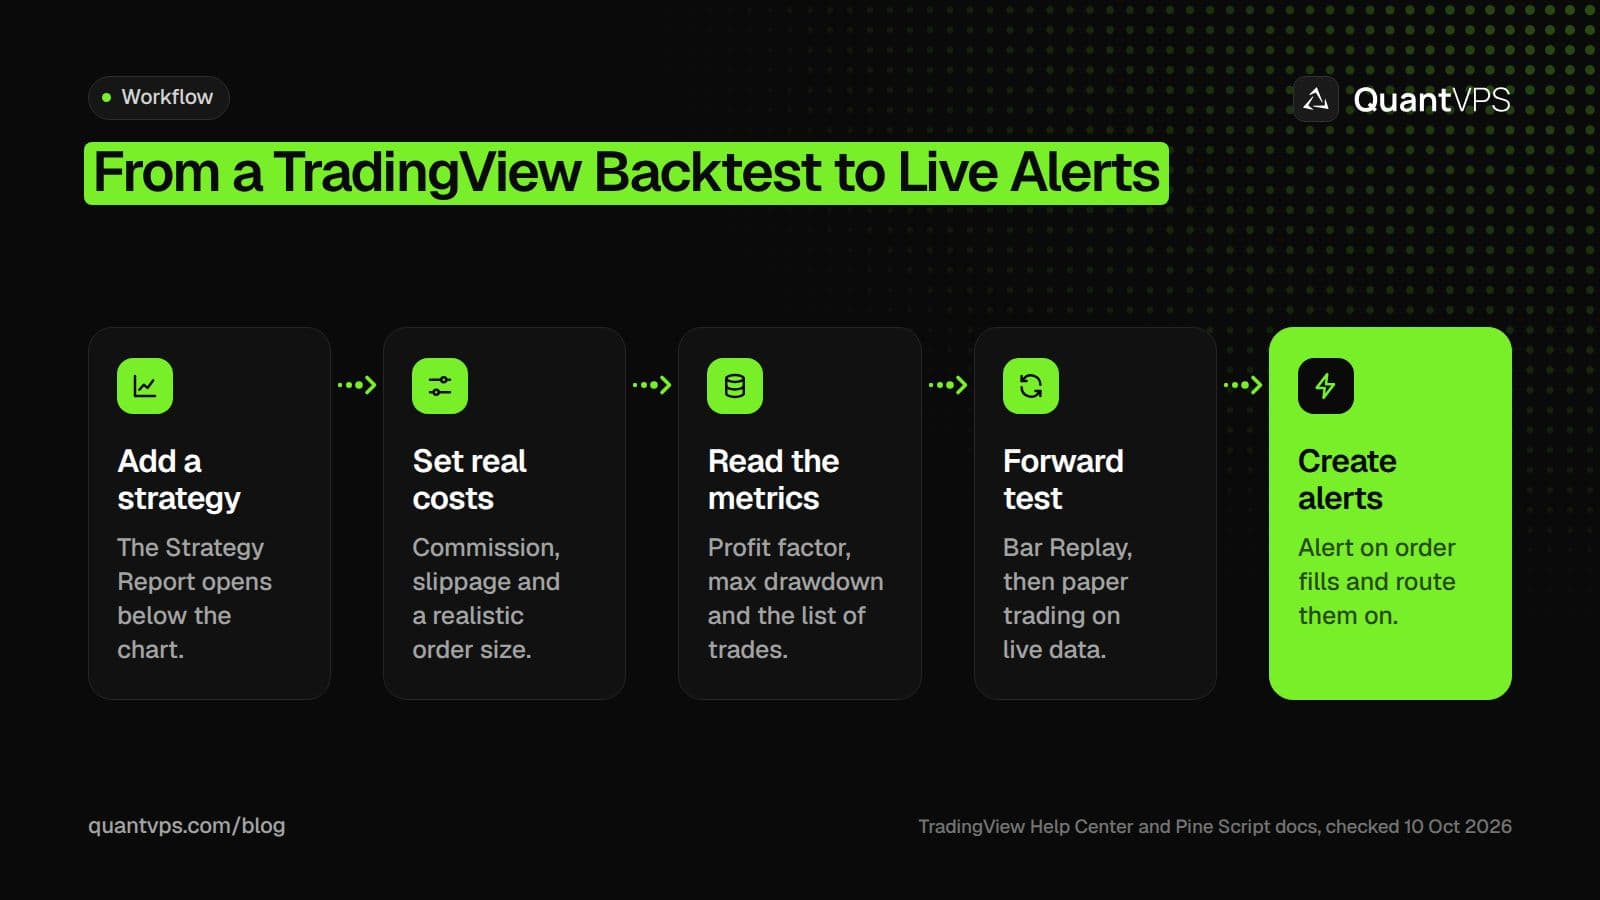
A backtest is the first step, not the last: add costs, check the trades, then forward test.
Strategy Properties: Capital, Size, Pyramiding and Costs
The Properties tab decides how the emulator sizes and charges every trade, so set it to match how you would really trade. Each setting also has a matching argument in the strategy() declaration. Defaults are from TradingView's strategy properties page and Pine Script v6 docs, checked on 10 Oct 2026:
| Setting | What it does | Default | Pine argument |
|---|---|---|---|
| Initial capital | Starting balance for the test | 1,000,000 in the symbol's currency | initial_capital |
| Order size | Fixed quantity, a cash amount, or % of equity per entry | Set by the script | default_qty_type, default_qty_value |
| Pyramiding | Maximum entries in the same direction from strategy.entry() |
1 | pyramiding |
| Commission | % of value, cash per contract, or cash per order; charged on entries and exits | None | commission_type, commission_value |
| Slippage | Ticks added to market and stop order fills | 0 | slippage |
| Margin long / short | Share of each position you must fund | Set by the script | margin_long, margin_short |
| Limit order execution | Fill limits at the requested price, or only 1 tick beyond it | Requested price | backtest_fill_limits_assumption |
Initial capital matters more than it looks. TradingView's initial capital page notes that the default of 1,000,000 sets buying power and percentage returns, so a test with a percent-of-equity order size on that default can show sizes you could never trade. For futures, use a cash per contract commission and add a small fixed slippage, which TradingView's docs say helps results "align more closely with reality."
Order flow
Built for scalpers. Heatmaps on dedicated resources.
Order-flow heatmaps and DOM ladders run on dedicated CPU, memory and NVMe, so your charts keep responding during volatility.
See the dedicated hardware





From $29.99/mo · Windows or Linux
The Metrics That Matter
Start with four numbers on the Metrics tab: Total P&L, max drawdown, profitable trades and profit factor. TradingView defines them as follows:
- Profit factor: gross profit divided by gross loss, from closed trades only. Above 1.0 means the strategy made money (profit factor page). Our guide on profit factor shows how to work it out and judge it.
- Max drawdown: "the largest peak-to-trough decline." TradingView measures it intrabar, bar by bar while a position is open (max drawdown page).
- Run-up: the largest unrealized profit inside each trade, shown next to its drawdown.
- Profitable trades: the share of closed trades that made money. A low figure can still work if winners are much larger than losers.
Then open the other tabs. Performance analysis compares the strategy with buy-and-hold and shows margin usage; Trades analysis shows the spread of results, streaks and the hours or days that worked best. Sharpe and Sortino ratios are also in the report.
Reading the List of Trades
The List of trades tab shows every simulated trade with its number, type, date and time, signal, price, position size, net P&L, run-up, drawdown and cumulative P&L. Read it before you trust the summary. Look for:
- A few outliers doing all the work. If two trades make most of the profit, the edge is fragile.
- Entries and exits on the same bar. These depend on the emulator's guess about price inside the bar.
- Sizes that grow with equity. Percent-of-equity sizing compounds, which can hide a weak start.
On Essential and higher plans you can export the trades as CSV and the report as XLSX, per TradingView's pricing page.
Bar Magnifier and Deep Backtesting by Plan
Two settings make backtests more realistic, and both need Premium or Ultimate. Bar Magnifier, now shown as Bar detalization set to "High", fills orders using prices from a lower timeframe inside each bar. Deep Backtesting runs the strategy on all available history for a date range you pick, "and not only on those loaded on the chart," as TradingView's Deep Backtesting page puts it.
| Feature | Basic | Essential | Plus | Premium | Ultimate |
|---|---|---|---|---|---|
| Strategy backtesting, basic metrics | Yes | Yes | Yes | Yes | Yes |
| Advanced metrics, CSV and XLSX export | No | Yes | Yes | Yes | Yes |
| Intraday bars on the chart | 5K | 10K | 10K | 20K | 40K |
| Bar detalization "High" (Bar Magnifier) | No | No | No | Yes | Yes |
| "On history bar tick" execution | No | No | No | Yes | Yes |
| Deep Backtesting | No | No | No | Yes | Yes |
Plan limits from TradingView's pricing page and Pine Script docs, checked on 10 Oct 2026. A few rules to know:
- Bar Magnifier can request up to 200,000 lower-timeframe bars, so the earliest trades on a long chart may not use it.
- Deep Backtesting caps each run at 2 million bars and 1 million trades, shows results only in the report, not on the chart, and can differ from the regular test (how Deep Backtesting works).
- Intraday history in Deep Backtesting is shorter than daily history, per TradingView's data length page.
Bar Replay for Manual Testing
Bar Replay plays the chart forward from a past date, bar by bar, so you can test rules by eye and even trade in replay. You open it with the Replay button on the chart's top panel, pick a starting point and press Play, as TradingView's demo features guide describes.
Every plan includes Bar Replay, but intraday depth differs: Basic replays daily and higher bars only, Essential reaches back 180 days of minute bars and Plus 365 days, while Premium and Ultimate replay all minute and second history, plus 7 days of ticks on Ultimate (pricing page, checked on 10 Oct 2026). Bar Replay does not work with tick-based intervals.
Uptime
99.999% uptime. Built for 24/7 trading reliability.
Your VPS runs in Tier IV datacenters with redundant power and network, monitored 24/7 on site.
See the uptime SLAFrom $29.99/mo · Windows or Linux
Repainting and Lookahead Traps
Repainting is when a script behaves differently on history than in real time, which makes a backtest look better than live trading. TradingView's repainting help page says it is "not a bug" but the result of historical bars holding only OHLC data. The common traps:
-
Future leak:
request.security()withlookahead = barmerge.lookahead_onand no[1]offset returns future prices on historical bars. - Higher-timeframe values: an unconfirmed daily value on an intraday chart changes during the day in real time but not on history.
-
Every-tick strategies: strategies with
calc_on_every_tick = truerepaint, because tick data is lost when the chart reloads. - Same-tick fills: setting Order execution delay to "None" lets orders fill on the closing tick that created them, which TradingView warns "would not be possible to accomplish in real trading."
TradingView's Pine repainting guide gives two fixes. Confirm signals on the bar close with barstate.isconfirmed, and request higher-timeframe data with a one-bar offset:
xUp = ta.crossover(close, ma) and barstate.isconfirmed
request.security(symbol, timeframe, expression[1], lookahead = barmerge.lookahead_on)
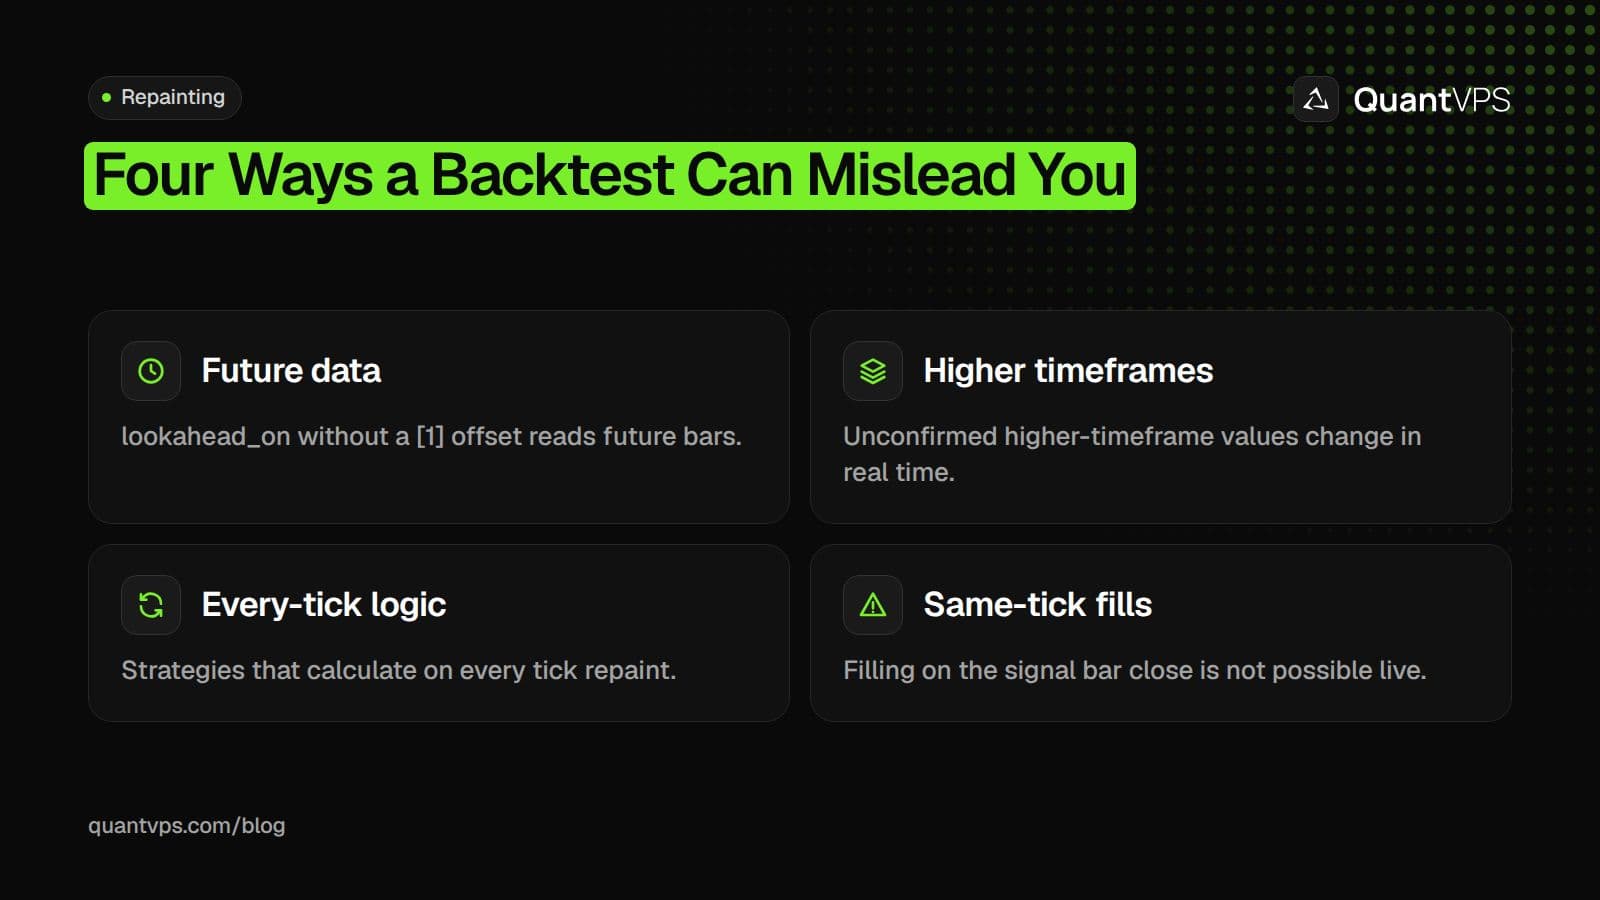
Repainting and lookahead make a backtest look better than live trading will be.
Forward Testing With Paper Trading
After the backtest, forward test the same rules on live data before you risk money. TradingView Paper Trading is free on every plan and connects like a broker from the Trade button. Run it long enough to cover a range of market conditions, then compare the paper fills, costs and drawdown with the backtest.
Pine strategies do not place paper or live orders by themselves: TradingView says strategy trading "is limited to the backtesting mode only." Paper trades are placed by hand, or by an outside tool that acts on alerts.
From Backtest to Alerts
To act on a strategy in real time, create an alert on it. A strategy alert can trigger on order fill events, on alert() calls in the code, or both, and the {{strategy.order.action}} and {{strategy.order.contracts}} placeholders pass the order details into the alert message. A webhook can send that message to a bridge, a desktop platform add-on or your own receiver; see TradingView automated trading for the full setup.
Alerts run on TradingView's servers, so they fire whether or not your computer is on. The part that receives them is different: if it is a bot or a desktop platform, it must stay online, which is what a TradingView VPS is for.
FAQs
Is backtesting on TradingView free?
Yes. Strategy backtesting with basic metrics is included on every plan, including the free Basic plan. Advanced metrics and trade export start with Essential, and Deep Backtesting and high bar detail need Premium or Ultimate (pricing page, checked on 10 Oct 2026).
Why are my Deep Backtesting results different from the regular backtest?
Deep Backtesting uses all available history for the date range you choose, while the regular test uses only the bars loaded on the chart. Deep Backtesting also starts its calculations at the beginning of that range, so values such as an EMA, and the trades built on them, can differ from the chart.
Does a TradingView backtest include commissions and slippage?
Not by default. A strategy applies no commission and 0 ticks of slippage unless its code or its Properties tab sets them. Add both before you read the results.
How much history does a TradingView backtest use?
On intraday charts, the bars loaded on the chart: 5,000 on Basic, 10,000 on Essential and Plus, 20,000 on Premium and 40,000 on Ultimate, per TradingView's intraday data page. Daily and higher charts load all available data. Deep Backtesting goes further on Premium and Ultimate.
Can I backtest an indicator on TradingView?
Not directly. Only strategies generate a Strategy Report. To test an indicator's signals, use a strategy built on the same logic, from the built-in or community strategies or one written in Pine Script.


