
A rejection block is the wick area of a candle, or a small group of candles, that swept liquidity above a high or below a low and then closed back inside the range. In ICT (Inner Circle Trader) terms, a bearish rejection block runs from the highest candle body up to the wick high, and a bullish one runs from the lowest body down to the wick low. Traders mark it as a zone where price may be rejected again if it returns.
Key points:
- It is built from wicks, not bodies. An order block uses the body or range of the last opposite candle; a rejection block uses the wick that poked beyond a high or low.
- It needs a sweep. The wick should take out an obvious high or low, where stop orders tend to rest.
- The body level is the line traders watch. Many enter when price returns to the body edge and place the stop just beyond the wick.
- It is a definition, not a proven edge. ICT teaches the idea in videos; there is no published success rate.
What Is a Rejection Block?
A rejection block is a zone at a swing high or low formed by long wicks after price ran through a level and failed to hold beyond it. The wick shows that price traded there, but buyers or sellers pushed it back before the candle closed.
The term comes from Michael J. Huddleston's Inner Circle Trader teaching, where it sits next to order blocks, breaker blocks and fair value gaps. ICT does not publish a written rulebook, so traders draw rejection blocks in slightly different ways. The version below is the one most commonly taught.
Bearish rejection block
A bearish rejection block forms at a swing high. Price runs above an earlier high, taking the buy stops resting there, then closes back below it and leaves one or more long upper wicks. The zone runs from the highest candle body (the higher of the open or close) up to the highest wick.
Bullish rejection block
A bullish rejection block is the mirror image at a swing low. Price runs below an earlier low, taking the sell stops there, then closes back above it with long lower wicks. The zone runs from the lowest candle body down to the lowest wick.
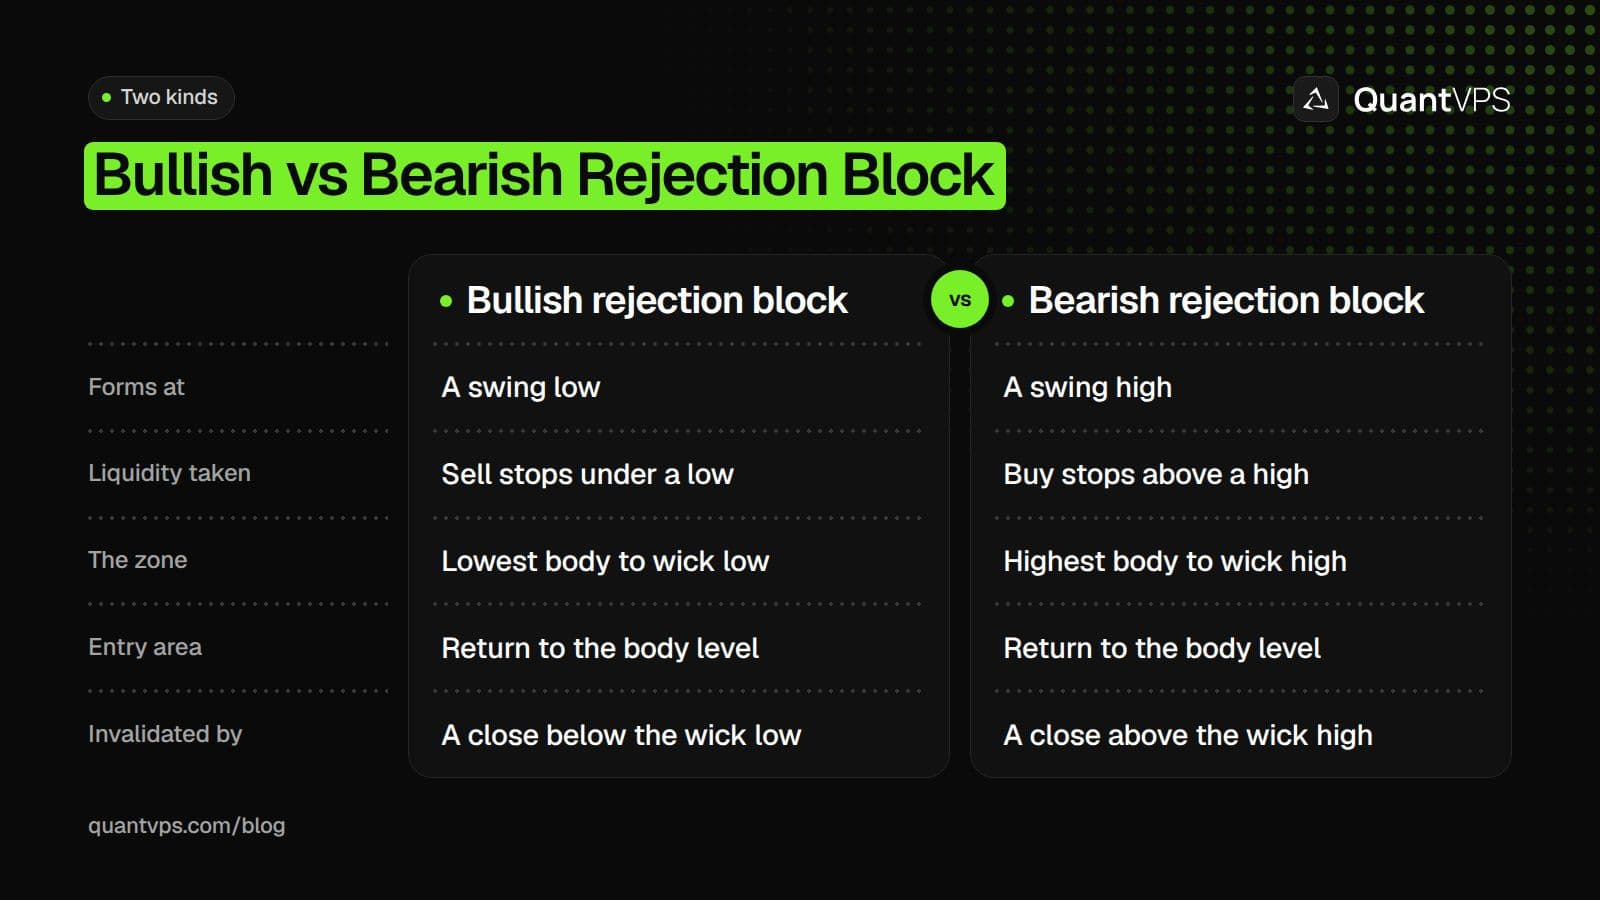
A rejection block is the wick zone left behind when price sweeps a high or low and snaps back.
Uptime
99.999% uptime. Built for 24/7 trading reliability.
Your VPS runs in Tier IV datacenters with redundant power and network, monitored 24/7 on site.
See the uptime SLA





From $29.99/mo · Windows or Linux
Why Traders Watch the Wick Zone
Traders watch the wick zone because it marks prices the market tried and refused. ICT traders read the sweep as stop orders being filled into larger opposite orders, and the close back inside as a sign the move beyond the level had no follow-through.
The sweep itself is the first half of the setup. Our guide to liquidity sweeps in trading explains how these runs on stops form and how they differ from real breakouts.
When price later comes back to the zone, traders expect the same opposite orders to show up again near the body level. If price instead closes beyond the wick, the idea is wrong and the zone is no longer valid.
Rejection Block vs Order Block vs Breaker Block
The three blocks differ in which part of the chart they use and when they form. An order block is the last opposite candle before a strong move, a breaker block is an order block that failed and flipped, and a rejection block is the wick zone at a swept high or low.
| Order block | Breaker block | Rejection block | |
|---|---|---|---|
| What it is | Last opposite candle before a strong move | A failed order block that price broke through | Wick zone at a swing high or low |
| Part of the candle used | Body or full range | Body or full range of the failed block | Wick, from the body edge to the wick tip |
| Needs a sweep? | Not always | Usually, before the break | Yes, the wick takes a high or low |
| Role on a retest | Same direction as the move it started | Opposite to its original role | Same direction as the rejection |
| Typical stop | Beyond the far side of the block | Beyond the far side of the breaker | Beyond the wick tip |
For a full walk through the first type, see our guide to order blocks in trading. The flipped version, and how to tell the two apart, is covered in breaker blocks vs order blocks.
A rejection block can sit inside a larger setup. In the ICT unicorn model, traders combine a breaker with a fair value gap, and a rejection block at the swept high or low can mark where the move began.
How to Mark a Rejection Block
To mark a rejection block, find a swing high or low where price swept an earlier level and closed back inside, then draw a box from the candle bodies to the wick tips. Use the same steps every time so your zones stay consistent.
- Find the swept level. Look for an obvious high or low: a prior day high or low, a session high or low, or two or more equal highs or lows.
- Check the candles. At the sweep, you want long wicks beyond the level and bodies that close back inside it.
- Pick the body edge. For a bearish block, take the highest open or close among the candles at the high. For a bullish block, take the lowest open or close at the low.
- Draw to the wick tip. Extend the box to the highest wick (bearish) or lowest wick (bullish).
- Mark the middle. Many traders also mark the 50% level of the wick, often called the mean threshold, as a second reference.
- Wait for a shift. Before trading a return to the zone, look for a break of structure away from it, such as a lower low after a bearish block.
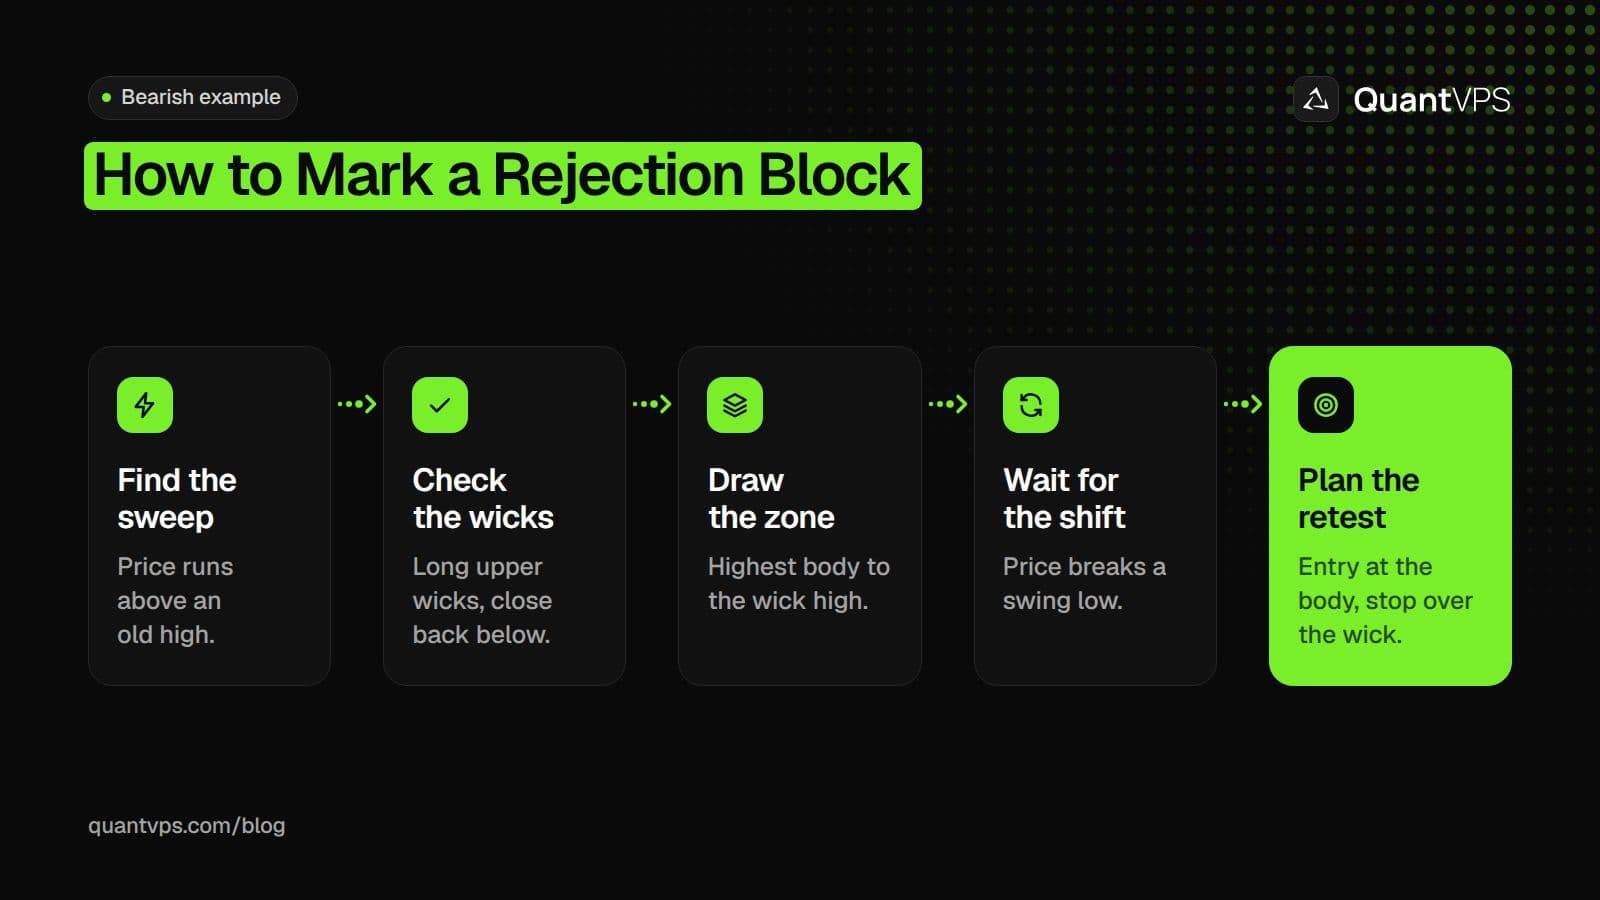
For a bullish rejection block, flip every step: a sweep under a low, lower wicks, and a stop under the wick low.
Higher timeframes give fewer, larger zones; lower timeframes give more, tighter ones. A common approach is to mark the block on a 15-minute or 1-hour chart and time the entry on a 1-minute to 5-minute chart.
Example: Bearish Rejection Block on ES
This is an illustrative example with made-up round prices, not a real chart or a trade signal. E-mini S&P 500 futures (ES) are $50 per index point, with a 0.25-point tick worth $12.50 (CME Group ES contract specs, checked on 31 Oct 2026).
- The sweep: the prior day high is 7,860.00. At 9:50 ET, a 5-minute ES candle trades up to 7,868.50, then closes at 7,857.00 after opening at 7,861.00.
- The zone: the highest body edge is the open at 7,861.00, and the wick high is 7,868.50. The bearish rejection block runs from 7,861.00 to 7,868.50, with the 50% level at 7,864.75.
- The shift: by 10:20 ET, price breaks the last swing low at 7,848.00.
- The entry: at 10:45 ET, price rallies back to 7,861.00, the body edge, and you sell there.
- The stop: 7,868.75, one tick above the wick high. Risk is 7.75 points, or $387.50 per ES contract.
- The target: 7,840.00, the next obvious low below. That is 21 points, or $1,050 per ES contract, a little over 2.5 to 1 against the risk.
If price had pushed through 7,868.50 and closed above it, the block would have failed. That is the stop's job: it sits where the idea is proven wrong.
Some traders also check a correlated market before taking the short. If NQ made a lower high while ES swept its high, that SMT divergence would be read as extra confirmation that buying was not broad.
Order flow
Built for scalpers. Heatmaps on dedicated resources.
Order-flow heatmaps and DOM ladders run on dedicated CPU, memory and NVMe, so your charts keep responding during volatility.
See the dedicated hardwareFrom $29.99/mo · Windows or Linux
Common Rejection Block Mistakes
Most rejection block mistakes come from marking wicks that did not sweep anything, or from entering before the market shows it has turned. These are the ones to watch for.
- Marking every wick. A long wick in the middle of a range took no liquidity. Only wicks through a clear high or low count.
- Using the wrong body edge. With several candles at the high, use the highest body for a bearish block, or the zone will be too small.
- Entering without a shift. Price often sweeps a level twice. Waiting for a break of structure filters some of those second runs.
- Stops inside the wick. A stop below the wick tip (bearish) sits inside the zone, so a normal retest can hit it.
- Ignoring the higher timeframe. A bearish block against a strong daily uptrend is a counter-trend trade and deserves smaller size.
- Holding a broken zone. Once price closes beyond the wick, the block is invalid. Do not redraw it to fit.
Limits of Rejection Blocks
A rejection block is a way to mark a zone, not a forecast. There is no published win rate for it, and two traders can draw different boxes on the same candles.
- Hindsight bias. Swept highs look obvious on a finished chart. Live, you do not know a sweep is over until price turns.
- News moves through zones. Around major data releases, price can run through a wick zone without pausing.
- Timeframe changes the picture. One long wick on a 1-hour chart can be a clean breakout on a 1-minute chart.
Test your rules on past charts and in a simulator before you risk money, and size each trade so a failed block is a small loss.
If you run alerts that fire when price returns to a marked zone, or an automated strategy that trades it, a trading VPS keeps the platform running while your own computer is off.
FAQs
What is a rejection block in ICT?
In ICT trading, a rejection block is the wick zone at a swing high or low that swept liquidity and closed back inside the range. A bearish block runs from the highest body to the wick high; a bullish block runs from the lowest body to the wick low.
Is a rejection block the same as an order block?
No. An order block is the body or range of the last opposite candle before a strong move. A rejection block is built from the wicks at a swept high or low.
Where do traders put the stop on a rejection block?
Most put it just beyond the wick tip: above the wick high for a bearish block, or below the wick low for a bullish one. A close beyond the wick means the block has failed.
What is the mean threshold of a rejection block?
Traders use mean threshold for the 50% level of the wick zone, halfway between the body edge and the wick tip. Some use it as an entry level or as a line price should not close beyond.


