
The cup and handle is a bullish continuation chart pattern: a rounded, U-shaped base (the cup) followed by a short, shallow pullback on its right side (the handle). William O'Neil introduced it in his 1988 book How to Make Money in Stocks. You trade it by buying a break above the top of the handle on rising volume, with a stop below the handle and a target equal to the cup's depth added to the breakout point.
Key points:
- Also called: cup with handle, or simply a cup chart.
- Where it forms: after an uptrend, as a pause before the trend continues.
- The rules of thumb: a U-shaped cup that retraces 1/3 or less of the prior advance, and a handle that retraces up to 1/3 of the cup's advance.
- The trade: enter on a break above the handle, stop below the handle low, target the cup depth projected up.
What Is a Cup and Handle Pattern?
A cup and handle is a consolidation inside an uptrend that looks like a teacup from the side. StockCharts' ChartSchool describes it as "a bullish continuation pattern that marks a consolidation period followed by a breakout" and says it "was developed by William O'Neil and introduced in his 1988 book How to Make Money in Stocks" (StockCharts ChartSchool).
The cup forms when price pulls back from a high and then curves back up to that level. The handle is a smaller pullback near the top of the right side. A break above the handle's range signals that the earlier advance is resuming.
O'Neil described the pattern for stocks, and the StockCharts and Fidelity guides use stock examples. The same shape is drawn on futures, forex and crypto charts, but the guidelines below come from the stock market version.
The Parts of a Cup and Handle
A valid cup and handle has five parts: a prior trend, a rounded cup, a limited cup depth, a short handle and a breakout on rising volume. StockCharts gives these guidelines for each one, checked on 31 Oct 2026:
Order flow
Built for scalpers. Heatmaps on dedicated resources.
Order-flow heatmaps and DOM ladders run on dedicated CPU, memory and NVMe, so your charts keep responding during volatility.
See the dedicated hardware





From $29.99/mo · Windows or Linux
| Part | What to look for (StockCharts) |
|---|---|
| Prior trend | An advance before the cup, ideally "a few months old". The more mature the trend, the less upside potential. |
| Cup shape | U-shaped, like a bowl or rounding bottom. A V-shaped bottom is too sharp a reversal to qualify. Equal highs on both sides are ideal but not required. |
| Cup depth | Ideally 1/3 or less of the previous advance; 1/3 to 1/2 in volatile markets; at most 2/3 in extreme cases. |
| Handle | A pullback after the right-side high, sometimes like a small flag or pennant. It "can retrace up to 1/3 of the cup's advance, but usually not more." |
| Duration | Cup: one to six months, sometimes longer on weekly charts. Handle: one week to many weeks, ideally one to four weeks. |
| Volume | A "substantial increase in volume on the breakout above the handle's resistance." |
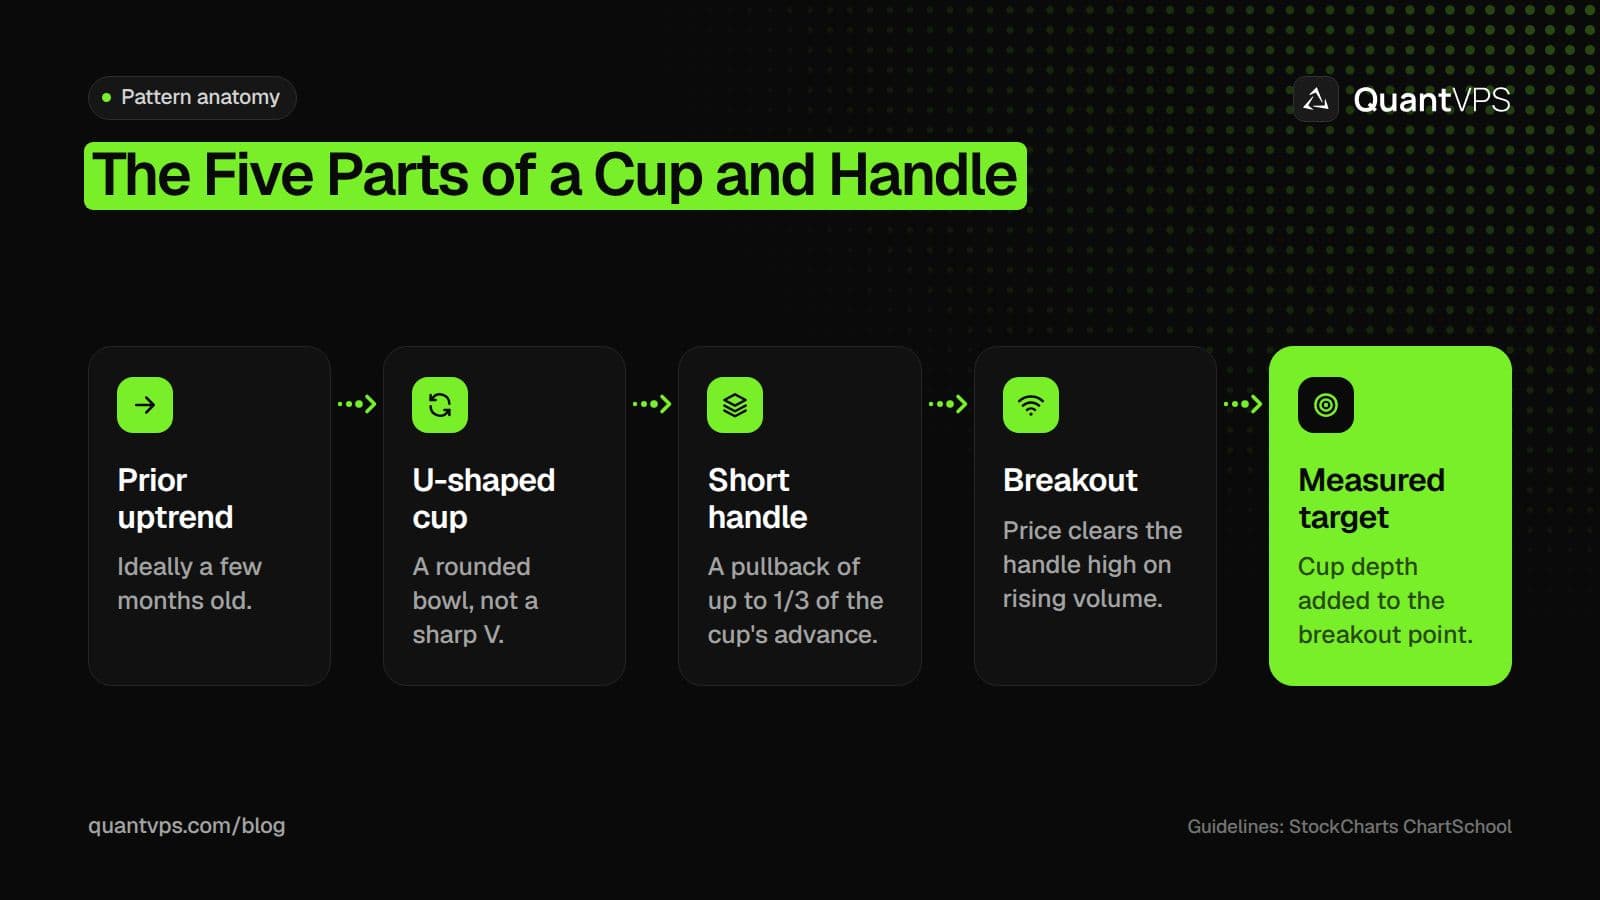
A cup and handle forms after an uptrend: a rounded cup, a short handle, then a breakout above the handle on rising volume.
Sources differ on the handle. StockCharts and Fidelity both put the limit at about 1/3 of the cup's advance, while Wikipedia says the handle "should retrace about 30% to 50% of the rise at the end of the cup" (Wikipedia). StockCharts adds that "the smaller the retracement, the more bullish the formation."
Treat these as guidelines. StockCharts notes that "capturing the pattern's essence is more important than the particulars": a bowl-shaped consolidation, a short pullback, then a breakout with expanding volume.
How to Trade the Cup and Handle
Trade the cup and handle by waiting for price to break above the handle, then placing a stop below the handle and a target based on the cup's depth. Fidelity describes the buy point as the moment the stock "breaks out or moves upward through the old point of resistance (right side of the cup)," and says the breakout "should occur with increased volume."
- Confirm the setup. Check for a prior uptrend, a rounded cup of acceptable depth and a handle in the upper part of the cup.
- Mark the breakout level. Draw a line across the top of the handle. StockCharts adds that it is sometimes prudent to wait for a break above the resistance set by the cup's highs.
- Wait for the break. Enter when a bar closes above that level, ideally on volume clearly above recent bars.
- Place the stop. Put it below the handle's low. If price falls back through the handle, the pattern has failed.
- Set the target. Measure from the right peak of the cup to the bottom of the cup and add that distance to the breakout point. Fidelity says the target "should be used only as a guideline."
- Size from the stop. Work out your position size from the distance between entry and stop, so a failed breakout costs only what you planned.
Worked Example: Entry, Stop and Target
This example uses round, made-up prices to show the arithmetic. It is not a real chart and not a forecast.
| Step | Price | How it is worked out |
|---|---|---|
| Prior advance | 30 to 60 | A 30-point uptrend before the cup |
| Cup low | 50 | Retraces 10 of the 30 points, which is 1/3 |
| Right rim | 60 | Price curves back up to the old high |
| Handle low | 57 | Gives back 3 of the cup's 10-point advance, under 1/3 |
| Entry | 60.20 | First close above the handle high of 60 |
| Stop | 56.80 | Just under the handle low |
| Target | 70 | Breakout at 60 plus the cup depth of 10 (60 minus 50) |
Risk is 60.20 minus 56.80, or 3.40 per share; the distance to the target is 9.80, a little under 3 to 1. If your plan risks $340 on a trade, that is 100 shares. If price closes back below 57, the setup has failed and the stop takes you out.
A Real Chart Example From StockCharts
StockCharts walks through a cup and handle on EMC from 1999 and 2000, and it shows how a real pattern bends the guidelines. All details below are from the ChartSchool page.
- Trend: EMC advanced from around $10 to above $30 in about five months, then pulled back.
- Cup: the cup's low retraced 42% of the prior advance, deeper than the ideal 1/3 but inside the 1/3 to 1/2 range for volatile markets. The stock peaked at $32.69 to complete the cup.
- Handle: a sharp decline in August took the handle past 1/3 of the cup's advance, but price recovered to the normal handle boundaries within a week.
- Duration: about three months for the cup and about six weeks for the handle.
- Breakout: in early September 2000 the stock broke handle resistance with a gap up and volume expansion.
- Target: the projected advance was about nine points from a breakout of around $32.
Uptime
99.999% uptime. Built for 24/7 trading reliability.
Your VPS runs in Tier IV datacenters with redundant power and network, monitored 24/7 on site.
See the uptime SLAFrom $29.99/mo · Windows or Linux
Cup and Handle vs Other Bullish Patterns
The cup and handle is one of several patterns that mark a pause in an uptrend. It takes longer to form than a flag and has a rounded base instead of straight trendlines.
| Pattern | Shape | Typical length | Entry signal |
|---|---|---|---|
| Cup and handle | Rounded U, then a short pullback | Cup one to six months; handle one to four weeks (StockCharts) | Break above the handle |
| Bull flag | Sharp pole, then a small channel sloping down | Short, as a pause after a fast move | Break above the flag |
| Ascending triangle | Flat top with rising lows | Varies with the chart's timeframe | Break above the flat top |
| Inverted cup and handle | Upside-down U, then a short drift up | Mirror of the cup and handle | Break below the handle (bearish) |
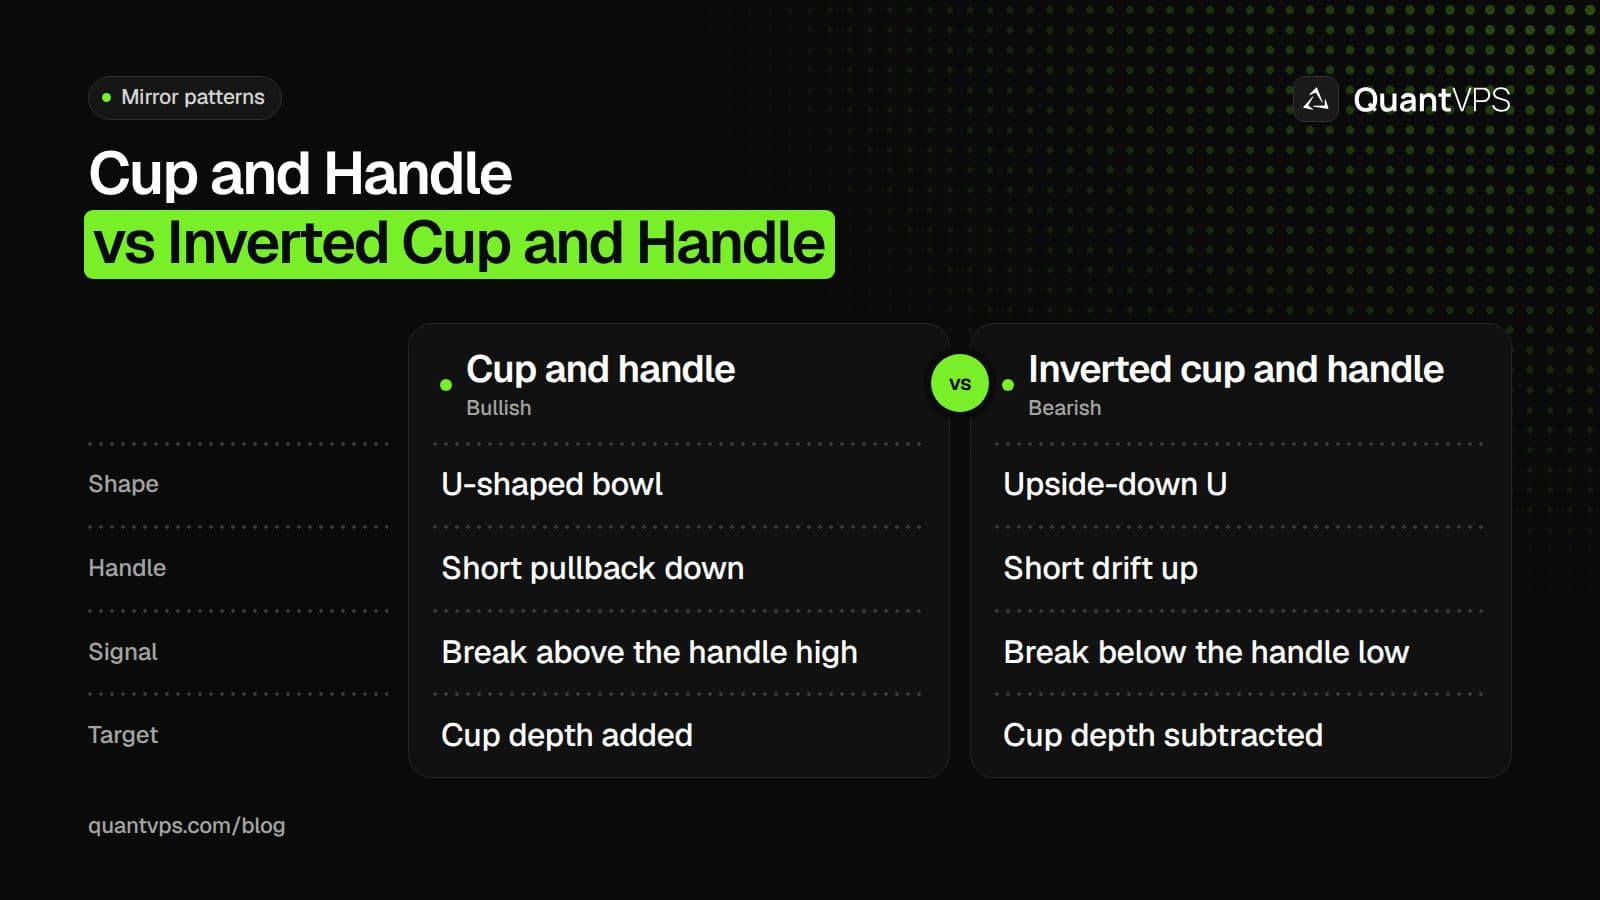
The inverted cup and handle is the bearish mirror image of the cup and handle.
Our guide to bullish continuation patterns covers bull flags, pennants, ascending triangles and the cup and handle side by side. Triangles and wedges have their own guide to triangle, wedge and flag patterns, with breakout rules for each.
Common Cup and Handle Mistakes
The common mistakes are trading a pattern that does not meet the guidelines and entering before the breakout. Check for these before you trade one:
- A V-shaped cup. A fast drop and fast recovery is a sharp reversal, not the rounded base the pattern needs.
- A deep handle. A handle that falls well past 1/3 of the cup's advance is weaker, according to StockCharts and Fidelity.
- An old trend. StockCharts says that the more mature the prior trend, the less upside potential the pattern has.
- A breakout on light volume. Without a clear rise in volume, the break has less support.
- Buying the handle early. Entering inside the handle, before price clears it, means taking a trade the pattern has not triggered.
- Treating the target as certain. The measured move is a guide. Plan exits for a failed or partial move too.
Breakouts can come at any time in the session. A price alert at the handle high lets the chart tell you when the setup triggers, and running your platform and alerts on a trading VPS keeps them on when your own computer is off.
FAQs
Is a cup and handle bullish or bearish?
A cup and handle is bullish. StockCharts classifies it as a bullish continuation pattern that signals the prior advance is resuming. The inverted cup and handle is the bearish version.
What is a cup chart?
A cup chart is a price chart showing a cup and handle pattern: a U-shaped base followed by a short pullback, with a breakout above the pullback's high.
How long does a cup and handle take to form?
StockCharts puts the cup at one to six months, sometimes longer on weekly charts, and the handle at one week to many weeks, ideally one to four weeks.
How do you calculate the cup and handle target?
Measure from the right peak of the cup down to its lowest point, then add that distance to the breakout level. A cup from 60 down to 50 with a breakout at 60 gives a target of 70. Treat it as a guide, not a promise.


