
Supply and demand zones are price areas where a sharp move began, drawn as a box rather than a single line. A supply zone sits above the current price, where selling overwhelmed buying and price dropped fast; a demand zone sits below, where buying overwhelmed selling and price rallied. Traders draw each zone around the small "base" candles just before the move, and watch for a reaction when price returns.
Key points:
- Supply zone: the base before a sharp drop. Traders look for shorts when price comes back up into it.
- Demand zone: the base before a sharp rally. Traders look for longs when price comes back down into it.
- Two lines define a zone: the proximal line (the edge nearest current price) and the distal line (the far edge, where the stop goes).
- Zones are not guarantees. Price can run straight through a zone, so every trade needs a stop beyond the distal line.
What Are Supply and Demand Zones?
Supply and demand zones are areas on a chart where an imbalance between buyers and sellers caused price to leave quickly. The idea is old: StockCharts describes support and resistance as "key junctures where supply and demand meet," and says prices are driven by "excesses of supply (down) and demand (up)" (StockCharts ChartSchool, checked on 31 Oct 2026).
Supply and demand traders take that idea and narrow it down. Instead of drawing a line where price turned several times, they draw a box around the spot where a strong move started, on the view that orders left unfilled there may still be waiting.
What is a supply zone?
A supply zone is the base of candles just before a sharp drop. It sits above the current price, and traders expect sellers to show up again if price rallies back into it.
What is a demand zone?
A demand zone is the base of candles just before a sharp rally. It sits below the current price, and traders expect buyers to show up again if price falls back into it.
Uptime
99.999% uptime. Built for 24/7 trading reliability.
Your VPS runs in Tier IV datacenters with redundant power and network, monitored 24/7 on site.
See the uptime SLA





From $29.99/mo · Windows or Linux
The Four Supply and Demand Formations
Every zone forms from a move into a base and a move out of it, which gives four patterns. Two make supply zones and two make demand zones.
| Formation | Zone type | What happened | Reversal or continuation |
|---|---|---|---|
| Rally, base, drop | Supply | Price rose, paused, then fell sharply | Reversal |
| Drop, base, drop | Supply | Price fell, paused, then fell again | Continuation |
| Drop, base, rally | Demand | Price fell, paused, then rose sharply | Reversal |
| Rally, base, rally | Demand | Price rose, paused, then rose again | Continuation |
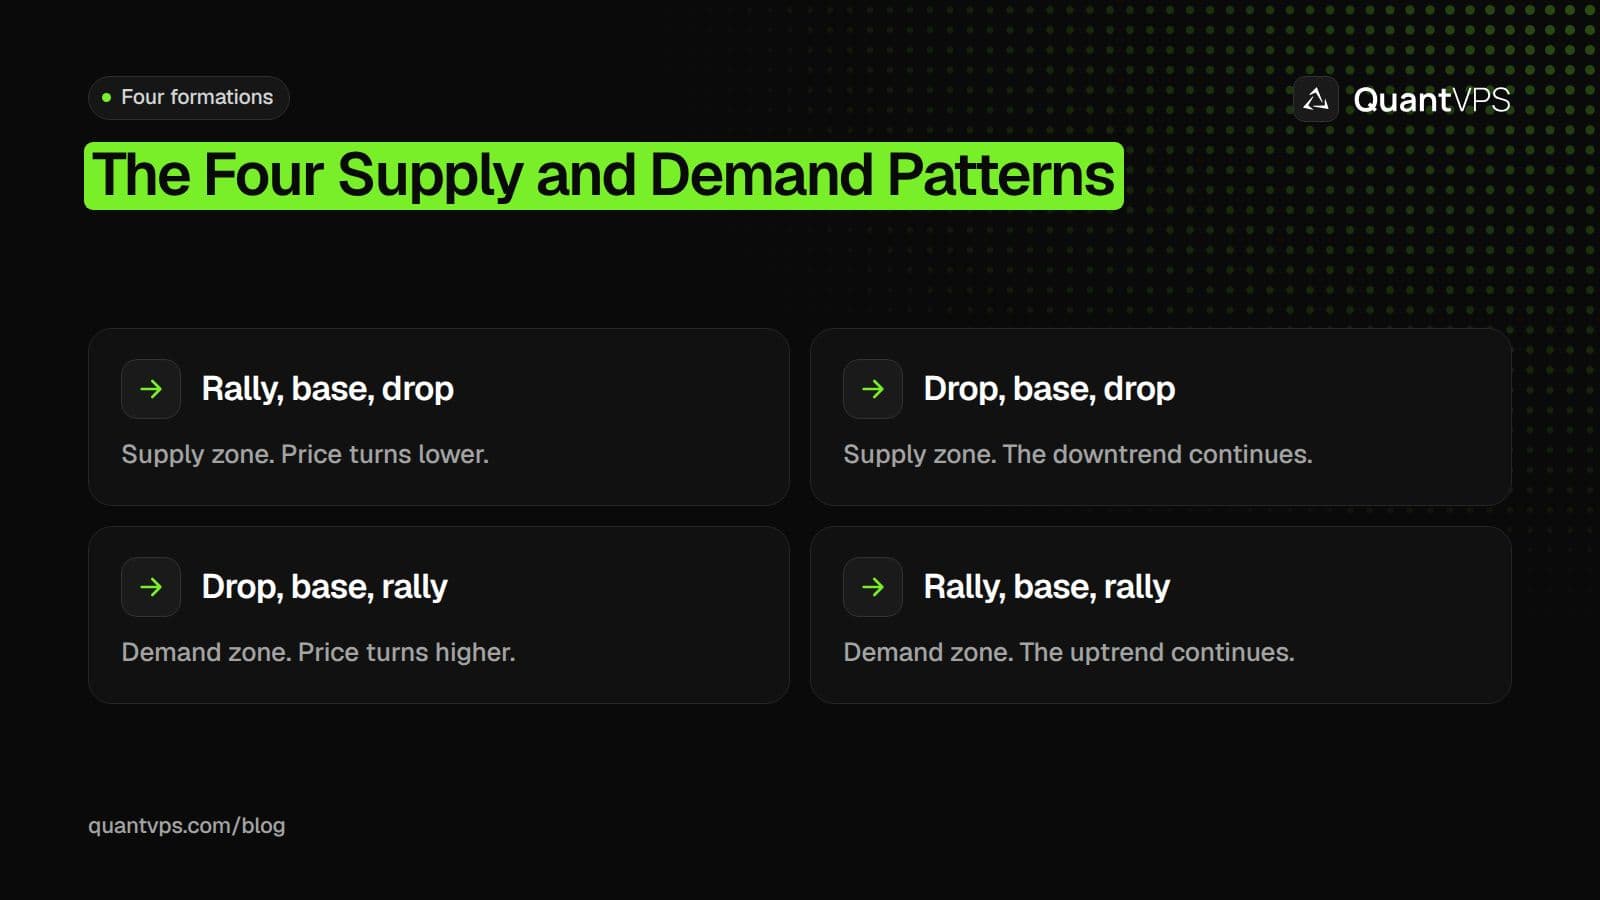
The move after the base decides the zone: a drop makes supply, a rally makes demand.
The move out of the base is what matters most. A zone only exists if price left it quickly, with large candles and little overlap between them.
How to Draw Supply and Demand Zones
To draw a supply or demand zone, find a sharp move, mark the base of small candles right before it, then draw the proximal line at the base's nearest body edge and the distal line at its farthest wick. The steps below use a demand zone; flip them for supply.
- Find a strong move. Look for two or more large candles moving away fast. If the move crawls, skip it.
- Find the base. The base is the small candles, often one to a few, where price paused just before the move.
- Draw the proximal line. For a demand zone, use the highest candle body in the base. For a supply zone, use the lowest candle body.
- Draw the distal line. For a demand zone, use the lowest wick in the base. For a supply zone, use the highest wick. Some traders include the wick of the first candle of the move if it reaches further.
- Extend the box to the right until price returns to it.
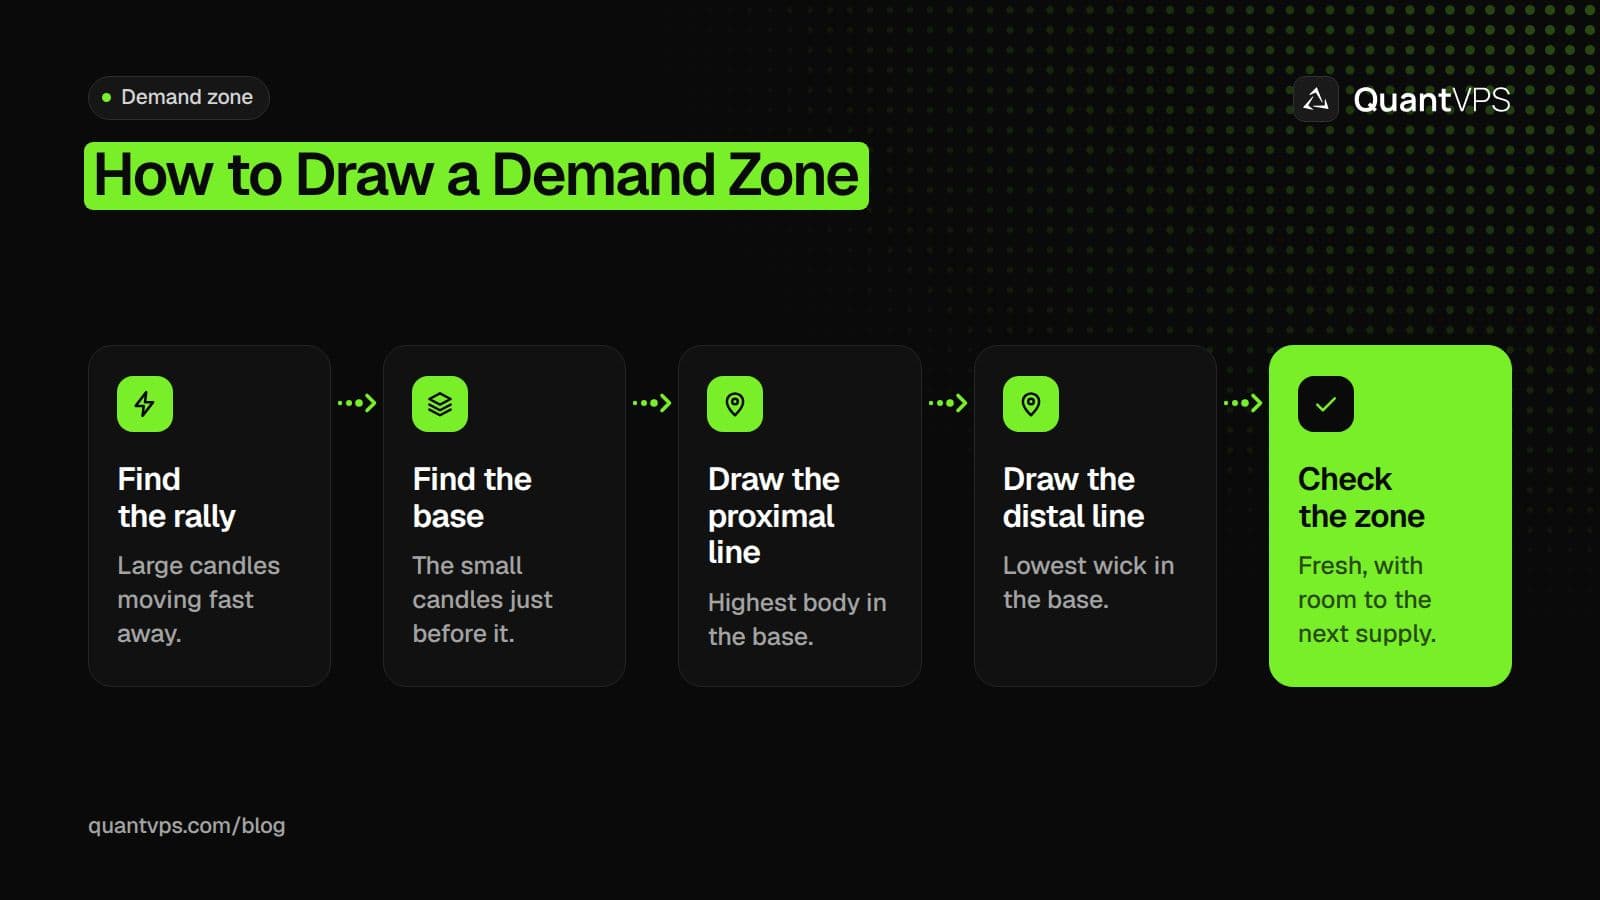
For a supply zone, flip it: the proximal line is the lowest body and the distal line is the highest wick.
Use the same rules on every chart. A zone that is too wide gives a poor reward against its risk; one that is too narrow gets stopped out by normal noise.
What Traders Look for in a Strong Zone
Traders rate zones with a few checks so they can skip weak ones. None of these checks guarantees a reaction; they are filters that supply and demand traders commonly use.
- A fast departure. Large candles leaving the base show a clear imbalance. A slow, overlapping move shows little.
- A short base. Fewer candles in the base usually means a narrower, clearer zone.
- Freshness. Many traders prefer zones price has not returned to yet, on the view that each visit fills some of the waiting orders.
- Room to the next zone. A demand zone with a supply zone just above it leaves little room for a target.
- The higher-timeframe trend. A demand zone in a daily uptrend lines up with the bigger picture; one in a daily downtrend fights it.
Supply and Demand Zones vs Support, Resistance and Order Blocks
Supply and demand zones, support and resistance, and order blocks all mark places where price may react, but they are drawn from different parts of the chart. The table shows how they compare.
| Support and resistance | Supply and demand zone | Order block | |
|---|---|---|---|
| Drawn as | A line or narrow band | A box from proximal to distal line | A box around one candle |
| Built from | Prices where the market turned several times | The base before a sharp move | The last opposite candle before a strong move |
| More touches | Often seen as a stronger level | Often seen as a weaker zone | Usually traded on the first return |
| Origin | Classic technical analysis | Supply and demand trading education | ICT (Inner Circle Trader) teaching |
Order blocks are the closest relative: both mark the spot a strong move started, but an order block narrows it to a single candle. Our guide to order blocks in trading covers how ICT traders find them.
Both zones and order blocks can fail. When an order block breaks and flips into the opposite role, it becomes a breaker, which we explain in breaker blocks vs order blocks.
A third relative is the wick zone left when price sweeps a high or low and snaps back. ICT traders call that a rejection block, and one can sit at the edge of a supply or demand zone.
How to Trade Supply and Demand Zones
Most traders trade a zone in one of two ways: a limit order at the proximal line, or a wait for confirmation inside the zone on a lower timeframe. Both put the stop just beyond the distal line.
- Limit entry: place a buy limit (demand) or sell limit (supply) at the proximal line, a stop beyond the distal line, and a target at the next opposing zone. It catches fast reactions but also fills on zones that fail.
- Confirmation entry: wait for price to enter the zone, then for a lower-timeframe shift in structure, such as a break of the last small swing high in a demand zone. It filters some failures but can miss fast moves.
Order flow
Built for scalpers. Heatmaps on dedicated resources.
Order-flow heatmaps and DOM ladders run on dedicated CPU, memory and NVMe, so your charts keep responding during volatility.
See the dedicated hardwareFrom $29.99/mo · Windows or Linux
Example: a demand zone on ES
This is an illustrative example with made-up round prices, not a real chart or a trade signal. E-mini S&P 500 futures (ES) are $50 per index point, with a 0.25-point tick worth $12.50 (CME Group ES contract specs, checked on 31 Oct 2026).
- The base: on a 15-minute ES chart, price drops, then pauses for three small candles. Their highest body is 7,704.50 and their lowest wick is 7,698.75.
- The rally: four large candles carry ES up to 7,745.00, a drop, base, rally demand zone.
- The zone: proximal line 7,704.50, distal line 7,698.75.
- The entry: a buy limit at 7,704.50 fills when price returns later in the session.
- The stop: 7,698.50, one tick under the distal line. Risk is 6 points, or $300 per ES contract.
- The target: the next supply zone, whose proximal line is 7,736.00. That is 31.5 points, or $1,575 per ES contract.
If price closes below 7,698.75, the zone has failed and the stop takes you out. Do not move the box to make the trade fit.
Common Mistakes
Most supply and demand mistakes come from drawing zones that never showed a real imbalance, or from trading them without a plan for failure. These are the most common.
- Drawing a zone at every pause. Without a sharp move away, a base is just a pause.
- Making zones too wide. A box that spans half the day's range gives no useful stop.
- Trading zones that have been tested many times. Many traders treat a much-visited zone as weaker.
- Ignoring the bigger trend. Buying demand zones in a strong daily downtrend means trading against the larger flow.
- No stop beyond the distal line. Zones fail, and a trade without a stop turns a small loss into a large one.
- Redrawing after the fact. Moving the lines after price breaks them hides the failure instead of learning from it.
Limits of Supply and Demand Zones
Supply and demand zones describe where price moved fast in the past; they do not show the actual orders waiting there now. There is no published success rate for them, and two traders can draw different zones on the same chart.
Test your drawing rules on past charts and in a simulator before trading them with money, and keep each loss small.
If you set price alerts at your zones or run an automated strategy that places limit orders at them, a trading VPS keeps the platform running while your own computer is off.
FAQs
What is the difference between a supply zone and a demand zone?
A supply zone is the base before a sharp drop and sits above current price; traders look for shorts there. A demand zone is the base before a sharp rally and sits below current price; traders look for longs there.
Are supply and demand zones the same as support and resistance?
They are related but drawn differently. Support and resistance come from prices where the market turned several times. Supply and demand zones come from the base before one sharp move and are drawn as a box.
What timeframe is best for supply and demand zones?
Zones appear on every timeframe. Many traders mark zones on a higher timeframe, such as 1-hour or daily, and refine entries on a lower one.
Where do you put the stop on a supply or demand zone?
Just beyond the distal line: a tick or two below a demand zone, or above a supply zone. A close beyond the distal line means the zone has failed.


