
Order blocks and breaker blocks are key concepts in Smart Money trading. Here's the quick takeaway:
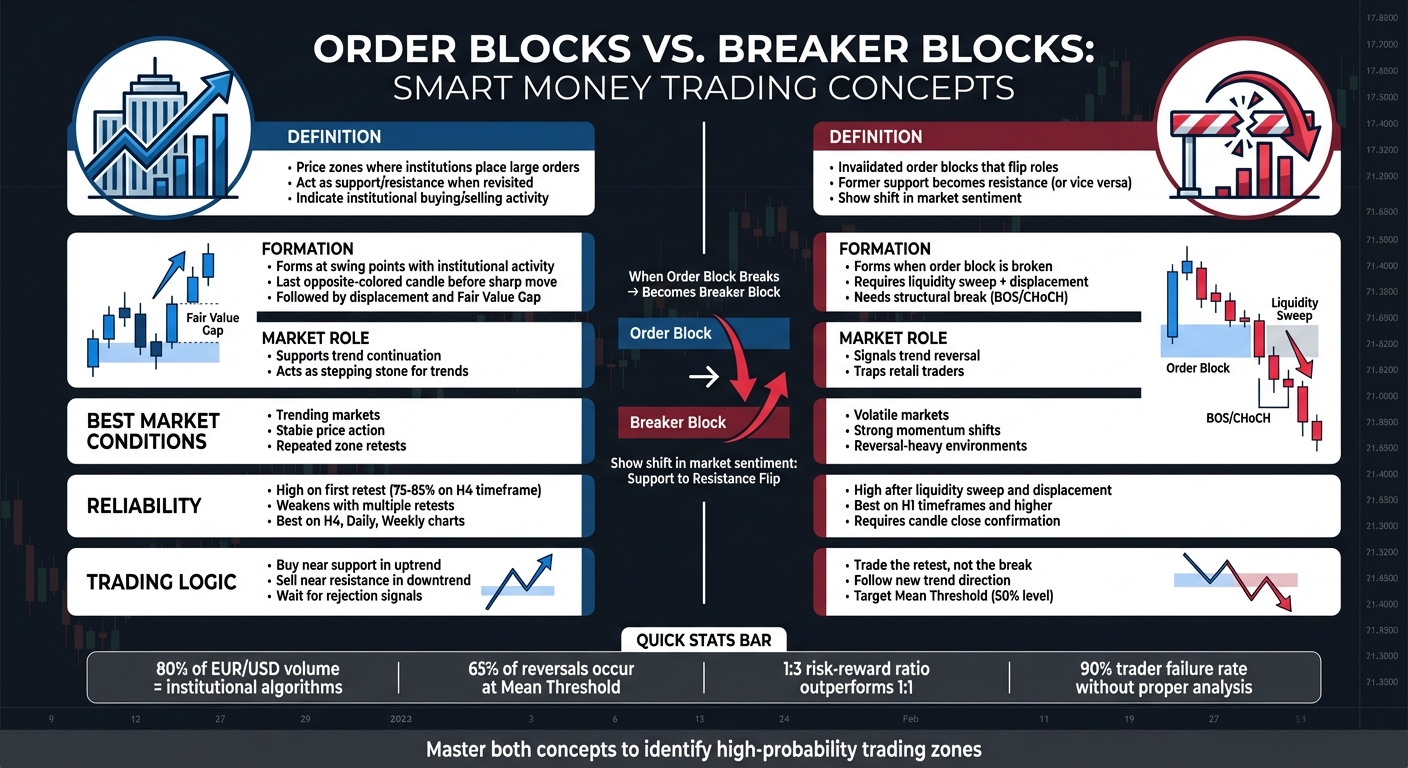
- Order blocks are price zones where institutions place large orders, often leading to sharp price moves. They act as support or resistance when revisited.
- Breaker blocks are invalidated order blocks. For example, when a bullish order block is broken to the downside, it flips into a bearish breaker block, now acting as resistance.
Quick Overview:
-
Order Blocks:
- Indicate where institutional buying/selling occurred.
- Useful in trending markets for trend continuation.
- High reliability on higher timeframes (H4, Daily, Weekly).
-
Breaker Blocks:
- Show a shift in market sentiment after an order block fails.
- Ideal for volatile markets with trend reversals.
- Require structural breaks like BOS (Break of Structure) or CHoCH (Change of Character).
Quick Comparison:
| Feature | Order Block (OB) | Breaker Block (BB) |
|---|---|---|
| Formation | Forms at swing points with institutional activity. | Forms when an order block is invalidated. |
| Market Role | Supports trend continuation. | Signals trend reversal. |
| Reliability | High on first retest. | High after liquidity sweep and displacement. |
| Best Use | Trending markets. | Volatile, reversal-heavy markets. |
Both concepts are tools to understand price action and institutional activity. Order blocks focus on trend continuation, while breaker blocks signal reversals. Mastering these helps traders identify high-probability zones and manage trades effectively.
Order Blocks vs Breaker Blocks: Key Differences in Smart Money Trading
What Are Order Blocks?
Order blocks highlight price zones where institutional trades trigger significant market moves. These areas represent points where strong buying or selling activity first occurred, often leading to a sharp price shift.
As Jennifer Pelegrin, Technical Financial Writer at XS, puts it:
"Order blocks mark the areas where real buying or selling pressure first showed up. When price comes back to those zones, they often play a role in whether the trend carries on."
An order block forms when prices consolidate as institutions execute large orders, followed by a swift breakout. This breakout often disrupts the market structure, leaving behind a Fair Value Gap. When the price revisits these zones, they frequently act as high-probability levels of support or resistance.
Key Features of Order Blocks
A bullish order block typically appears as the last bearish candle before a strong price rally, while a bearish order block is the last bullish candle before a sharp price drop. The price movement away from these blocks should be marked by "displacement" - a rapid and decisive move that may leave an imbalance or Fair Value Gap in its wake.
Order blocks identified on higher timeframes, such as H4, Daily, or Weekly charts, tend to be more reliable due to reduced market noise. The first retest of an order block is often the most impactful. However, as the price interacts with the zone repeatedly, its effectiveness tends to weaken.
| Feature | Bullish Order Block | Bearish Order Block |
|---|---|---|
| Location | End of a downtrend or during a bullish pullback | End of an uptrend or during a bearish pullback |
| Candle Type | Last bearish candle before a strong move up | Last bullish candle before a strong move down |
| Market Role | Acts as a potential support zone | Acts as a potential resistance zone |
| Institutional Action | Indicates large-scale buying/accumulation | Indicates large-scale selling/distribution |
Order Block Examples
To identify an order block, look for a Break of Structure (BOS) or a Change of Character (CHoCH) following its formation. For example, if you see a single bearish candle followed by a rapid sequence of bullish candles breaking above a recent high, that bearish candle is likely a bullish order block.
Before entering a trade, wait for a reaction - such as a slowdown in price or rejection illustrated by long wicks. Place your stop-loss below a bullish order block or above a bearish one. If the price cuts straight through the zone without any reaction, the order block is likely invalid, and the trade setup fails.
This approach lays the groundwork for spotting reliable order blocks, a concept that will be expanded on in later sections.
What Are Breaker Blocks?
Run 24/7 while you sleep. Keep bots, platforms, and trade copiers online on a dedicated VPS.
Low-latency VPS hosting for your trading platform.
From $59.99/mo
A breaker block is an order block that shifts roles after being broken, signaling a change in market sentiment. Simply put, it’s a support level that, once broken, becomes resistance - or vice versa.
Jennifer Pelegrin, a Technical Financial Writer at XS, describes breaker blocks as follows:
"Breaker blocks show up when an order block no longer holds and price pushes through it, often after a liquidity sweep. That flip usually hints that momentum has changed."
The concept of breaker blocks is tied to trapped traders. For example, when a bullish order block acting as support breaks, traders who bought at that level get stuck. When the price revisits that zone, these traders often sell to exit at breakeven, creating selling pressure. The same logic applies to bearish breaker blocks, but in reverse.
However, not every price movement qualifies as a breaker block. A valid breaker block requires a clear structural break, such as a Change of Character (CHoCH) or a Break of Structure (BOS). This structural confirmation helps distinguish genuine breaker blocks from random market fluctuations.
Key Features of Breaker Blocks
Breaker blocks emerge when an order block is broken - typically after a liquidity sweep and displacement - causing a shift in its role. This shift is often accompanied by a Fair Value Gap, reinforcing the validity of the setup.
- A bullish breaker block starts as a bearish order block (resistance). When the price breaks above it and establishes a higher high, the former resistance zone becomes support on the retest.
- A bearish breaker block begins as a bullish order block (support). When the price breaks below it and forms a lower low, the former support zone turns into resistance on the retest.
| Breaker Type | Original Form | Formation Process | New Function |
|---|---|---|---|
| Bullish Breaker | Bearish Order Block | Price breaks above the former resistance zone and forms a higher high | Acts as Support on retest |
| Bearish Breaker | Bullish Order Block | Price breaks below the former support zone and forms a lower low | Acts as Resistance on retest |
The most reliable breaker blocks are found on H1 timeframes and higher, as lower timeframes tend to have more market noise, leading to unreliable setups. For confirmation, look for a candle close above or below the order block, rather than just a wick piercing the zone.
Breaker Block Examples
To identify breaker blocks, start by locating an existing order block. Watch for a liquidity sweep - where stop losses are triggered above resistance or below support. Next, observe whether the price breaks through the order block with strong displacement, accompanied by a structural break like a CHoCH or BOS.
The best entries occur on the retest of the breaker block. Avoid entering on the initial break. For instance, if a bullish order block at $50.00 is broken to the downside, forming a new lower low at $48.50, the $50.00 zone becomes a bearish breaker block. When the price rallies back to test $50.00, look for bearish rejection signals to enter a short position.
To improve success rates, combine breaker blocks with other Smart Money Concepts. For example, look for breaker blocks forming within Fair Value Gaps or following liquidity sweeps. These additional factors can significantly increase the likelihood of a successful trade. This approach highlights the dynamic relationship between support, resistance, and institutional trading strategies - key elements in smart money trading.
Order Blocks vs. Breaker Blocks: Main Differences
Building on earlier definitions, order blocks and breaker blocks serve contrasting roles in market analysis, even though both originate from Smart Money trading concepts and broader day trading patterns. An order block highlights where institutions initially placed large orders, creating a zone the market is likely to respect when revisited. On the other hand, a breaker block signifies an invalidated order block - a level where the price has broken through decisively, flipping its role. In this case, what was once support becomes resistance, or vice versa.
The key difference lies in timing within market structure. Order blocks typically appear before liquidity is swept, acting as the starting point for a strong price movement. Breaker blocks, however, form after a liquidity sweep, when the original order block gets invalidated. Order blocks are most effective in steady trends with repeated zone retests, while breaker blocks shine in scenarios involving clear liquidity grabs and momentum shifts. This timing difference has significant implications for trading strategies.
Comparison Table: Order Blocks vs. Breaker Blocks
| Feature | Order Block (OB) | Breaker Block (BB) |
|---|---|---|
| Formation Process | Forms at swing points where institutions accumulate or distribute | Forms when an existing OB is invalidated by a decisive price break |
| Purpose | Highlights where smart money entered | Highlights where smart money trapped retail traders |
| Market Role | Supports trend continuation (acts as support or resistance) | Signals trend reversal (role reversal after structural break) |
| Ideal Trading Conditions | Works best in stable, trending markets | Excels in volatile markets with strong momentum shifts |
| Reliability Factors | High when price first returns to the zone (mitigation) | High after a liquidity sweep and displacement move |
| Stop-Loss Placement | Just outside the far edge of the block | Just beyond the breaker zone; reclaim invalidates setup |
Detailed Breakdown of Differences
The psychological dynamics behind these concepts are distinct. Order blocks reflect institutional activity at specific price levels, creating imbalances that draw the price back to those zones. Breaker blocks, on the other hand, take advantage of trapped traders - those who entered at the original order block and are now in losing positions. When the price revisits the invalidated zone, these traders exit at breakeven, providing the liquidity needed for the market to continue in its new direction.
The trading logic for each also differs. With order blocks, traders might go counter-trend or use the block to start a trend - buying near support in an uptrend or selling near resistance in a downtrend. Breaker blocks, however, focus on following the new trend direction that emerges after the break. As indicator.trading explains:
"The money in breaker blocks isn't made on the initial break - it's made on the retest."
This highlights the importance of patience when trading breaker blocks. Rather than entering during the initial break, traders wait for the price to return to the invalidated zone before committing. This approach helps clarify how these formations play out on your charts.
How Order Blocks Form
Order blocks take shape when large institutions place substantial buy or sell orders at specific price levels, creating a noticeable supply or demand imbalance. These institutions - think central banks or top-tier hedge funds - can’t execute massive orders all at once. Instead, they spread their buying or selling over a defined price range. This process happens in distinct steps that reveal their intentions.
It all begins with a pause or consolidation phase, during which institutional orders are being processed. This phase often shows up as the "last candle" of the opposite color. For example, in a bullish order block, you’ll see a final bearish (down) candle before a strong upward move. Conversely, a bearish order block is marked by the last bullish (up) candle before a sharp price drop. After this consolidation, the price exits with a strong move, typically characterized by large-bodied candles that create Fair Value Gaps (FVGs). These order blocks are part of a bigger picture that includes trends, liquidity, and market inefficiencies.
For confirmation, the price must break a previous high or low, resulting in a Break of Structure (BOS) or Change of Character (CHoCH). This shift signals that institutional players, often referred to as "smart money", have changed the market’s direction. Interestingly, nearly 80% of daily trading volume in major currency pairs like EUR/USD is driven by institutional algorithms. These algorithms often revisit order block zones to "rebalance" or complete orders left unfilled during the initial strong move.
How to Identify Order Blocks on Your Charts
Spotting order blocks on your charts is a key skill. Start by focusing on displacement, not specific candles. Look for a sharp, decisive price move that breaks the market structure. Once you’ve identified this impulsive move, trace it back to its origin to locate the order block. The key elements include the strong move itself, the preceding opposite-colored candle, the resulting Fair Value Gap, and confirmation that the zone hasn’t been fully tested yet.
Stick to higher timeframes, like H4 or Daily, to filter out market noise. Over 65% of institutional reversals occur around the "Mean Threshold", which is the midpoint of a refined higher-timeframe order block. When marking an order block, include the full range from the high to the low of that last opposite-colored candle. For a more precise entry, identify the block on a higher timeframe, then switch to a lower timeframe, such as M15, to fine-tune your stop-loss and improve your reward-to-risk ratio.
How Breaker Blocks Form
A breaker block is essentially an order block that has failed to hold its ground and has flipped its role in the market structure. This shift doesn’t happen by chance - it starts with a liquidity sweep. In this phase, smart money triggers stop losses around key levels, causing a reversal. This traps retail traders who either bought the "dip" at what they thought was support or sold the "rally" at what they assumed was resistance.
The defining moment is a structural break, often referred to as a CHoCH (Change of Character). For example, when a bullish order block (previously support) breaks to the downside, it turns into a bearish breaker block (now resistance). Similarly, if a bearish order block (previously resistance) is broken to the upside, it becomes a bullish breaker block (now support).
"A breaker block is a former order block that failed to hold and has now flipped its role in the market structure. Think of it like a castle wall that gets breached - once the enemy breaks through, that same wall becomes their defensive position against counterattacks." - indicator.trading
The psychological element here is crucial. Traders who initially entered positions at the original order block find themselves "trapped" when the price breaks through. When the price revisits this zone, the trapped traders' actions reinforce the new support or resistance level.
Next, let’s explore how you can pinpoint these formations on your charts.
How to Identify Breaker Blocks on Your Charts
Spotting breaker blocks requires a step-by-step approach. Begin by identifying a clear order block - this is typically the last opposite-colored candle before a strong price move. Then, look for a liquidity sweep, where the price wicks above a recent high or below a recent low, trapping traders in the process. The final and most important step is spotting displacement, which is marked by large-bodied candles breaking through the order block, often leaving behind Fair Value Gaps.
Stay online and closer to execution. Choose a VPS location for CME futures, New York markets, London FX, API trading, and more.
Host your platform near the market route that matters.
From $59.99/mo
For accuracy, focus on H1 charts or higher timeframes. Lower timeframes can be noisy and prone to false signals. A simple wick through an order block isn’t enough; you need a candle close or a clear structural shift to confirm the role reversal. Wait for the price to close above or below the original order block range before marking it as a breaker block. Once confirmed, highlight this zone and wait for the price to retest it. Place your stop loss just beyond the breaker zone. If the price reclaims the zone and breaks back through, the setup becomes invalid.
Formation Comparison Table
| Feature | Order Block (OB) | Breaker Block (BB) |
|---|---|---|
| Formation Trigger | Sharp reversal at a swing point after a directional move. | Decisive failure and breach of an existing order block. |
| Market Condition | Stable or trending markets where institutions add positions. | Volatile shifts or reversals, often following a liquidity sweep. |
| Defining Characteristic | The final candle (up or down) before a significant price move. | A role-reversal zone where former support becomes resistance (or vice versa). |
| Psychological Basis | Unfilled institutional orders waiting to be triggered. | Mitigation logic where trapped traders confirm the new zone. |
| Structural Role | Acts as a "stepping stone" to continue or start a trend. | Marks a "Change of Character" (CHoCH) and trend reversal. |
Trading Strategies Using Order Blocks
Think of order blocks as zones where institutions are likely active, not as exact price levels. A smart way to trade them is by using a retest-and-react strategy. Instead of jumping in as soon as the price touches the block, wait for clear rejection signals like a pin bar, an engulfing candle, or a structural shift on a lower timeframe. This helps you avoid getting stopped out too early.
For more precise entries, combine higher and lower timeframes. Start by identifying the order block on a higher timeframe like the 4-hour (H4) or daily chart to confirm the trend. Then, fine-tune your entry on a lower timeframe, such as the 15-minute (M15) or 5-minute (M5) chart. This approach reduces risk and allows for tighter stop-loss placements. Place your stop just outside the block - below the low for bullish blocks or above the high for bearish ones - and add a 5–10 pip buffer to account for volatility and spreads.
When it comes to exits, aim for the next key swing level or follow a fixed risk-to-reward ratio. Research shows that a 1:3 reward-to-risk ratio with a 40% win rate often outperforms a 1:1 ratio with a 60% win rate. You could also take partial profits at the first major swing point and move your stop to breakeven for the remaining position.
"Order blocks are not standalone signals. They live inside a broader narrative of trend, liquidity, and inefficiency." - ACY Securities Editorial Team
Focus on setups with higher odds of success. These are typically order blocks that caused sharp price movements, leaving behind fair value gaps. For example, in major currency pairs like EUR/USD, around 80% of daily volume is driven by institutional algorithmic flows. Additionally, over 65% of institutional reversals occur near the "Mean Threshold" (the 50% level) of a refined higher-timeframe order block. Be selective - don’t label every small pause as an order block. Instead, highlight zones that led to meaningful price moves.
Best Practices for Order Block Trading
To improve your results, follow these best practices. First, limit your risk to 1%–2% of your account equity per trade. Calculate your position size based on the distance to your stop-loss, not by sticking to a fixed lot size [7,10]. This disciplined approach is critical, especially since about 90% of traders fail to pass a prop firm challenge due to poor institutional analysis.
Timing also plays a crucial role. Order blocks tend to work best during high-liquidity periods, such as the London or New York sessions. Avoid trading during the Asian session or right before major economic news, as these conditions can disrupt even the strongest setups [7,8,10]. Order blocks identified on the 4-hour chart have an accuracy rate of 75%–85%, while those on the 15-minute chart are slightly less reliable at 65%–75%.
Be ready to invalidate setups if certain conditions arise. For instance, if a candle closes beyond the block’s boundaries or if the zone has been tested several times without a strong reaction, it’s likely no longer effective [7,8,4]. Untested order blocks generally offer more reliable opportunities.
Always trade in alignment with the higher timeframe trend. Look for zones forming at significant swing highs or lows, avoiding choppy, sideways markets [7,8,10]. If an order block aligns with a Fair Value Gap, the odds of success improve, as prices often return to fill these gaps [7,8,9].
Finally, set a daily loss limit of 3% to avoid emotional decision-making. If you hit this limit, step away from the charts. Overtrading during poor conditions is one of the most common pitfalls for traders working with order blocks [7,8,10].
Trading Strategies Using Breaker Blocks
Breaker blocks are powerful tools for spotting market reversals, but they require patience and precision to use effectively. One fundamental rule: don’t jump in on the initial breakout. The true opportunity lies in waiting for the price to return and test the newly flipped zone. As indicator.trading explains:
"The money in breaker blocks isn't made on the initial break - it's made on the retest".
This retest provides a more controlled entry point and a clear invalidation level, which is far safer than trying to trade during the initial, often chaotic breakout. Let’s break down the specifics of how to approach entries and manage risk.
Entry Criteria and Risk Management
A key target for entry is the Mean Threshold, which is the 50% level of the breaker candle’s body. According to FXNX:
"Institutions often reprice to this equilibrium point".
By aiming for this level, you can sidestep minor price fluctuations that might otherwise stop you out, while still positioning yourself to capture the main move. For stop-loss placement, set it just beyond the liquidity sweep’s tail. If the price breaches this wick, the setup is invalidated, and exiting the trade is the safest move.
It’s also crucial to focus on higher timeframes for more reliable setups. Charts below the 1-hour timeframe are prone to noise and higher failure rates, making them less dependable. Stick to H1, 4-hour, or daily charts, where institutional activity is more apparent. Additionally, take the broader context into account: trade bearish breakers in premium zones and bullish breakers in discount zones. This approach aligns with institutional price behavior and increases the likelihood of success.
For the highest-probability trades, look for what’s often called the "Unicorn Setup." This occurs when breaker blocks overlap a Fair Value Gap during high-liquidity sessions, such as the London or New York opens. As indicator.trading highlights:
"Breaker blocks within a fair value gap are the highest confluence SMC setups. You're combining structural failure (breaker) with imbalance mitigation (gap) for maximum probability trades".
Best Practices for Breaker Block Trading
Once your entry levels are defined, the next priority is disciplined risk management to safeguard your trades. Here’s what to keep in mind:
- Limit your risk to 1%–2% of your account per trade. Calculate position size based on the stop-loss distance rather than using fixed lot sizes.
- Focus on trading during high-volatility periods, such as major session opens (London or New York), when institutional flows are strongest. Avoid low-volume times, like the Asian session or just before major economic announcements.
- Confirm clear displacement with large candles that close decisively beyond the previous swing. When price retests the breaker block, look for additional confirmation, such as hammer candles, engulfing patterns, or smaller timeframe order blocks forming within the breaker zone. If the price drifts through the level without a strong close, it likely lacks institutional support.
Conclusion
Order blocks and breaker blocks are two sides of the same coin in understanding price action. Order blocks highlight areas where institutions have entered the market, creating zones that often drive trends. Breaker blocks, on the other hand, signal moments when institutional intent shifts, turning support into resistance - or the reverse. As Jennifer Pelegrin, Technical Financial Writer at XS, explains:
"Ultimately, all these blocks do is help you read how price behaves when it reaches a level that matters".
The real skill lies in knowing when and how to apply each one. Order blocks are most effective in steady, trending markets, offering opportunities for continuation trades. Breaker blocks, however, come into play during volatile reversals, especially after liquidity sweeps that leave traders trapped on the wrong side. By learning to identify both, you can differentiate between a simple pullback likely to hold and a structural break signaling a new market direction.
Mastering these concepts allows you to turn the chaos of price action into clear trading zones. This knowledge helps you align entries, stop-losses, and profit targets with the flow of institutional orders. It also gives you an edge in understanding where trapped traders are forced to exit, further refining your strategy.
Recognizing why price reacts at these levels - and how these zones are created - sets disciplined traders apart from those who rely solely on candlestick patterns.
FAQs
How can I tell if an order block is still valid?
An order block stays relevant as long as the price hasn’t clearly shifted away from it after its formation. It also remains valid if it hasn’t broken beyond a nearby high or low or been repeatedly tested or traded through. These conditions indicate that the zone continues to act as an important support or resistance area.
What confirms a real breaker block, not a fakeout?
When a previous order block gets invalidated - either through a stop hunt or a clear displacement - it creates what’s known as a real breaker block. This happens when the price reverses direction and transforms the zone into either support or resistance. It’s a strong signal that the market structure has genuinely shifted, as opposed to being just another fakeout.
Which timeframes work best for OBs and BBs?
Higher timeframes like 4-hour, daily, or weekly charts are often favored when trading order blocks (OBs) and breaker blocks (BBs). Why? These charts offer a clearer view of the market structure and filter out much of the noise found in lower timeframes. This clarity makes OBs and BBs more dependable for planning strategic entry and exit points. Many traders also notice that major market moves and meaningful structural breaks are much easier to identify on these higher timeframes.


