
SMT divergence is when two closely correlated markets disagree at a swing point: one makes a new high or low and the other does not. On ES and NQ, a bullish SMT is ES making a lower low while NQ holds a higher low, and a bearish SMT is one making a higher high while the other makes a lower high. Traders who follow ICT read it as a sign that the move is not confirmed and a reversal may follow, not as a signal on its own.
Key points:
- SMT is usually expanded as "smart money technique", a term from Michael J. Huddleston's Inner Circle Trader (ICT) teaching. Some traders call it smart money divergence.
- Common pairs: ES and NQ, ES and YM, and EUR/USD against the US Dollar Index (DXY), which moves the opposite way.
- It is a filter, not an entry. Traders pair it with a liquidity sweep and a shift in structure before they trade.
- Compare the same times and timeframe on both charts, or the divergence is not real.
What SMT Divergence Is
SMT divergence is a failure of correlated markets to confirm each other. If two markets usually move together, a new low in one should come with a new low in the other. When only one of them breaks, traders say the move lacks broad support.
Classic divergence compares price with an indicator such as RSI on one chart. SMT compares price with price, using a second market as the reference. The idea, as ICT traders describe it, is that the market that refuses to make the new extreme shows where the stronger buying or selling sits.
There is no official rulebook. ICT teaches the idea in videos, and traders apply it in slightly different ways, so treat the rules below as common practice rather than fixed law.
Correlated Pairs Traders Compare
SMT only makes sense on markets that normally move together, or normally move in exactly opposite directions. The pairs below are the ones traders use most often.
| Pair | What they track | Relationship | What to compare |
|---|---|---|---|
| ES and NQ | E-mini S&P 500 and E-mini Nasdaq-100 futures | Positive | Highs with highs, lows with lows |
| ES and YM | E-mini S&P 500 and E-mini Dow futures | Positive | Highs with highs, lows with lows |
| EUR/USD and GBP/USD | The euro and the pound against the US dollar | Positive | Highs with highs, lows with lows |
| EUR/USD and DXY | The euro against the dollar, and the US Dollar Index | Inverse | EUR/USD lows with DXY highs, and the reverse |
The inverse pair works because the euro is the largest part of the dollar index. ICE, which runs the index, lists the euro at 57.6% of the basket, followed by the yen, the pound, the Canadian dollar, the Swedish krona and the Swiss franc (ICE US Dollar Index, checked on 31 Oct 2026).
For that inverse pair, a higher high in DXY should match a lower low in EUR/USD. If EUR/USD makes a higher low instead, that disagreement is the divergence.
Uptime
99.999% uptime. Built for 24/7 trading reliability.
Your VPS runs in Tier IV datacenters with redundant power and network, monitored 24/7 on site.
See the uptime SLA





From $29.99/mo · Windows or Linux
How to Spot SMT Divergence on a Chart
To spot SMT divergence, put both markets side by side on the same timeframe, mark the last two swing highs or lows on each, and check whether one market broke its earlier swing while the other did not. The two swings you compare must have formed at roughly the same time.
- Open both charts. Use two panes, or overlay the second symbol with your platform's compare tool.
- Match the settings. Same timeframe, same session, and for futures the same contract month or continuous charts built the same way, so a roll does not create a false swing.
- Mark two swings on each. At a high, mark the earlier swing high and the latest one. At a low, mark the two lows.
- Compare. If one market takes out its earlier swing and the other does not, you have a divergence. If both break, or neither does, there is no SMT.
- Wait for the swing to finish. The second swing is not confirmed until price turns away from it.
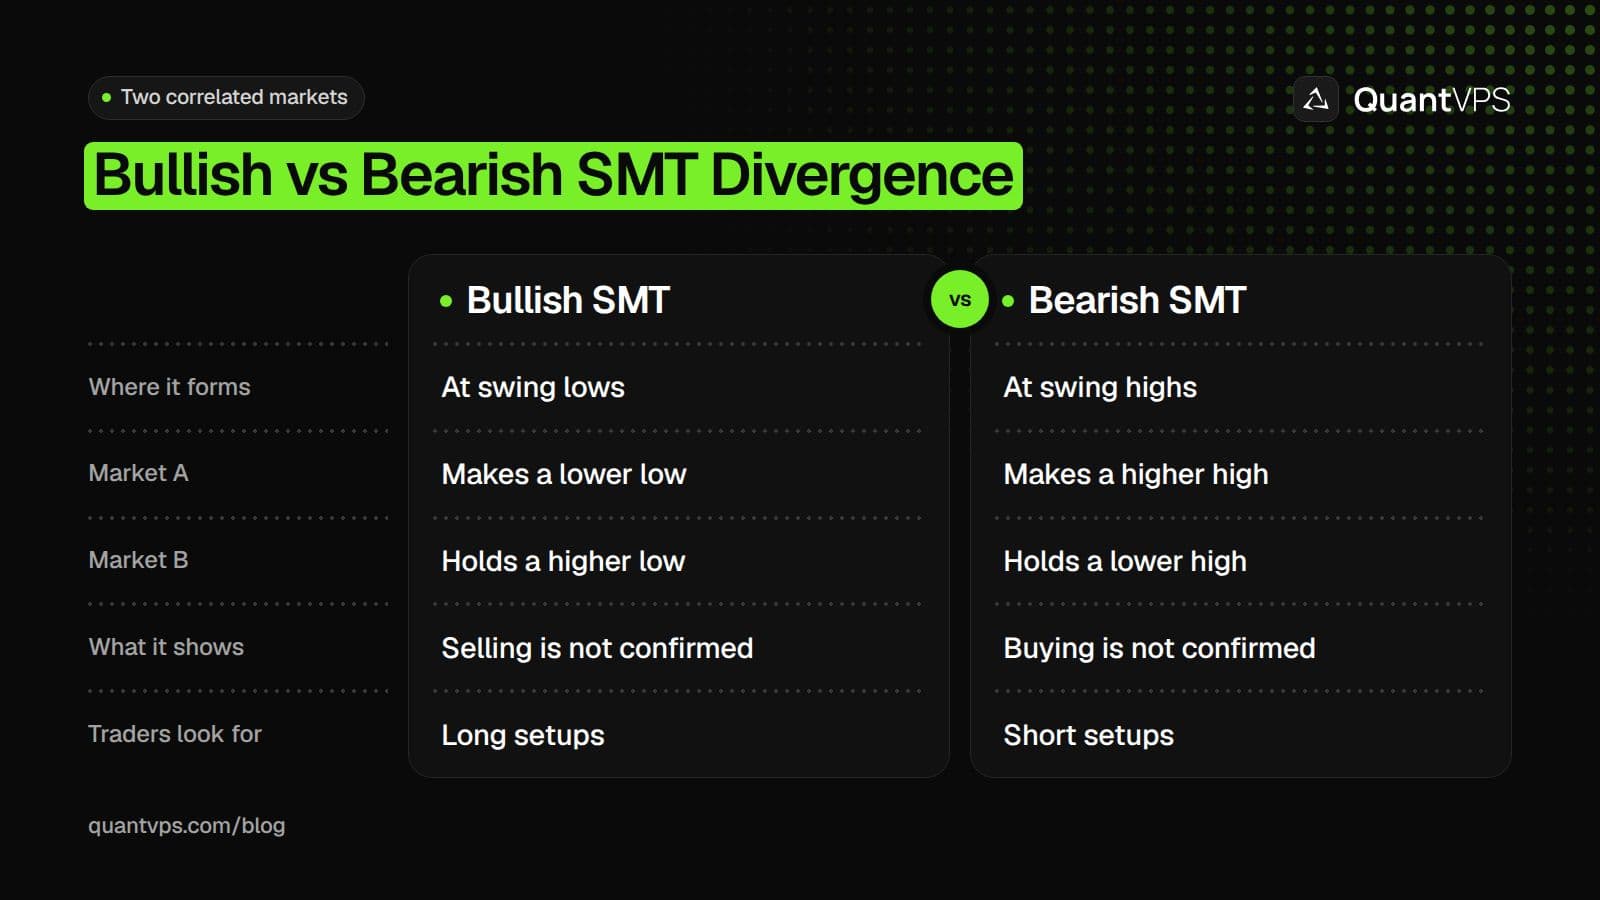
SMT divergence is one market making a new extreme that its correlated partner does not match.
Using an SMT divergence indicator
An SMT divergence indicator automates the same comparison: it finds swing highs and lows on your chart and on a second symbol, then marks the swings where one broke and the other did not. Many are community scripts on charting platforms, and each one defines a swing in its own way.
Most of these tools confirm a swing only after a set number of bars have closed on both sides of it, so the mark appears late. Check how a script finds pivots before you trust its marks, and compare a few of its signals with your own reading of the charts.
Combining SMT With Liquidity Sweeps and Order Blocks
Traders give SMT the most weight when the market that makes the new extreme does it by sweeping an obvious high or low. The sweep runs the stop orders resting beyond that level, and the partner market's refusal to follow suggests the move was mostly stops being filled, not new buying or selling.
Our guide to liquidity sweeps explains how those clusters of stops form and how a sweep differs from a real breakout. After the sweep and the divergence, traders want a shift in structure, such as a break of the last swing high after a bullish SMT.
The entry then comes from a price zone. Many traders use the last opposite candle before the move, covered in our guide to order blocks. Others use a failed order block that flips roles, which is explained in breaker blocks vs order blocks.
When that breaker overlaps a fair value gap, the setup becomes the ICT unicorn model, and SMT is often used as the filter that picks the side.
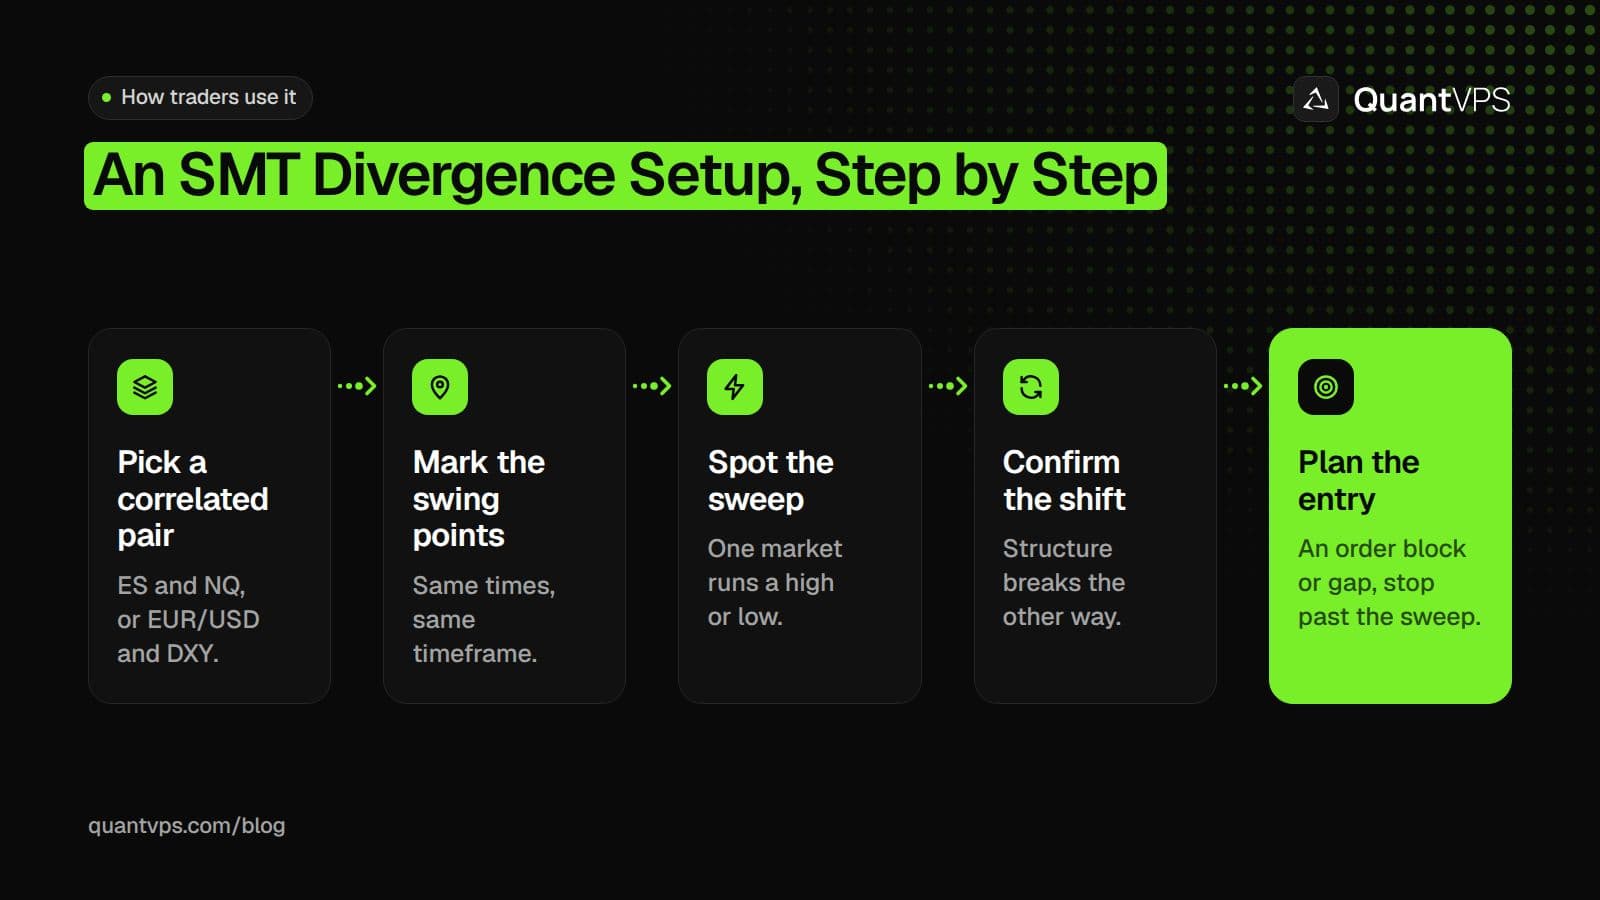
The divergence is the warning; the sweep, the shift and the entry zone make it a plan.
Example: Bullish SMT on ES and NQ
This is an illustrative example with made-up round prices, not a real chart or a trade signal. E-mini S&P 500 futures (ES) are $50 per index point, with a 0.25-point tick worth $12.50 (CME Group ES contract specs, checked on 31 Oct 2026). E-mini Nasdaq-100 futures (NQ) are $20 per index point (CME Group NQ contract specs, checked on 31 Oct 2026).
- The divergence: at 10:05 ET, ES makes a low at 7,805.00 and NQ makes a low at 27,300.00. At 10:35 ET, ES drops to 7,800.00, a lower low that takes out the stops under 7,805.00. NQ only reaches 27,320.00, a higher low.
- The shift: on the 1-minute chart, ES breaks above the last small swing high and closes at 7,812.00.
- The entry: you buy ES at 7,812.00, inside the order block left by the last down candle before the break.
- The stop: 7,798.75, one tick under the sweep low. Risk is 13.25 points, or $662.50 per ES contract.
- The target: 7,840.00, the high between the two lows. That is 28 points, or $1,400 per ES contract, a little over 2 to 1 against the risk.
If ES had kept falling and NQ had followed it to a lower low, the divergence would be gone. The stop under the sweep low is there for exactly that case.
Bullish SMT on EUR/USD and DXY
The same logic works with the inverse pair. Say EUR/USD falls to a lower low while DXY makes a lower high instead of a higher high (illustrative, no real prices). The dollar is not confirming the euro's weakness, so traders watch for a bullish turn in EUR/USD.
Order flow
Built for scalpers. Heatmaps on dedicated resources.
Order-flow heatmaps and DOM ladders run on dedicated CPU, memory and NVMe, so your charts keep responding during volatility.
See the dedicated hardwareFrom $29.99/mo · Windows or Linux
Common SMT Divergence Mistakes
Most SMT mistakes come from comparing swings that do not match, or from treating the divergence as an entry. These are the ones traders mention most.
- Comparing different swings. A high at 10:00 on one chart and 10:45 on the other is not a divergence.
- Mixing timeframes. A 5-minute swing on ES and a 15-minute swing on NQ will disagree often and mean little.
- Ignoring the roll. Comparing an expiring contract with a new front month creates swings that are not real.
- Entering on the divergence alone. Without a shift in structure, the lagging market often just catches up.
- Reading thin hours. Swings in quiet overnight trading are easy to misread. CME equity index futures trade Sunday 6:00 p.m. to Friday 5:00 p.m. ET, with a daily break from 5:00 to 6:00 p.m. ET.
Which Timeframes to Use
SMT appears on every timeframe, but traders give higher timeframes more weight and use lower ones to time entries. A common approach is to find the divergence on a 15-minute to 1-hour chart and refine the entry on a 1-minute to 5-minute chart.
Whatever you choose, use the same timeframe on both markets. If a divergence on the 1-minute chart disappears on the 5-minute chart, it is a weak one.
Limits of SMT Divergence
SMT divergence shows disagreement between markets; it does not tell you when, or whether, price will turn. There is no published success rate, and many divergences end with the lagging market simply catching up.
- Correlation is not fixed. ES and NQ can split for days when large technology stocks move on their own news.
- Hindsight is easy. Divergences look obvious on a finished chart; live, the second swing is not done until price turns.
- News moves both. Around major data releases, both markets can run through their highs and lows together.
- It is a discretionary read. Two traders can mark different swings on the same chart and reach different answers.
Test any SMT rule on past charts and in a simulator before you risk money on it, and size each trade so a failed divergence is a small loss.
If you run alerts or an automated strategy that watches two markets for divergence, a trading VPS keeps both data feeds and the platform running when your own computer is off.
FAQs
What does SMT stand for in trading?
SMT is usually expanded as "smart money technique". In ICT trading it describes divergence between correlated markets, such as ES and NQ, at a swing high or low.
Is there a reliable SMT divergence indicator?
Community scripts on charting platforms mark SMT divergence automatically, but each defines swings differently and most mark a swing only after several bars have closed. Use one as a scanner, then check the swings yourself.
Which market do you trade after an SMT divergence?
Traders differ. Some trade the market that swept the high or low, because the stop can sit just beyond the sweep. Others trade the market that held, because it showed relative strength. Pick one rule and test it.
Is SMT divergence the same as RSI divergence?
No. RSI divergence compares price with an indicator on one chart. SMT divergence compares price on two correlated markets.
Does SMT divergence work on forex?
Traders use it on forex too. A common pairing is EUR/USD against DXY, which usually move in opposite directions because the euro is 57.6% of the dollar index. EUR/USD and GBP/USD are also compared as a positive pair.


