
On-balance volume (OBV) is a running total of volume: it adds a bar's volume when the close is above the prior close and subtracts it when the close is below. Traders watch the direction of the OBV line, not its value, to confirm a price trend or to spot a divergence that can come before a reversal. Joe Granville introduced OBV in his 1963 book Granville's New Key to Stock Market Profits.
Key points:
- Formula: up close, add the volume; down close, subtract it; unchanged close, OBV stays the same.
- What it measures: buying pressure when volume on up bars outpaces volume on down bars, and selling pressure when the reverse is true.
- How to read it: the number itself does not matter. Compare the slope, highs and lows of the OBV line with those of price.
- How traders use it: to confirm trends and breakouts, and to flag divergences. StockCharts calls it "not a standalone indicator".
How the OBV Indicator Is Calculated
OBV needs only two inputs per bar: the closing price and the volume. StockCharts ChartSchool and the TradingView Help Center publish the same three rules.
| If the close is | Then | Formula |
|---|---|---|
| Above the prior close | Add this bar's volume | Current OBV = Previous OBV + Current Volume |
| Below the prior close | Subtract this bar's volume | Current OBV = Previous OBV − Current Volume |
| Equal to the prior close | No change | Current OBV = Previous OBV |
Because OBV has to start somewhere, the first value is simply the first bar's positive or negative volume. Every later value builds on it, so two charts that start on different dates show different OBV numbers for the same day. That is why StockCharts says the scale of OBV "is not relevant".
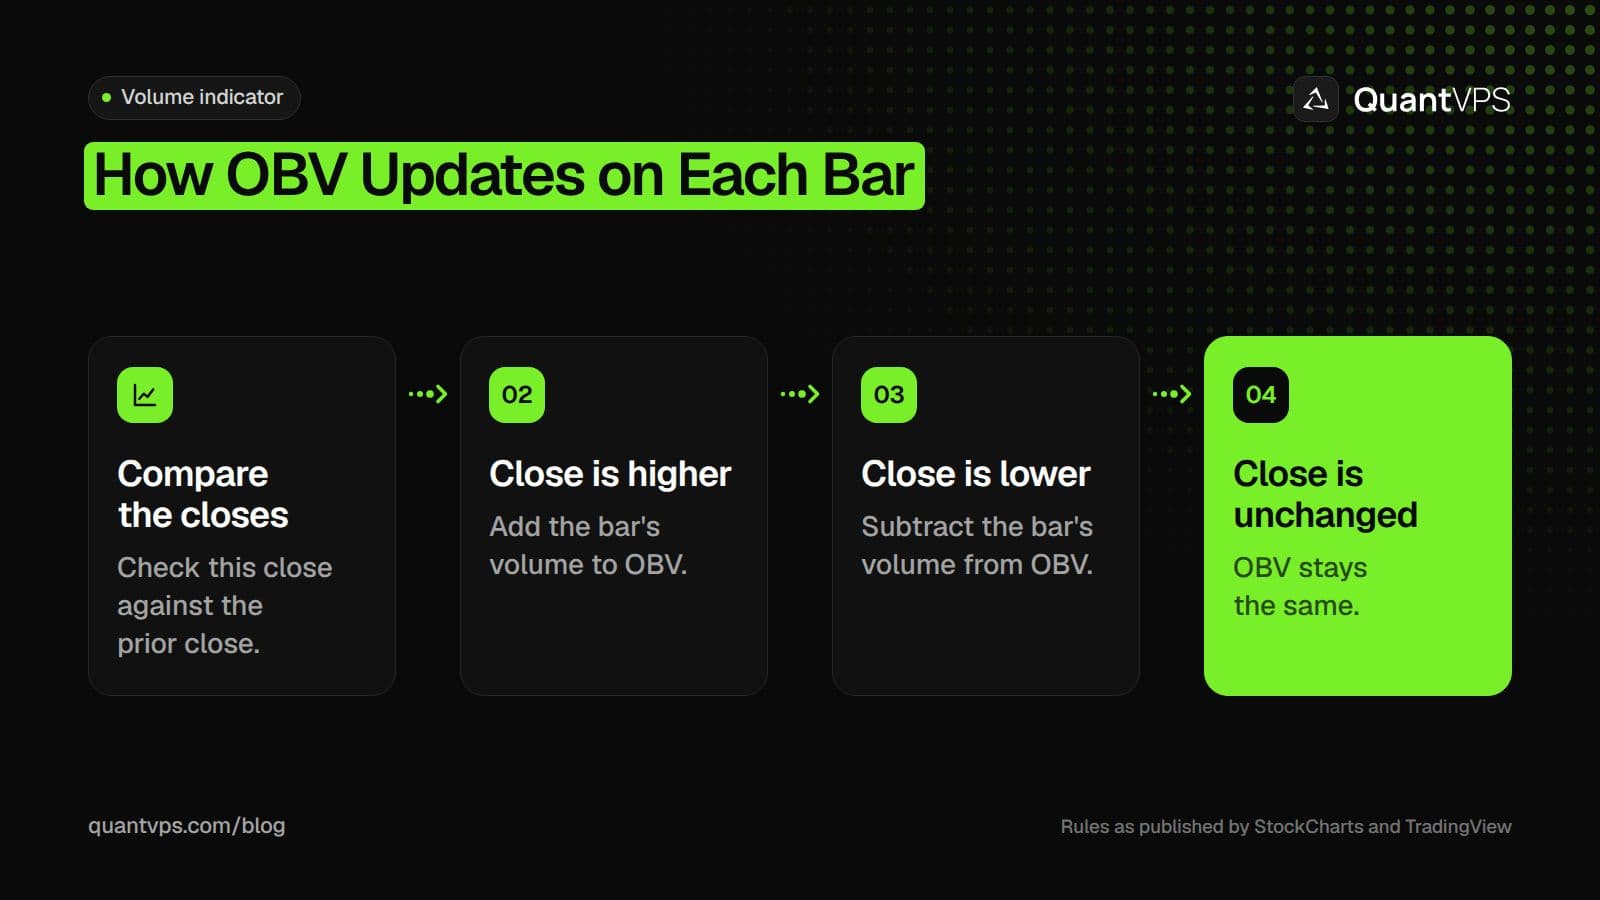
OBV only ever adds, subtracts or holds a bar's full volume, based on the close.
The table below walks through five bars. The prices and volumes are made up to show the arithmetic; they are not market data.
| Bar | Close | Versus prior close | Volume | OBV |
|---|---|---|---|---|
| 1 | 100.00 | Start | 1,000 | 1,000 |
| 2 | 101.00 | Higher | 1,500 | 2,500 |
| 3 | 100.50 | Lower | 800 | 1,700 |
| 4 | 100.50 | Unchanged | 600 | 1,700 |
| 5 | 102.00 | Higher | 2,000 | 3,700 |
Notice that bar 3 fell only 0.50 but OBV still lost the full 800. OBV ignores the size of the price move and counts the whole bar's volume as buying or selling.
Uptime
99.999% uptime. Built for 24/7 trading reliability.
Your VPS runs in Tier IV datacenters with redundant power and network, monitored 24/7 on site.
See the uptime SLA





From $29.99/mo · Windows or Linux
How to Read OBV
Read OBV by its direction and its turning points. A rising OBV line means volume on up bars is beating volume on down bars; a falling line means the opposite.
StockCharts suggests a three-step reading:
- Define the OBV trend. Is the line making higher highs and higher lows, lower highs and lower lows, or moving sideways?
- Compare it with price. If both trend the same way, OBV confirms the move. If they disagree, you have a divergence.
- Mark support and resistance on OBV. When the OBV line breaks a level it has held, its trend has changed, and that break can be used as a signal.
Granville's idea was that volume precedes price. StockCharts puts it this way: "Expect prices to move higher if OBV is rising while prices are either flat or moving down." A rising OBV inside a sideways range is read as accumulation.
Two cautions come with every reading. OBV uses closing prices, so judge divergences and breaks on closes, not intrabar highs and lows. A single volume spike can also throw the line off and needs time to settle.
OBV Divergence
An OBV divergence is when price and OBV move in different directions, which can warn that the price trend is losing support. StockCharts defines both kinds.
- Bullish divergence: OBV moves higher or forms a higher low while price moves lower or makes a lower low.
- Bearish divergence: OBV moves lower or forms a lower low while price moves higher or makes a higher high.
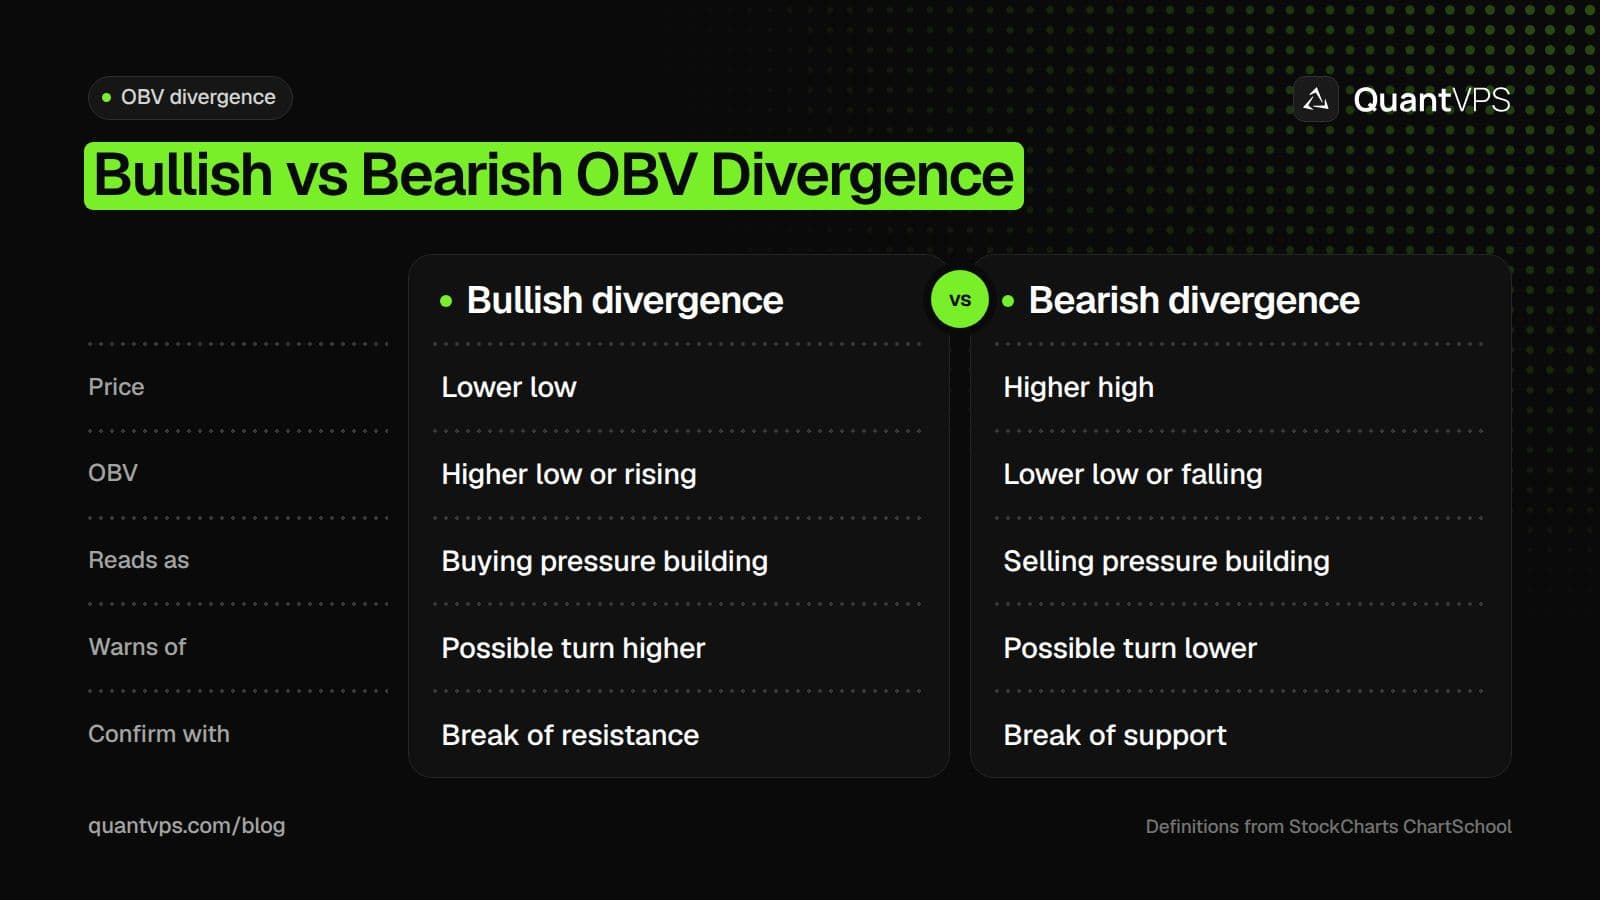
A divergence is a warning, not a signal on its own: wait for price to confirm it.
A divergence says a reversal "could be in the making", not that one will happen. Prices can keep trending while OBV disagrees, sometimes for a long time. Most traders wait for price to break its own trend line, support or resistance before acting.
How to Trade With OBV
Traders use OBV in three ways: to confirm a trend, to confirm a breakout, and to flag a possible reversal. In each case OBV supports a decision made from price, rather than making it.
| Use | What you look for | What would confirm it |
|---|---|---|
| Trend confirmation | OBV trending the same way as price | Price and OBV both making new highs (or lows) |
| Breakout confirmation | OBV breaking its own resistance or support | Price breaking the matching level on a close |
| Reversal warning | A bullish or bearish divergence | A break of the price trend line or a key level |
| Accumulation in a range | OBV rising while price moves sideways | Price leaving the range to the upside |
A simple routine looks like this:
- Add OBV below the price chart, or behind it so the two lines are easy to compare.
- Add a moving average to OBV if the raw line is noisy. StockCharts' own example chart smooths OBV with a 20-day EMA.
- Note whether OBV is above or below that average, and whether its last swing high or low has broken.
- Act only when the price chart agrees, and set your stop from price, not from OBV.
StockCharts' sample scans use the same idea: a potential bullish divergence is a stock below its 20 and 65-day moving averages while OBV sits above its own 20 and 65-day signal lines. It also recommends pairing OBV with chart patterns or momentum oscillators.
Using OBV on Futures and Intraday Charts
OBV works on any chart that has volume, including futures and intraday bars, because the rule only compares one close with the last. On a 5-minute chart, each 5-minute bar's volume is added or subtracted.
Two details matter more on futures charts. Each contract month has its own volume, so check whether your chart shows a single month or a continuous series that switches months at each rollover. OBV also counts all volume on a bar as buying or selling, so it is a much coarser tool than order flow.
StockCharts adds a note for scans: daily volume is incomplete during the trading day. If you scan or alert on daily OBV, base it on the last market close.
OBV vs Cumulative Volume Delta and Other Volume Tools
OBV splits volume by the close of each bar, while order flow tools split it trade by trade. That makes OBV available on almost any chart, but blunter than tools that read the bid and ask.
| Tool | What it counts | Data it needs | Best for |
|---|---|---|---|
| On-balance volume (OBV) | Whole bar volume, signed by the close | Close and volume per bar | Trend and divergence on any timeframe |
| Cumulative volume delta | Trades at the ask minus trades at the bid, summed | Tick data with bid and ask | Who is aggressing inside each bar |
| Footprint chart | Volume traded at each price inside a bar | Tick data with bid and ask | Absorption and imbalances at levels |
If you want to see who is buying and selling inside each bar, our guide to cumulative volume delta shows how CVD is built trade by trade. For the bigger picture, start with our introduction to order flow. To compare platforms that draw these charts, see our roundup of footprint chart software.
Order flow
Built for scalpers. Heatmaps on dedicated resources.
Order-flow heatmaps and DOM ladders run on dedicated CPU, memory and NVMe, so your charts keep responding during volatility.
See the dedicated hardwareFrom $29.99/mo · Windows or Linux
How to Add OBV in TradingView, NinjaTrader and Code
Most charting platforms include OBV as a built-in indicator, so you rarely need to code it. TradingView lists On Balance Volume in its indicator library, with optional smoothing inputs described in its Help Center.
In Pine Script, ta.obv is a built-in variable. This is the example from TradingView's Pine Script v6 reference, including the manual version:
//@version=6
indicator("On Balance Volume")
plot(ta.obv, color=color.yellow)

// the same on pine
f_obv() =>
    ta.cum(math.sign(ta.change(close)) * volume)
NinjaTrader 8 has an OBV() system indicator method. This example is from the NinjaScript help guide:
// Prints the current value of OBV
double value = OBV()[0];
Print("The current OBV value is " + value.ToString());
Limitations of OBV
OBV is simple, and that simplicity is also its main weakness. Keep these limits in mind:
- All or nothing: a bar that closes one tick higher adds its full volume, even if most of that volume traded on the way down.
- Spikes distort it: one heavy bar, such as a news release, can shift the line for a long time.
- The value is arbitrary: the number depends on where the chart starts, so compare shape, not level.
- Theory, not law: "volume precedes price" is Granville's theory. Divergences can fail.
Running OBV Alerts and Strategies Around the Clock
OBV signals on futures can form at any hour of the session, and a strategy or alert in a desktop platform only works while that platform is open. Running NinjaTrader, MultiCharts or your own script on a trading VPS keeps it connected while your own PC is off. QuantVPS servers in Chicago list 0.52ms to CME.
FAQs
What does OBV tell you?
OBV tells you whether volume is heavier on up bars or down bars. A rising line means buying pressure is stronger, a falling line means selling pressure is stronger. Comparing it with price shows whether volume confirms the trend.
Is OBV a leading or lagging indicator?
OBV is built from past closes and volume, but Granville designed it on the idea that volume moves before price. Divergences are the part traders treat as leading, and they need price to confirm them.
What are the best OBV settings?
OBV has no length setting: StockCharts notes the indicator "does not have any parameters". Many traders add a moving average to the OBV line, and StockCharts' example uses a 20-day EMA.
What is the difference between OBV and CVD?
OBV signs each bar's whole volume by its close. CVD adds trades at the ask and subtracts trades at the bid, trade by trade, so it needs tick data and shows aggression inside each bar.
Does OBV work for day trading futures?
Yes, on any intraday chart with volume. Check whether the chart uses one contract month or a continuous series, and read OBV together with price levels rather than on its own.


