
Financial engineering uses math, statistics, computer science, and financial theory to solve complex financial problems. It focuses on data-driven methods to manage risk, price derivatives, and create trading systems. Unlike traditional finance, decisions rely on models and mathematical proofs rather than qualitative insights.
Key highlights:
- Core Tools: Stochastic calculus, Monte Carlo simulations, Python (NumPy, pandas), and C++ for high-speed trading.
- Applications: Derivatives pricing, algorithmic trading, and portfolio optimization.
- Careers: Quant researchers, traders, developers, and risk managers, with salaries often exceeding $300,000 annually.
- Infrastructure Needs: Reliable VPS hosting and low-latency systems are critical for live trading.
This field bridges theoretical models with practical tools to navigate today’s fast-paced financial markets.
Core Tools and Concepts in Financial Engineering
Key Mathematical and Statistical Tools
Mathematics forms the backbone of financial engineering. At its heart lies stochastic calculus, with concepts like Brownian motion and Itô's Lemma playing a crucial role in modeling the random movement of asset prices over time. These tools are foundational for pricing options, interest rate derivatives, and other complex financial instruments.
When closed-form solutions aren't available, numerical methods step in. Techniques like Monte Carlo simulations, finite difference methods, and binomial trees are commonly used for valuing path-dependent options, solving partial differential equations, or pricing American-style contracts. Root-finding algorithms are another critical component for estimating parameters such as implied volatility or yield-to-maturity. For instance, Newton-Raphson converges far faster - about 6.5 times quicker - than the Bisection method, typically solving bond-related calculations in just 4–6 iterations compared to 25–30. High-frequency trading algorithms power these systems, executing them thousands of times per second to update metrics like volatility estimates.
"The derivative tells us not just where the function is, but where it's going." - Michael Brenndoerfer
For production systems, Brent's Method offers a reliable hybrid approach by combining bisection, secant, and inverse quadratic interpolation. This method is particularly effective when initial guesses are uncertain, balancing speed and accuracy.
These mathematical and statistical tools are brought to life through specialized programming environments.
Programming Languages and Libraries
When it comes to financial engineering, Python is a standout, largely due to its extensive ecosystem of libraries. NumPy and SciPy handle heavy lifting in vectorized math and linear algebra, while pandas excels in managing time-series data. For derivative pricing, PyFENG offers pre-built models like Black-Scholes-Merton, SABR, and Heston. Leveraging NumPy's vectorization instead of standard loops can dramatically speed up processing - an essential practice for large-scale backtesting.
For tasks where latency is critical, such as high-frequency trading strategies, C++ is the go-to choice. It powers tools like QuantLib, a leading open-source library for pricing complex derivatives. QuantLib also integrates with Python, R, Java, and C#, making it versatile. To bridge the speed gap between Python and C++, tools like FinancePy use Numba to compile Python code into near-C++ speeds while retaining readability.
Here’s a quick overview of programming languages and their use cases in financial engineering:
| Language | Primary Use Case | Key Libraries/Tools |
|---|---|---|
| Python | Research, backtesting, data analysis | NumPy, pandas, PyFENG, Zipline, vectorbt |
| C++ | Low-latency execution, HFT systems | QuantLib, NexusFix |
| R | Statistical modeling, econometrics | quantmod, xts, data.table |
| Julia | High-performance numerical computing | - |
Mastering these tools goes hand in hand with understanding the financial theories that underpin them.
Financial Theory and Market Knowledge
Mathematical tools and programming skills alone aren't enough. A deep understanding of financial theory ensures that models are more than just black boxes - they become reliable frameworks for decision-making. Two key principles form the foundation of financial engineering: the no-arbitrage condition and risk-neutral valuation.
Run 24/7 while you sleep. Keep bots, platforms, and trade copiers online on a dedicated VPS.
Low-latency VPS hosting for your trading platform.
From $59.99/mo
"Two portfolios that have identical payoffs in all future states of the world must have the same price today." - Michael Brenndoerfer
Risk-neutral valuation allows engineers to price derivatives by discounting expected payoffs at the risk-free rate under the Q-measure (an artificial probability measure), bypassing the need to estimate real-world probabilities. This approach is what makes models like Black-Scholes practical for real-world use.
Beyond pricing, portfolio theory is essential for strategy development. Techniques like mean-variance analysis and the efficient frontier help balance risk and return across a portfolio. However, theory must always be tested against market conditions. For example, Black-Scholes assumes constant volatility and log-normal returns, but real markets often show fat tails, volatility smiles, and jump risks. Knowing where a model's assumptions fail is just as important as knowing how to build it.
Practical Infrastructure and Tools for Financial Engineers
Quantitative Platforms and Software
When it comes to financial engineering, having the right tools is just as important as mastering the math and coding. Platforms like JupyterLab and Jupyter Notebooks have become go-to options for iterative research. These tools let you write code, visualize data, and document your process all in one place, making them indispensable for model development. Another favorite among professionals is VS Code, particularly for those working with cloud-based backtesting setups.
For algorithmic trading, QuantConnect's LEAN engine stands out. This open-source framework supports everything from research and backtesting to live deployment across multiple asset classes like equities, forex, and crypto. Since its launch in 2015, LEAN has powered over 375,000 live algorithms and handles an impressive $45 billion in notional trading volume every month.
"LEAN is the world's leading open-source quantitative trading technology. Research, backtest, optimize, and then live-trade on hundreds of venues." - QuantConnect
To ensure consistency across systems, many engineers use Dockerized environments, such as Jupyter-Quant. These setups help maintain stable dependencies and streamline workflows.
This infrastructure forms the backbone for effective data management and realistic simulations, which are essential for refining financial models.
Data and Backtesting Frameworks
Once the right platforms are in place, the next step is handling data and building robust backtesting frameworks. Interestingly, financial engineers often spend about 80% of their time on data preparation, leaving only 20% for actual research. This highlights how critical data wrangling is for success.
Backtesting frameworks are vital for validating trading strategies. Depending on the type of strategy you're testing, you might choose between vectorized engines or event-driven engines:
| Type | Speed | Best For | Examples |
|---|---|---|---|
| Vectorized | Very fast | Signal research, factor analysis | Moonshot, wraquant |
| Event-Driven | Slower | Complex orders, path-dependent logic | Zipline, LEAN |
Regardless of the framework, two things are non-negotiable: using point-in-time data to avoid look-ahead bias and incorporating realistic cost modeling. This includes accounting for commissions, slippage, and funding fees, which can significantly impact strategy performance.
Trading VPS Hosting for Live Deployment
After backtesting proves a strategy's reliability, the next step is live deployment. This requires specialized servers designed for low-latency trading. Running algorithms on personal hardware can lead to risks like power outages, internet issues, or high latency, which can result in missed trades or unexpected losses.
"Running a high-frequency arbitrage bot on a personal laptop or a standard home internet connection is like testing a Formula 1 engine in a suburban parking lot." - Jay J., Quantitative Researcher, Nova Quant Lab
A trading VPS solves these problems by providing enterprise-grade hardware that runs algorithms continuously. Co-locating servers near an exchange's matching engine is particularly important, as it reduces network latency. For example, QuantVPS operates out of a Chicago data center, achieving a latency of just 0.52ms to the CME Group exchange. This proximity improves order execution quality and reduces slippage for futures trades.
"Orders transmit directly to the CME Group exchange, minimizing delays and reducing slippage for optimal futures trade execution." - QuantVPS
QuantVPS offers a range of plans, from basic setups (4 cores, 8GB RAM, 70GB NVMe at $59.99/month) to high-performance dedicated servers (16+ cores, 128GB RAM, 2TB+ NVMe at $299.99/month). These plans come with 99.999% uptime and unmetered bandwidth, ensuring reliability. For most quantitative strategies, VPS Pro or Ultra plans are sufficient, as live trading typically requires only 512MB to 4GB of RAM. However, backtesting environments usually demand much more.
Before committing real capital, it's crucial to stress test your deployment. Restart your algorithm during market hours, conduct paper trading in a demo environment, and verify that your system can recover smoothly from API disconnections. This ensures you're prepared for real-world trading conditions.
Careers in Financial Engineering
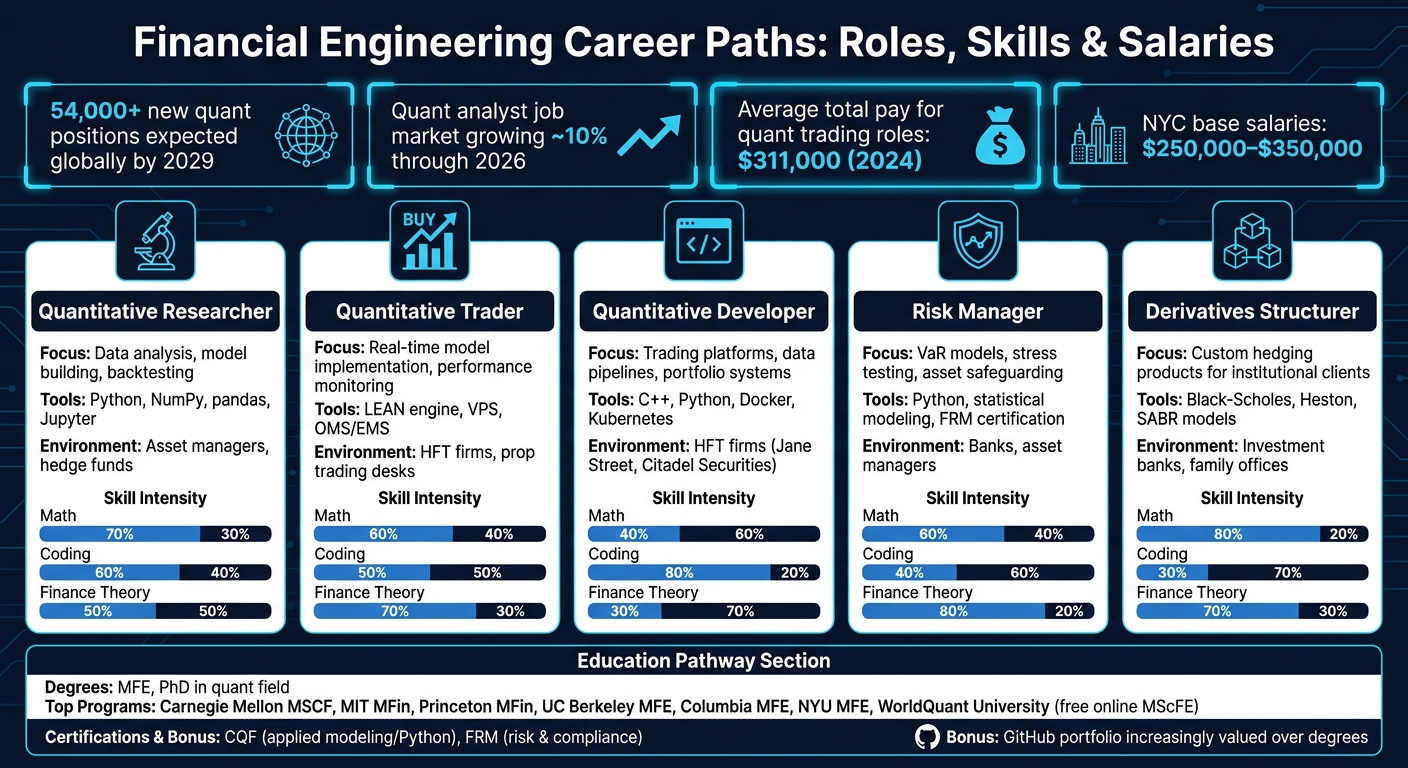
Financial Engineering Career Paths: Roles, Skills & Salaries
Common Career Paths
Financial engineering opens doors to a variety of roles, from data-driven research to building high-performance systems. Quantitative researchers focus on analyzing data, creating models, and running backtests to uncover market opportunities. Quantitative traders implement these models in real-time, monitor their performance, and adjust them as market dynamics shift. Meanwhile, quantitative developers handle the technical backbone, building trading platforms, data pipelines, and portfolio systems to ensure smooth operations.
Other roles include risk managers, who design Value at Risk (VaR) models and conduct stress tests to safeguard assets, and derivatives structurers, who craft custom hedging products for institutional clients by blending pricing models with regulatory expertise.
The demand for these roles is growing rapidly. By 2029, more than 54,000 new quantitative positions are expected globally. The quant analyst job market is also set to expand by nearly 10% through 2026. Compensation in these fields reflects their complexity: quantitative trading roles offer an average total pay of $311,000 in 2024, with base salaries in New York City ranging from $250,000 to $350,000. These jobs require a mix of advanced quantitative skills and technical know-how, which we'll explore in the next section.
Skills and Education Required
A strong mathematics background is non-negotiable. Skills like stochastic calculus, linear algebra, probability, and numerical methods are vital for modeling markets and pricing derivatives. On the technical side, Python is the go-to language for research and data analysis, while C++ is indispensable for low-latency systems where speed is critical.
Most professionals in this field come from STEM disciplines like mathematics, physics, computer science, or engineering. Advanced roles often require a Master of Financial Engineering (MFE) or a PhD in a quantitative field. Leading programs include Carnegie Mellon's MSCF, MIT and Princeton's MFin, and MFE programs at UC Berkeley, Columbia, and NYU. For those seeking a flexible option, WorldQuant University offers a tuition-free MScFE program entirely online.
Certifications also play a key role. The CQF (Certificate in Quantitative Finance) is ideal for those focusing on applied modeling and Python-based roles, while the FRM (Financial Risk Manager) is better suited for regulatory risk and compliance positions. Employers increasingly value a strong GitHub portfolio showcasing projects like an options pricer, backtesting framework, or risk dashboard, sometimes even more than a prestigious degree.
"Most successful quant researchers join an established team, learn the existing approach, and make incremental improvements." - Giuseppe Paleologo, Head of Quantitative Research, Balyasny
Stay online and closer to execution. Choose a VPS location for CME futures, New York markets, London FX, API trading, and more.
Host your platform near the market route that matters.
From $59.99/mo
This combination of education, certifications, and hands-on experience equips professionals for the dynamic environments described below.
Work Environments and Tools Used
The work environment for financial engineers varies significantly depending on the type of firm. High-frequency trading (HFT) firms, such as Jane Street and Citadel Securities, operate in fast-paced settings where microseconds matter. Engineers here focus on building ultra-low-latency C++ systems and fine-tuning execution strategies. On the other hand, asset managers and family offices emphasize long-term forecasting and capital preservation, relying heavily on Python for research and portfolio management.
Key tools for financial engineers include Python libraries like Pandas and NumPy for data analysis, Jupyter Notebooks for interactive workflows, and SQL for managing large datasets. Backtesting frameworks, such as Zipline or custom-built engines, are essential for testing strategies. For production systems, tools like Docker and Kubernetes handle deployment, while Prometheus and Grafana are used for monitoring. In live trading, low-latency VPS hosting ensures uptime and reduces latency during market hours.
Major hiring hubs for these roles in the U.S. are concentrated in Chicago and New York City, reflecting the industry's geographic focus.
How Financial Engineering Is Applied in Practice
The real-world use of financial engineering takes theoretical models and turns them into actionable strategies for trading, risk management, and portfolio optimization.
Derivatives Pricing and Risk Management
Pricing complex derivatives requires more than basic models. While the Black-Scholes model is effective for simple European options, actual markets are far more intricate. To address this complexity, professionals often use advanced models like Heston (stochastic volatility), SABR (volatility smile), and Dupire (local volatility) to handle scenarios that Black-Scholes cannot account for.
For exotic options, Monte Carlo simulations are a go-to tool for managing path-dependent payoffs. These simulations can process massive datasets quickly; for example, modern implementations can analyze 200,000 paths with 95% confidence intervals in just 0.002 seconds for standard European options. Techniques such as variance reduction improve precision further. In July 2025, the DerivFlow Finance platform demonstrated a 1,496x improvement in variance reduction for an Arithmetic Asian Call using control variates, achieving a price of $1.7799 with a minimal standard error of ±$0.0004.
Risk management relies heavily on calculating sensitivities, known as the "Greeks." Instead of recalculating each sensitivity individually - a time-consuming process - Adjoint Algorithmic Differentiation (AAD) computes all sensitivities in a single backward pass. This method is both efficient and cost-effective.
"AAD replaces [bumping] with a single backward sweep over the Crank-Nicolson computational graph, computing all parametric sensitivities simultaneously in... the same cost as one forward solve." - NablaQuant Documentation
Algorithmic Trading and Order Execution
Creating an algorithmic trading system involves more than just building a profitable signal. A full trading pipeline typically includes data ingestion → signal generation (alpha modeling) → risk management → execution. Each stage introduces challenges that backtests often fail to capture.
Slippage and order delays can significantly impact performance. For instance, a mean-reversion strategy that showed a 12% annual return during backtesting dropped to just 3% in live paper trading once slippage and delays were factored in. To mitigate these issues, it's crucial to conduct walk-forward validation and at least 30 days of paper trading before going live. This transition from simulated to live trading is often where strategies are truly tested.
"The gap between backtest and live performance is where most engineers lose money - and where the real learning happens." - Max L, Finance & Trading Engineer
For live trading, Order Management Systems (OMS) ensure compliance and track positions, while Execution Management Systems (EMS) handle smart order routing. Engineers use multicast data feeds (e.g., CME MDP) and cross-region synchronization to minimize the delay between signal generation and order execution. Low-latency VPS hosting is also critical for uninterrupted operations.
While trading execution focuses on real-time decisions, portfolio optimization bridges theoretical models with strategic allocation.
Portfolio Optimization and Strategy Development
Portfolio optimization is where quantitative tools meet practical constraints. Modern Portfolio Theory (MPT) helps identify asset combinations that balance risk and return. However, pure Markowitz optimization often results in portfolios with extreme, concentrated allocations.
The Black-Litterman model addresses this issue by starting with market-cap-weighted equilibrium returns and adjusting them using Bayesian methods to reflect specific investor views. This approach produces more stable and diversified portfolios. For situations where return distributions are non-normal, Mean-CVaR optimization is used to directly manage tail risks.
Advances in computational power are transforming this field. NVIDIA's cuOpt solvers, for example, have achieved up to 160x speedups for large-scale, scenario-based Mean-CVaR optimization compared to CPU-based solvers. This leap in speed allows portfolio rebalancing to shift from slow overnight processes to near-real-time adjustments. When paired with regime detection techniques like Hidden Markov Models, engineers can dynamically adjust portfolio weights based on whether the market is in a bull or bear phase, avoiding the limitations of quarterly reviews.
Conclusion and Key Takeaways
Financial engineering takes complex mathematical concepts and turns them into practical tools for navigating the markets. By merging stochastic calculus, programming languages like Python and C++, and economic principles, it tackles challenges that conventional financial tools can't handle. Whether it's pricing exotic derivatives using Monte Carlo simulations or implementing dynamic portfolio rebalancing, this field is where theoretical precision meets real-world application. It's the backbone of the advanced trading systems we've explored.
Interestingly, only about 10% of strategies make it through the gauntlet of out-of-sample testing and live trading. The main hurdle isn't usually the math - it’s the engineering. Unaccounted-for factors like slippage, spreads, and execution delays can erode a strategy’s performance. For instance, a backtested Sharpe ratio of 2.0 can drop to 0.8 in live markets if infrastructure introduces just 5–10 basis points of friction.
"The edge belongs to systematic traders who have invested in robust, well-tested infrastructure." - Viprasol Tech Team
Algorithmic trading now dominates the majority of trading activity on major global exchanges. This makes having a strong infrastructure a must, not a luxury. QuantVPS addresses these needs with ultra-low latency of under 0.52ms to CME Group through its Chicago-based data centers, boasting 99.999% uptime and compatibility with major trading platforms. Starting at $41.99 per month (annual billing), it offers professional-grade tools even for traders who are still scaling their strategies.
Throughout this guide, we've underscored the importance of advanced quantitative tools and reliable infrastructure. Whether you're crafting your first options pricing model or managing a sophisticated multi-asset execution system, the core principles remain the same: solid mathematics, clean and efficient code, realistic cost assessments, and infrastructure that can handle the demands of live markets.
FAQs
What’s the difference between financial engineering and traditional finance?
Financial engineering applies advanced mathematics, programming, and statistical techniques to tackle complex financial challenges. In contrast, traditional finance leans on established theories, qualitative analysis, and historical data to guide decision-making. While traditional finance prioritizes intuition and fundamental analysis, financial engineering focuses on building models, algorithms, and systems for tasks such as pricing derivatives, managing risk, and designing new financial products.
Do I need a Master’s or PhD to work as a quant?
A master’s or PhD isn’t always a must-have for becoming a quant, though these advanced degrees can definitely open doors to better opportunities and higher salaries. Many quants pursue master’s programs in areas like mathematics or financial engineering, and PhDs are often seen in elite positions. That said, having strong programming abilities, solid statistical knowledge, and hands-on experience can sometimes make up for the lack of formal advanced degrees - particularly in fintech and crypto industries.
Why does live trading need low-latency VPS hosting?
Live trading thrives on low-latency VPS hosting to ensure trades are executed swiftly and precisely in rapidly changing markets. By minimizing delays in order transmission, low latency helps cut down on slippage, which can directly impact profitability. This is especially crucial for strategies like high-frequency trading, scalping, or algorithmic trading, where even fractions of a second can make a difference. On top of that, a dependable low-latency VPS keeps performance steady during volatile market swings or significant events, giving traders an edge when it matters most.


