
On this page
Resource Monitor is a built-in Windows tool that provides real-time visibility into CPU, memory (RAM), disk, and network usage. It's especially useful for identifying performance bottlenecks or troubleshooting system issues, particularly when running trading platforms like NinjaTrader 8 or automated strategies on your VPS.
How to Open Resource Monitor
You can access Resource Monitor in several ways:
From the Start Menu:
- Click the Start button.
- Type Resource Monitor in the search bar.
- Click the result to open the tool.
Using the Run Command:
- Press Win + R to open the Run dialog.
- Type resmon.exe and hit Enter.
From Task Manager:
- Press Ctrl + Shift + Esc to launch Task Manager.
- Go to the Performance tab.
- Click Open Resource Monitor at the bottom.
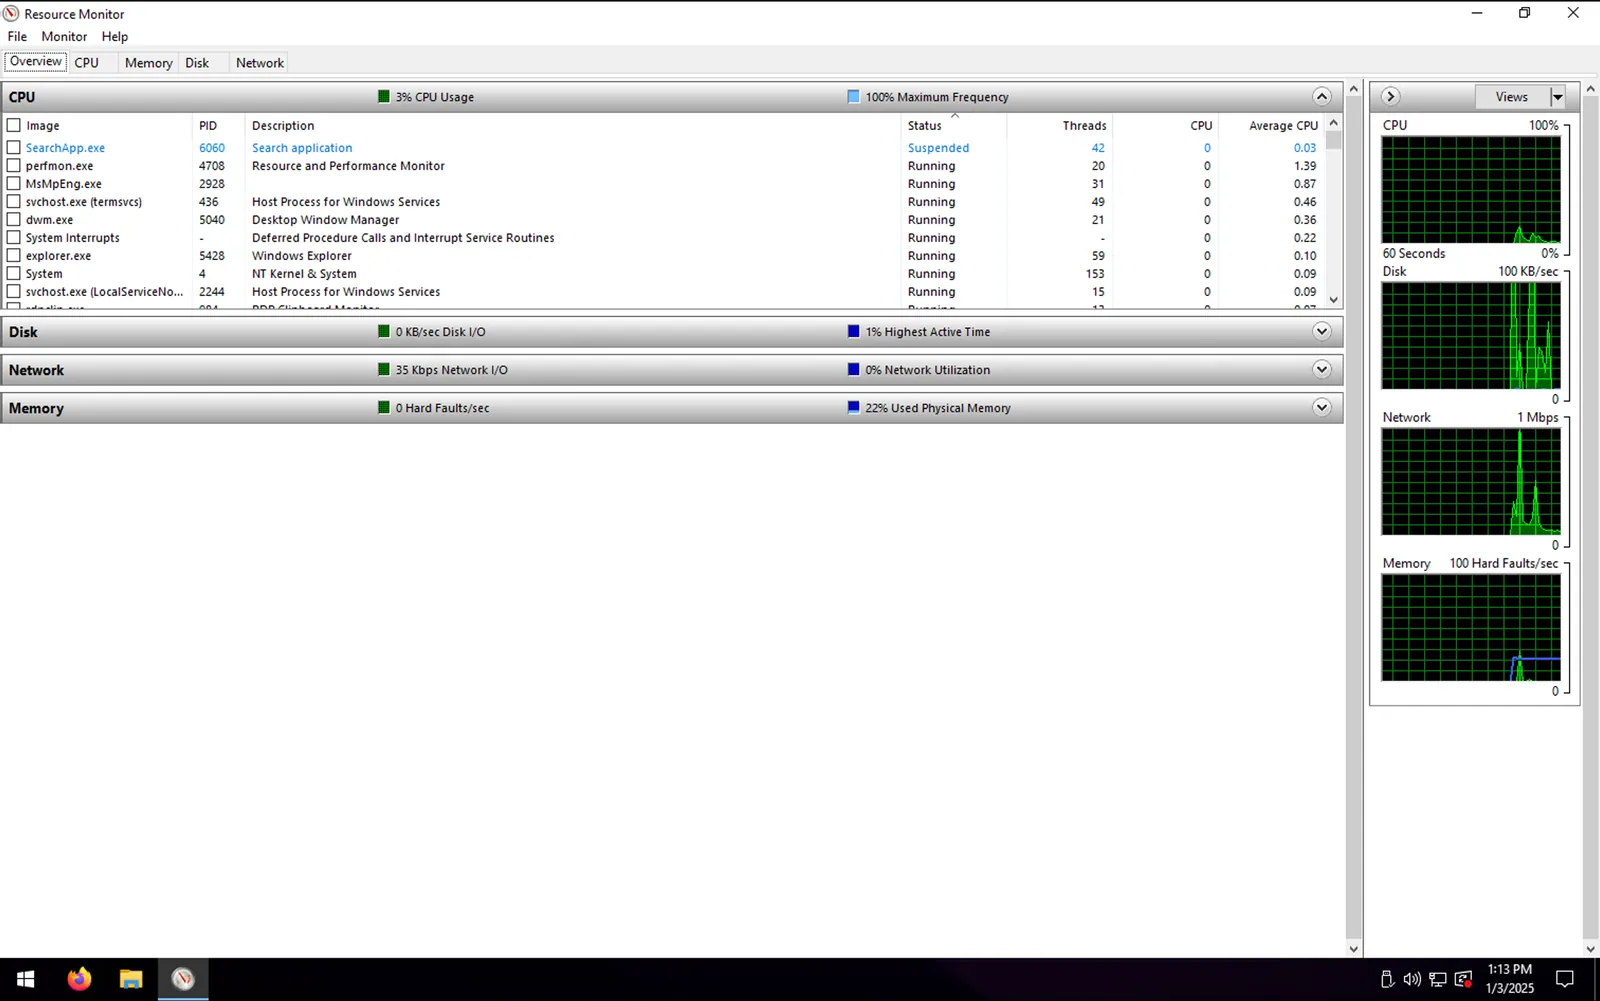
Key Resource Monitor Tabs & What They Do
Once open, Resource Monitor gives you access to several powerful monitoring views:
Overview
- Displays a summary of your system's current CPU, disk, memory, and network usage.
CPU
- Lists active processes and services, including associated handles and modules.
- Helps you identify which processes are consuming high CPU resources.
Memory
- Shows how much RAM each process is using.
- Useful for spotting memory leaks or identifying heavy memory consumers.
Disk
- Tracks disk activity by process, including read/write activity and storage load.
- Helps identify disk-intensive programs slowing your system down.
Network
- Displays active network usage, TCP connections, and listening ports.
- Useful for identifying processes using significant bandwidth.
Why It Matters for Traders
If you're running NinjaTrader 8, Rithmic, or other trading tools on your VPS, Resource Monitor is a valuable diagnostic tool. It shows whether high CPU or memory use is slowing down your platforms or automated strategies.
Need Assistance?
Our support team is available 24/7. If you have any questions or run into issues, open a support ticket from your QuantVPS dashboard and we'll get back to you as quickly as possible.