
Risk management is the cornerstone of successful trading. Without it, even the best strategies can fail. Here's what you need to know:
- Position Sizing: Limit risk per trade to 1-2% of your account. This protects capital during losing streaks and helps you stay in the game longer.
- Drawdowns: Keep losses manageable. A 50% drawdown requires a 100% gain to recover. Use stop-losses, adjust trade sizes, and take breaks after consecutive losses.
- Capital Protection: Treat your account like a resource to safeguard, not gamble. Limit total portfolio risk (4-8%) and avoid overexposure to correlated trades.
Tools like automated calculators, server-side stops, and low-latency VPS platforms ensure consistent execution and help enforce discipline. Trading isn’t about predicting markets - it’s about surviving losses and growing steadily.
Position Sizing Methods for Risk Control
Trading Risk Management: Position Sizing Methods Comparison Chart
Position sizing is a cornerstone of risk management, helping traders manage losses and protect their capital. It's about determining how much of your account to risk on any given trade, based on your overall account size and personal risk tolerance. In trading, poor position sizing is one of the most common reasons for failure - 90% of traders fall victim to it.
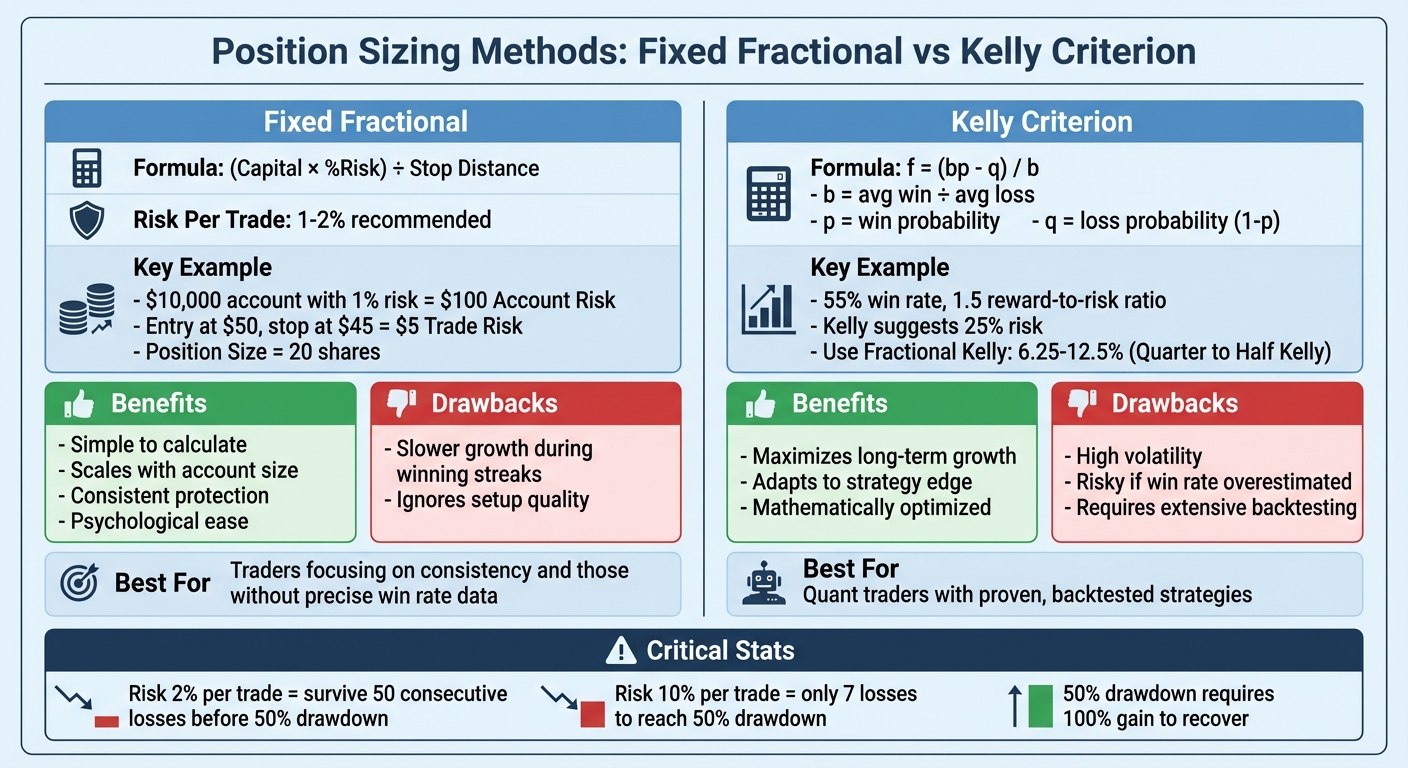
Here’s a stark example: if you risk 2% per trade, you could endure 50 consecutive losses before halving your account. But if you risk 10% per trade, it only takes 7 losses to reach the same point. Losing half your capital is a steep hill to climb, requiring a 100% gain just to break even. This is why professional traders prioritize position sizing above all else.
"Position sizing is THE #1 skill. Not technical analysis. Not economic news reading. The sizing." - Van Tharp
Two popular methods for position sizing are Fixed Fractional and Kelly Criterion. Each approach caters to different trading styles and risk appetites, but both are designed to help traders stay in the game long enough to leverage their edge.
Fixed Fractional Position Sizing
The fixed fractional method involves risking a set percentage of your account on each trade - commonly 1-2%. This approach adjusts your position size as your account balance changes, offering built-in protection during losing streaks and scaling up during profitable periods.
Here’s how it works in three steps:
- Account Risk: Multiply your account balance by your chosen risk percentage. For a $10,000 account with a 1% risk, your Account Risk is $100.
- Trade Risk: Calculate the dollar difference between your entry price and stop-loss. For instance, buying at $50 with a stop at $45 means a Trade Risk of $5 per share.
- Position Size: Divide your Account Risk by your Trade Risk. In this example, $100 ÷ $5 = 20 shares.
Let’s look at a more complex example. Suppose you have a $25,000 account and risk 1.5% per trade. Your Account Risk is $375 ($25,000 × 0.015). If you’re trading the E-mini S&P 500, entering at 4,200 with a stop at 4,180 (a 20-point risk), and each point is worth $50, your Trade Risk is $1,000 (20 × $50). The formula gives you a position size of $375 ÷ $1,000 = 0.375 contracts. Since you can’t trade partial contracts, you’d round down to zero contracts and wait for a better setup with a tighter stop.
In volatile markets like forex or crypto, using the Average True Range (ATR) can help set wider stops while keeping your dollar risk constant. For beginners, starting with 0.5-1% risk per trade is a safer way to learn and manage emotions. Experienced traders often cap their risk at 2%.
Kelly Criterion for Position Sizing
The Kelly Criterion is a mathematical formula that aims to maximize long-term account growth by factoring in your strategy’s win rate and reward-to-risk ratio. The formula is:
f = (bp - q) / b,
where b is your average win divided by your average loss, p is your win probability, and q is your loss probability (1 - p).
Here’s an example: Your trading strategy has a 55% win rate (p = 0.55, q = 0.45), and your average winner is 1.5 times your average loser (b = 1.5). Plugging these into the formula:
f = (1.5 × 0.55 - 0.45) / 1.5 = (0.825 - 0.45) / 1.5 = 0.25 or 25%.
This means the Kelly Criterion recommends risking 25% of your account on each trade.
However, using the full Kelly amount can lead to extreme volatility and significant drawdowns. Even a small overestimation of your win rate can push you into negative growth territory. To mitigate this, professional traders often use Fractional Kelly, risking 25–50% of the calculated value. For example, in the scenario above, you might risk 6.25% (Quarter-Kelly) or 12.5% (Half-Kelly). This approach still captures most of the growth potential while reducing volatility.
"When the odds are strongly in your favor - bet big." - Charlie Munger
Run 24/7 while you sleep. Keep bots, platforms, and trade copiers online on a dedicated VPS.
Low-latency VPS hosting for your trading platform.
From $59.99/mo
Kelly works best for systematic strategies backed by thorough backtesting and reliable execution. For discretionary traders or those without robust data, Fixed Fractional is a safer choice.
Comparing Position Sizing Models
Here’s a quick comparison to highlight the differences between these two methods:
| Method | Formula | Benefits | Drawbacks | Best Use Case |
|---|---|---|---|---|
| Fixed Fractional | (Capital × %Risk) ÷ Stop Distance |
Simple, scales with account, consistent protection. | Slower growth during winning streaks; ignores setup quality. | Ideal for traders focusing on consistency. |
| Kelly Criterion | (bp - q) / b |
Maximizes growth; adapts to strategy edge. | High volatility; risky if win rate is overestimated. | Best for quant traders with proven backtests. |
Fixed Fractional offers simplicity and psychological ease, treating all trades equally. It’s particularly useful if your edge isn’t perfectly quantified. Meanwhile, Kelly is mathematically optimized for compounding wealth but requires precise knowledge of your strategy’s metrics, which is only possible with extensive backtesting.
One final guideline: manage your Portfolio Heat - the total percentage of your account at risk across all open trades. Keep it between 4% and 8%. For instance, if you risk 2% per trade, limit yourself to four positions at a time. This prevents correlated losses from snowballing when markets turn against you.
Understanding and Managing Drawdowns
A drawdown represents the drop in your account's value from its highest point (peak) to its lowest point (trough) before it recovers to a new high. For instance, if your account grows from $500,000 to $750,000, then falls to $350,000 before climbing to $800,000, the maximum drawdown would be 53.33%. This is calculated as ($350,000 - $750,000) ÷ $750,000.
Managing drawdowns is a cornerstone of effective risk management, just like precise position sizing. The reason? The deeper the drawdown, the harder it becomes to recover. For example, a 10% drawdown requires an 11.1% gain to recover, but a 50% drawdown demands a staggering 100% gain just to break even. A historical example of this can be seen in the S&P 500’s 55% decline during the 2008 financial crisis, which highlights the dangers of failing to manage drawdowns effectively.
"The deeper [drawdowns] are, the harder it can become for you to recover lost capital. For example – if you experience a 50% drawdown, you'll need a 100% gain to break even again." - Pepperstone
Why Managing Drawdowns Matters
It’s worth noting that 95% of proprietary trading firm failures result from poor risk management rather than flawed strategies. A common mistake among traders is failing to adjust position sizes during losing streaks, which can increase losses by as much as 40%. To avoid this, traders often set a maximum acceptable drawdown - a predefined threshold that signals when to pause trading and reassess. Conservative traders might limit drawdowns to 5-10%, while those with moderate risk tolerance may allow for 10-20%. Many also cap total losses at 5% to protect their capital and maintain discipline.
Practical Tips for Drawdown Management
- Monitor All Losses: Keep track of both realized losses and floating (unrealized) losses in real time. Since many proprietary firms count unrealized losses toward drawdown limits, monitoring your net liquidation value can prevent unexpected account closures.
- Adjust Trade Sizes: Using tools like ATR (Average True Range) to modify trade sizes ensures consistent dollar risk across trades, which helps control drawdowns.
Defining and Measuring Drawdowns
Understanding and measuring drawdowns is a key part of managing risk effectively. The maximum drawdown (MDD) represents the largest drop from a portfolio's peak value to its lowest point before it recovers to a new high. Here's the formula:
MDD = (Trough Value - Peak Value) ÷ Peak Value
For example, if a portfolio peaks at $750,000 and later drops to $350,000, the maximum drawdown is calculated as ($350,000 - $750,000) ÷ $750,000, resulting in -53.33%. It's important to note that interim peaks below the original high are not considered in this calculation. This metric highlights the challenges of recovering from significant market declines.
"Maximum drawdown is the worst dip an investment takes from a high to a low." - Investopedia
The recovery multiplier illustrates the effort required to bounce back from losses. For instance:
- A 10% loss needs an 11.1% gain to recover.
- A 25% loss requires a 33.3% gain.
- A 75% loss demands a massive 300% gain.
This disproportionate relationship between losses and recovery explains why many proprietary trading firms impose strict drawdown limits. Notably, about 95% of evaluation failures stem from poor risk management, not flawed strategies.
In addition to maximum drawdown, traders should monitor average drawdown and recovery time. These metrics provide insights into whether a strategy experiences frequent small losses or rare but severe ones. For instance, in February 2026, trader Sarah Chen successfully completed a $100,000 FTMO evaluation by adhering to a disciplined approach. She limited her risk to 0.75% per trade ($750) and stopped trading after two consecutive losses. Her largest single loss never exceeded $750, and she achieved a 5.1% gain over 30 days with a smooth equity curve. These measurements are crucial for proper position sizing and protecting capital, reinforcing the importance of disciplined trading.
Methods to Reduce Drawdowns
Measuring drawdowns is just the beginning - traders can actively reduce them by applying effective risk management techniques. Here are some strategies:
- Step-down scaling: Reduce risk per trade as specific drawdown levels are reached. For example, if your account hits a 5% drawdown, you might lower your risk from 1% to 0.5% per trade.
- Volatility-based sizing: Use tools like the Average True Range (ATR) to adjust position sizes during volatile market conditions, limiting potential losses.
- Trailing stops: These help lock in profits as a trade moves in your favor, preventing gains from turning into losses.
- Behavioral checkpoints: Enforce a pause after a set number of consecutive losses (typically three to five). This allows for a mental reset and reduces emotional decision-making.
- Circuit breakers: Set hard daily loss limits (e.g., 2–3% of account balance) to halt trading and prevent further losses during bad sessions.
The difference between disciplined and reckless risk management is stark. Consider two traders in February 2026. Sarah Chen succeeded by sticking to her plan, while Mike Rodriguez failed a $50,000 TopStep Combine after losing $400 on his first trade. In an emotional attempt to recover, he increased his risk to 2%, suffered a series of poor trades, and lost $3,500 in one session, breaching his daily loss limit. This highlights how revenge trading after a drawdown can lead to disastrous outcomes - 60% of breached trading evaluations result from this behavior.
| Strategy | Trigger | Primary Benefit |
|---|---|---|
| Fixed % Reduction | Equity falls below a set threshold (e.g., -10%) | Limits risk during losing streaks |
| Step-Down Scaling | Reaching drawdown milestones (e.g., -5%, -10%) | Protects capital by reducing risk systematically |
| Trailing Stops | Trade moves favorably by a set amount (e.g., 1:1 R/R) | Secures profits and avoids turning winners into losers |
| Behavioral Checkpoints | A specific number of consecutive losses (e.g., 3–5) | Encourages a mental reset during tough periods |
| Volatility-Based Sizing | Increase in market ATR or standard deviation | Adjusts risk to match current market conditions |
Another effective practice is the "Three-Day Rule": if a weekly loss limit is reached, take a 72-hour break from trading. This pause helps reduce stress and restore rational decision-making. Such cooling-off periods can prevent emotional reactions from turning manageable drawdowns into catastrophic losses.
Capital Protection Methods and Risk Metrics
Portfolio Risk Caps and Diversification
Managing risk across your portfolio is essential to protect your trading account. One key strategy is limiting your portfolio heat - the total risk from all active trades. Experts recommend keeping this between 4% and 8% of your total equity, with many professional traders capping it at 5% to maintain tighter control.
Let’s break this down: if you’re trading with a $50,000 account and set a 5% portfolio heat cap, your total risk across all open trades shouldn’t exceed $2,500. For example, if you’re already risking $1,500 on two EUR/USD trades, you’d have only $1,000 left for additional positions. This approach helps prevent overexposure and protects your account from significant losses.
Diversification is another critical factor, but it’s more than just spreading trades across different assets. Correlation matters. For instance, trading EUR/USD and GBP/USD might seem like two separate trades, but since both involve USD, their movements are often linked. When calculating portfolio heat, treat highly correlated assets as a single risk unit. A good rule of thumb is to limit combined exposure to correlated groups - like JPY pairs or commodity currencies (AUD, CAD, NZD) - to no more than 20% of your total portfolio heat.
Stay online and closer to execution. Choose a VPS location for CME futures, New York markets, London FX, API trading, and more.
Host your platform near the market route that matters.
From $59.99/mo
"Proper position sizing is crucial. It is effective risk management in action." - Finaur
This principle also applies to futures trading. For example, crude oil and natural gas contracts are both tied to the energy sector, so trading them simultaneously increases your exposure to sector-specific risks. Similarly, holding E-mini S&P 500 and Nasdaq-100 futures amplifies your exposure to U.S. equities. To stay within your risk limits, round down your position sizes to the nearest tradable unit, ensuring you don’t unintentionally exceed your cap.
Once you’ve established these risk caps, advanced metrics like VaR and stress tests can help you measure and refine your approach.
Stress Testing and Value at Risk (VaR)
Value at Risk (VaR) is a tool that estimates potential losses over a specific time period. For instance, if your portfolio has a 95% VaR of 2%, there’s a 95% chance you won’t lose more than 2% in a single day.
You can calculate VaR using three main methods:
- Historical Method: This involves analyzing past returns and ranking them to predict future losses.
- Variance-Covariance Method: Assumes returns follow a normal distribution and calculates risk based on standard deviation.
- Monte Carlo Simulation: Uses computational models to simulate thousands of scenarios and estimate potential losses [27].
Stress testing takes things a step further by simulating extreme market events. For example, you could model a scenario with a 10% overnight market gap or doubled volatility to identify weaknesses before they lead to actual losses [28].
Here’s a practical example: suppose you hold three correlated forex positions with a combined risk of $3,000. Stress testing might reveal that if all positions hit their stop-loss levels simultaneously, your true risk is $3,000 - not the $1,000 per trade you initially calculated. This insight could lead you to reduce position sizes or close one trade to mitigate risk.
To further safeguard your portfolio, set hierarchical risk limits at multiple levels:
- Limit single-trade risk to 1%.
- Cap currency group or sector risk at 3%.
- Restrict total portfolio heat to 5%.
This layered approach ensures no single market event can wipe out your account, even during extreme volatility. For instance, traders who followed such strategies were better positioned to weather events like the 2015 Swiss National Bank shock. By combining these methods with disciplined position sizing, you can build a more resilient portfolio.
Risk Management and Trading Infrastructure
A solid risk management plan can crumble without dependable execution. Technical issues - like platform freezes or internet outages - can lead to unintended trades or leave positions exposed during market turbulence. These unexpected moments highlight the importance of having a robust trading infrastructure to keep your risk parameters intact, even during volatile market conditions.
Low Latency and Reliable Execution
When it comes to trading, milliseconds matter. Server-side execution ensures trades continue even if your local connection or hardware fails. This becomes especially critical during high-volatility events like FOMC announcements or Non-Farm Payroll reports, where slippage can widen significantly. With ultra-low latency (0–1 ms to exchanges), stop-loss orders are far more likely to execute at intended prices, minimizing unexpected losses[30].
Here’s a sobering statistic: if you lose 50% of your trading capital, you’ll need a 100% gain just to break even. That’s why professional-grade VPS hosting with 99.95% uptime is so valuable - it shields your trades from local outages that could otherwise derail your strategy during key moments[30]. Pairing reliable execution with the right VPS plan can be a game-changer for your risk management approach.
QuantVPS Plans for Risk Management
QuantVPS offers a range of plans designed to meet the specific needs of both casual traders and those running advanced algorithmic strategies. The infrastructure you require depends heavily on your trading style. For instance, a trader working with just one or two charts has simpler needs compared to someone managing complex algorithms across multiple markets.
| Plan | Specifications | Ideal Use Case | Pricing |
|---|---|---|---|
| Lite | 4 Cores, 8GB RAM, 70GB NVMe | For 1–2 charts and entry-level automation | $59.99/month |
| Pro | 6 Cores, 16GB RAM, 150GB NVMe | Running 3–5 charts; multi-monitor setups; day trading | $99.99/month |
| Ultra | 24 Cores, 64GB RAM, 500GB NVMe | High-frequency trading (HFT); demanding algorithmic setups | $189.99/month |
| Dedicated | Custom Hardware, 10Gbps Speed | Institutional-grade setups; maximum performance | From $299.99/month |
Each plan includes essential features like DDoS protection, automatic backups, and compatibility with trading platforms such as NinjaTrader, MetaTrader, and TradeStation. With servers positioned near major exchanges, QuantVPS ensures the speed and reliability needed to help you lock in profits before market conditions take a sharp turn.
Conclusion
Building solid practices in position sizing, managing drawdowns, and protecting capital is the cornerstone of successful trading. Risk management isn't about predicting every market move - it's about weathering market swings so you can seize profitable opportunities when they arise. The numbers make this clear: 85% of traders who stick to the 1–2% risk rule stay in the game for at least two years, while 88% of those who risk 10% or more wipe out within a year. That gap isn't due to chance - it's all about discipline.
The math behind this is unforgiving. If you lose 50% of your account, you need to earn back 100% just to break even. This harsh reality explains why seasoned traders focus more on position sizing and stop-losses than on perfect entry signals. As Van Tharp famously said:
"You can have the world's best strategy. If you size wrong, you die."
This kind of calculation highlights the importance of maintaining discipline in every part of trading. Using tools like server-side stops ensures trades are automatically closed to prevent catastrophic losses during volatile periods. The secret to successful trading isn't superior intelligence - it's a commitment to keeping risk per trade under 1%, carefully managing portfolio exposure, and adjusting position sizes based on market volatility.
FAQs
How do I pick the right stop-loss so my position size makes sense?
Before jumping into a trade, it’s crucial to define your stop-loss level. This decision should be based on two key factors: your personal risk tolerance and a thorough market analysis. Start by deciding how much of your trading capital you’re willing to risk on a single trade - typically, this might be around 1-2% of your account balance.
Once you’ve determined your acceptable risk, calculate your position size to match that percentage. Make sure your stop-loss level reflects this risk limit. For instance, consider the volatility of the asset and critical price levels, such as support or resistance points. These elements help ensure your stop-loss is not only realistic but also effective in keeping your risk managed.
When should I reduce risk after a drawdown or losing streak?
When your equity takes a hit due to a drawdown or losing streak, it's essential to take steps to minimize risk and protect your capital. One effective approach is to reduce your position sizes when your equity drops below specific thresholds.
You can implement this by using strategies like fixed percentage reductions, where you decrease your risk exposure by a set percentage, or dynamic position sizing, which adjusts your trades based on your current equity level. Both methods aim to limit further losses and preserve your account during tough market conditions.
By proactively adjusting your risk, you maintain discipline and create a buffer to navigate challenging periods without jeopardizing your overall trading strategy.
How do I measure portfolio heat with correlated trades?
To evaluate portfolio risk when dealing with correlated trades, you can use the formula: Effective Risk = Nominal Risk × √(N × Avg Correlation). This calculation adjusts for the effect of correlations between trades, providing a clearer picture of your portfolio's actual risk.
It's also essential to keep an eye on your overall risk exposure. To prevent excessive concentration, incorporate correlation matrices and stress testing into your risk management processes. These tools allow you to better understand how correlated trades might influence your portfolio under various scenarios, helping you manage potential vulnerabilities more effectively.


