
The UnusualWhales Scanner is a powerful platform for tracking real-time options flow and institutional trading activity. It offers tools like sweep order tracking, Gamma Exposure (GEX) analysis, dark pool data, and options flow insights to help retail traders spot institutional moves and make data-driven decisions. With features like premium filters, strategy identification, and alerts, traders can refine their timing and risk management. However, the platform is best suited for active traders familiar with options data, as beginners may find it overwhelming. Pricing may also be steep for casual traders or those with smaller accounts. If you trade options regularly and want access to institutional-grade data, this tool could help refine your trading strategy.
Core Features of UnusualWhales Scanner
These tools give traders the ability to spot institutional activity in real-time, capitalizing on the platform's tracking capabilities.
Options Sweeps Tracking
A sweep order refers to a large market order split across multiple exchanges to secure the best available prices. UnusualWhales monitors these sweeps across all U.S. options exchanges in real time, highlighting urgent institutional activity.
The platform uses specific alerts to flag these movements. For instance, the "Sweeps Followed By Floor" alert is triggered when at least 10 sweep orders are followed by a large floor trade with a premium of at least $100,000. This pattern often signals strong institutional conviction. Another alert, "Repeated Hits," activates when more than five transactions occur on the same options chain within 100 milliseconds, with premium thresholds ranging from $10,000 to $100,000 based on the stock's market cap.
"A 'sweep' is a market order in which a (typically) larger size trade 'sweeps' different exchanges... with the goal of filling their order at the best prices currently offered on the market." - Unusual Whales
The scanner also detects institutional moves by focusing on block orders exceeding 10,000 contracts and Volume-to-Open Interest (Vol/OI) ratios above 1.0. A Vol/OI ratio over 1.0 indicates that new positions are being initiated rather than old ones being closed. For example, on July 8, 2025, the scanner flagged a Vol/OI ratio of 11.55 for Nvidia (NVDA) 160c contracts expiring on 8/8/2025. These contracts were bought at an average price of $6.51 and sold a week later for $13.35.
This level of sweep tracking provides a foundation for deeper insights into options flow data.
Options Flow Data Analysis
The scanner processes options flow data to uncover patterns that can reveal market sentiment and directional trends. It distinguishes between buyer-initiated trades (hitting the "Ask") and seller-initiated trades (hitting the "Bid").
Aggregated Trades are another key feature. This tool combines individual transactions from various exchanges into a single data point, ensuring that large institutional trades aren’t hidden in fragmented orders. For instance, in February 2026, the scanner flagged an aggregated trade for Rigetti Computing (RGTI) 20c expiring 8/15/2025. This trade combined multiple smaller fills into a $783,000 premium alert, exposing a significant institutional position that might have gone unnoticed otherwise.
The platform also identifies multi-leg strategies like spreads and straddles. Its "Strategy Identifier" tool helps traders decode complex institutional moves. For example, the scanner spotted a multi-leg trade in Deckers Outdoor (DECK) involving the $160 and $170 calls expiring 1/15/2027. The Strategy Identifier revealed this as a Call Debit Spread, indicating a bullish bet with a capped upside.
By combining these flow data insights with other market indicators, traders can gain a clearer understanding of institutional strategies.
Finding Market Edge with Combined Data
Run 24/7 while you sleep. Keep bots, platforms, and trade copiers online on a dedicated VPS.
Low-latency VPS hosting for your trading platform.
From $59.99/mo
Integrating options flow data with other metrics, such as Dark Pool prints and Gamma Exposure (GEX), helps confirm institutional activity before price shifts. The "Market Tide" feature visually displays net put versus call premium across the market, giving traders a way to align individual ticker flows with broader market trends.
For example, on September 26, 2024, a trader spent $1.43 million in premium to buy 950 contracts of Salesforce (CRM) $300 strike calls expiring in March 2025. This trade was identified by filtering for single-leg, out-of-the-money calls on equities with premiums over $500,000. By combining this data with other market signals, traders could evaluate the likelihood of this being a directional bet.
The scanner also provides preset alerts like "Low Historic Volume Floor," which triggers when trade volume surpasses a three-day average for stocks under $150 billion market cap with premiums exceeding $50,000. These alerts help traders pinpoint unusual activity relative to a stock's typical behavior, giving them a chance to act before broader market recognition.
How Traders Use UnusualWhales Scanner
Now that we've covered the scanner's core features, let's dive into how traders actually apply this tool to fine-tune their timing and manage risk effectively. The platform's real-time alerts and data filters turn raw options flow into actionable insights, helping traders make smarter decisions about when to enter and exit trades.
Improving Trade Entry and Exit Timing
Traders use the scanner's alerts to sharpen their timing. For example, the "Repeated Hits" alert can signal key moments to enter or exit. Patterns like "Ascending Fill" (where fill prices rise quickly) suggest strong bullish momentum and a potential entry point. On the flip side, a "Descending Fill" indicates bearish pressure, which traders might use to time their exits.
Implied Volatility (IV) shifts also play a big role in this process. A sudden spike in IV paired with high volume often signals aggressive buying, while a drop in IV during flat price action can hint at contracts being sold or written, signaling a potential exit opportunity.
The Volume to Open Interest (Vol/OI) ratio is another key metric. It helps confirm whether institutional players are opening new positions. For instance, in an earlier example, a high Vol/OI ratio for NVIDIA led to a 105% gain.
Gamma Exposure (GEX) data is also crucial, as it highlights price levels where market makers may need to hedge. These levels often act like magnets or pivot points, providing traders with additional precision when timing their entries and exits. Combining GEX data with fill patterns can further refine these decisions.
One important tip: avoid analyzing flow during the market's first 30 minutes (9:30–10:00 AM EST). Early volatility often skews alerts. Instead, focus on data from 10:00 AM to 4:00 PM EST for more reliable insights into institutional trends.
Using Data for Risk Management
The scanner also enhances risk management by helping traders size their positions based on premium levels and order book dynamics. Instead of relying on hard stop-loss orders - which can be triggered by market volatility or stop-loss hunting algorithms - traders can set price alerts within the platform to monitor movements quietly.
To further reduce risk, traders avoid placing stops at psychological price levels (like whole numbers) to minimize exposure to price manipulation. Position sizes can be adjusted dynamically based on the premium of large institutional trades, allowing traders to align their strategies with current market activity.
The platform's Options Profit Calculator is a valuable tool, enabling traders to model potential profit and loss scenarios for 28 different strategies before committing capital. This helps assess risk-reward ratios and fine-tune position sizes.
Dark pool data adds another layer of insight. Since off-exchange trades can account for 30% to 40% of total volume in heavily traded stocks, monitoring this activity provides clues about institutional positioning that aren’t visible in public order books. When dark pool activity aligns with options flow, it strengthens the case for maintaining or increasing a position.
These strategies help traders identify high-probability opportunities while managing their risk.
Example: Spotting Opportunities with Flow Data
Real-world examples highlight how traders combine timing, flow data, and risk controls. Take January 17, 2025, for instance. The scanner flagged a "Repeated Hits Alert" for Celestica Inc. (CLS) $130 calls expiring February 21, 2025. At the time, CLS stock was trading at $111.31, making the calls 17% out-of-the-money. The scanner identified 1,200 contracts purchased at an average price of $3.60, with a Vol/OI ratio indicating fresh positions being opened.
A trader acting on this signal could filter for out-of-the-money calls, set the "Side" to "Ask" to focus on aggressive buyers, and toggle "Opening Trades" to confirm institutional activity. By setting a minimum premium threshold of $500,000, the trader could zero in on whale-sized orders rather than retail noise.
By January 22, 2025 - just three days later - CLS stock hit $131, and the contracts soared to $10.50, delivering a 191% gain.
Another example: On May 2, 2025, a trader spotted 11,000 Microsoft (MSFT) 450c contracts expiring August 15, 2025, opened at $20.10. By July 31, 2025, the contracts were valued at over $90.00, illustrating how tracking large institutional trades can help time long-term swing entries.
"Johnny Retail is not placing 10,000 sized trades from his mother's basement. Some fund or desk trading 10,000 contracts raises eyebrows." - Unusual Whales
These examples show how traders use tools like Vol/OI ratios, fill direction, premium thresholds, and aggregated trades to spot high-potential setups and manage them through to profitable exits.
Pros and Cons of UnusualWhales Scanner
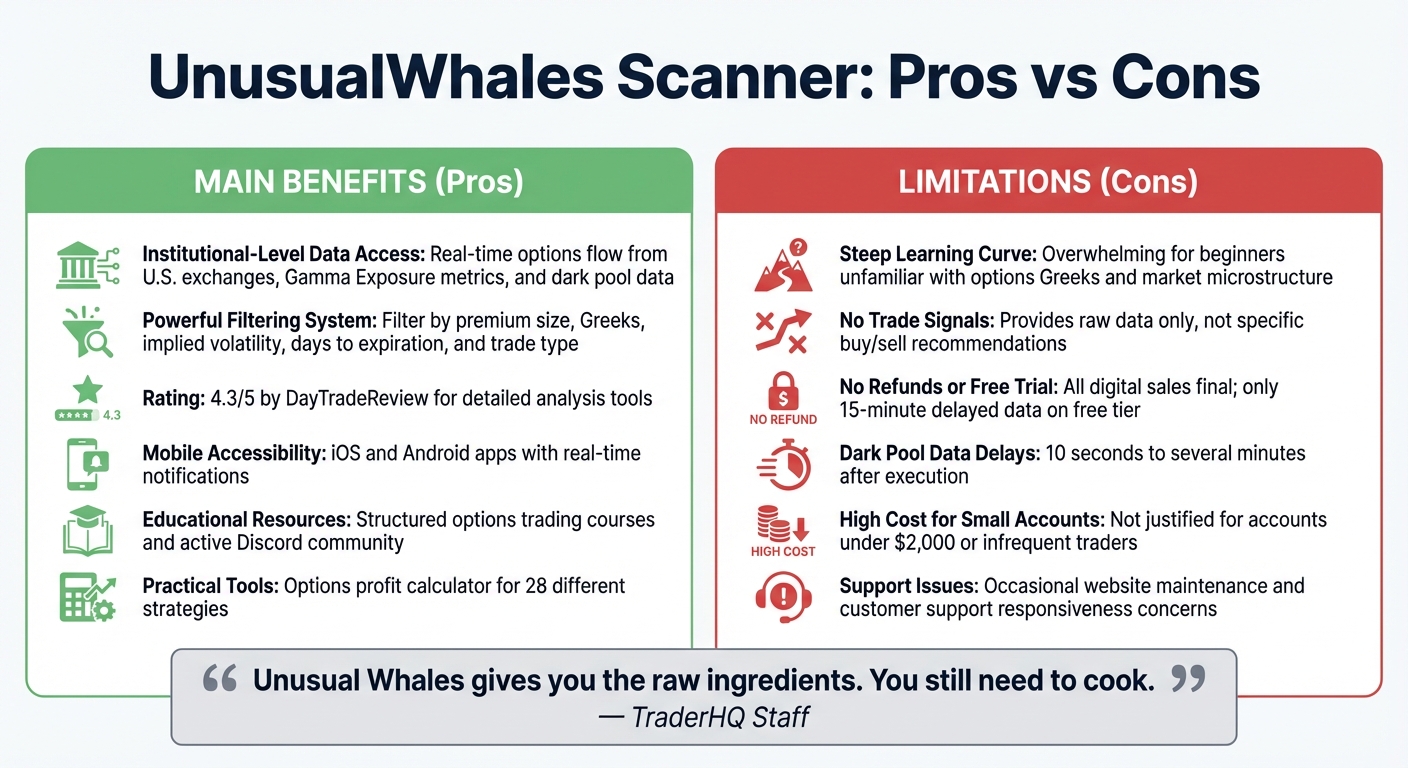
UnusualWhales Scanner Pros vs Cons Comparison Chart
Weighing the strengths and drawbacks of the UnusualWhales Scanner can help you decide if it fits your trading approach.
Main Benefits
UnusualWhales Scanner delivers institutional-level data to retail traders, offering tools like real-time options flow from U.S. exchanges, Gamma Exposure metrics, and dark pool data - resources typically reserved for professional traders.
Stay online and closer to execution. Choose a VPS location for CME futures, New York markets, London FX, API trading, and more.
Host your platform near the market route that matters.
From $59.99/mo
Its powerful filters - covering criteria such as premium size, Greeks, implied volatility, days to expiration, and trade type - are a standout feature. DayTradeReview rates the platform 4.3/5, highlighting its detailed analysis tools and excellent filtering options.
Beyond its data capabilities, the platform includes practical tools like a profit calculator and mobile alerts. The iOS and Android apps ensure you receive real-time notifications, keeping you informed even when you're away from your desk.
The platform also supports learning with structured options trading courses and an active Discord community. This community allows traders to discuss flow data, share custom scanner settings, and gain insights from others.
"It is one of, if not the most complete platforms of its type available to retail investors today." - Druvi Storer, Finance Writer, Whop
These features make it a comprehensive tool, but it’s not without its challenges.
Limitations to Know
For beginners, the platform can feel daunting. The sheer volume of data and tools - especially those involving options Greeks and market microstructure - may overwhelm those new to trading.
"Unusual Whales gives you the raw ingredients. You still need to cook." - TraderHQ Staff
It’s important to note that this is not a signal service. The platform provides robust data but does not offer specific "buy" or "sell" recommendations.
Another downside is the lack of a refund policy. All digital sales are final, and there’s no free trial for paid plans. The free tier does allow users to explore the interface with 15-minute delayed data, but it doesn’t offer the real-time experience of the paid version.
Dark pool data, while helpful, is subject to minor delays ranging from 10 seconds to several minutes after execution. Some users have also reported issues with website maintenance and occasional lapses in customer support responsiveness.
Lastly, the subscription cost may be hard to justify for traders with smaller accounts (under $2,000) or for those who trade infrequently. Long-term investors or those holding positions for months may find the platform excessive for their needs.
"If you are a long-term investor or swing trades for months at a time, this is probably not a tool for you. It would be a $48/month waste." - Gavin, Options Trading IQ
Is UnusualWhales Scanner Right for You?
Best Suited For
The UnusualWhales Scanner is tailored for active options traders who execute trades regularly - at least weekly - and need immediate access to institutional positioning data. If you're a swing trader seeking confirmation signals or a volatility trader focusing on Gamma Exposure (GEX) and implied volatility shifts, this tool provides the insights you’re looking for.
This platform is built for traders who thrive on raw data. It delivers metrics like Greeks, flow patterns, and dark pool prints, but it doesn’t spoon-feed explicit trade signals. For example, in May 2025, the scanner flagged Informatica (INFA) for having 19.29 times its usual options activity. Two weeks later, Salesforce announced its acquisition of the company. Spotting such opportunities early demands that users interpret the data effectively.
That said, it’s not ideal for long-term passive investors or those who trade infrequently. If you have a smaller account, the subscription cost might feel steep. Understanding your trading style is just the beginning - success hinges on how well you can use these insights within your overall trading strategy.
Integrating Scanners into Your Trading System
Identifying your trading style is important, but knowing how to incorporate the scanner into your broader strategy is where the real value lies. The UnusualWhales Scanner works best as a confirmation tool, not as a standalone system. Use its options flow and dark pool data to validate your existing setups - whether technical or fundamental - rather than trading solely based on whale alerts. As UnusualWhales itself warns, "It is not recommended to trade on this information, and you will not be able to recreate past results."
Before risking real money, practice with paper trading to sharpen your ability to interpret flow data and improve your timing. You can also set custom alerts, like premium thresholds above $1,000,000 or Volume/OI ratios exceeding 10, to filter for actionable opportunities. The Portfolio Manager feature lets you link your brokerage account, enabling you to compare flow-based decisions against your actual performance.
To succeed, you’ll need more than just access to data - you’ll need strong risk management and a clear strategy. Keep in mind that research shows only 3% to 20% of day traders achieve profitability. Your edge lies in how well you analyze and act on the information provided by the scanner. Take advantage of the active Discord community to learn how experienced traders sift through the constant flow of data and transform it into actionable setups. And above all, make risk management a core part of every trade.
FAQs
How do I tell if a sweep is bullish or bearish?
When trying to figure out if a sweep is bullish or bearish, it all comes down to analyzing the options flow. A bullish sweep typically shows up as large purchases of out-of-the-money (OTM) call options, which suggests traders are betting on a price increase. On the flip side, bearish sweeps often involve significant buys of OTM put options, pointing to expectations of a price drop.
Another important factor? Look at whether these trades are opening new positions. If they are, it's a stronger signal - bullish for calls and bearish for puts - giving you a clearer picture of market sentiment.
What filters should I start with to cut out noise?
To cut through the noise on the UnusualWhales Scanner, start by applying filters that spotlight noteworthy trades. Look for large trade sizes, such as positions with a minimum value of $500,000. You can also focus on OTM (out of the money) call buyers and narrow down expiration dates to a range of 2 weeks to 6 months. These adjustments make it easier to zero in on significant activity while filtering out less relevant trades.
How can I use GEX and dark pool data to confirm flow?
Gamma Exposure (GEX) data and dark pool activity offer valuable context for understanding options flow by shedding light on market dynamics and institutional behavior. GEX data pinpoints critical support and resistance levels, as well as areas prone to heightened volatility. Meanwhile, dark pool activity uncovers large, concealed trades made by institutions.
When these two elements align with notable options flow, it strengthens the case for informed trading activity. This alignment can boost confidence in the signals, providing a clearer picture of market sentiment and potential moves.


