
Trading less often can improve your results by reducing costs, improving focus, and increasing the quality of your decisions. Research shows that frequent traders often underperform due to transaction costs and impulsive decisions. Here's why trading smarter - not more - works:
- Lower Costs: Frequent trades rack up commissions, spreads, and slippage, which can eat into profits.
- Better Focus: Fewer trades mean less decision fatigue and more energy for high-quality setups.
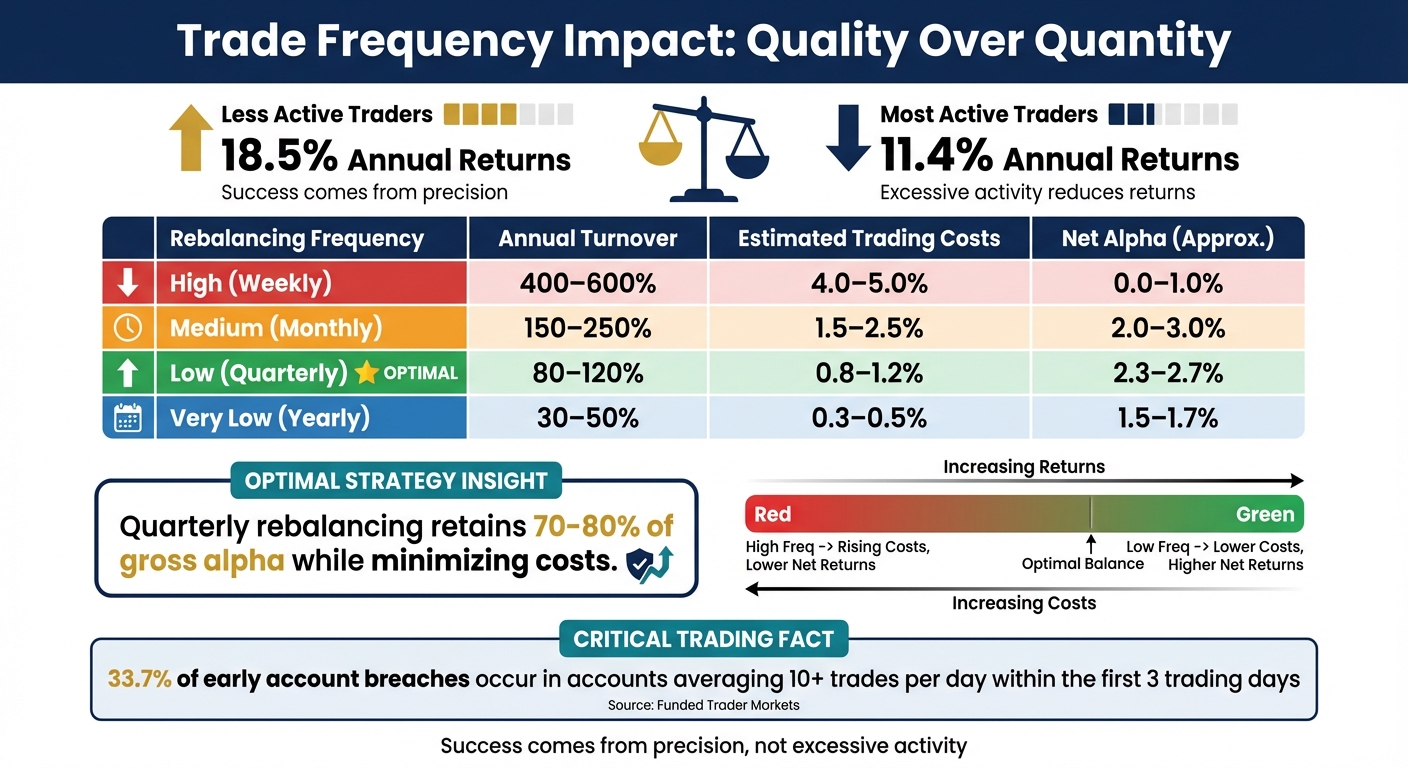
- Higher Returns: Studies found that less active traders earned annual returns of 18.5%, compared to 11.4% for frequent traders.
To succeed, focus on high-probability setups, use tools to filter trades, and automate your discipline. Technology like VPS hosting and equity curve simulators can help you stick to a selective approach, ensuring consistent execution and risk management. The bottom line: trading less can lead to better performance and more sustainable growth.
The Problems with Overtrading
Overtrading sets off a damaging cycle that eats away at your trading account in multiple ways. Emotional triggers like FOMO (fear of missing out), revenge trading, and even boredom can push you into making impulsive trades. These trades often stray from your strategy and are more about filling the void during volatile markets than sticking to a plan.
The financial toll is significant. According to internal data from Funded Trader Markets, 33.7% of early account breaches happen in accounts averaging more than 10 trades per day within the first three trading days. Think about it - 10 poorly chosen trades can easily drain 3–5% of your account value just through transaction costs. If these costs surpass 20% of your gross profits, it’s a clear sign you’re trading too much.
Overtrading doesn’t just hurt your wallet - it drains your mental energy. Every trade chips away at your focus, leading to decision fatigue. This fatigue results in lower-quality setups, sloppy execution, and an unpredictable equity curve. What starts as a promising strategy can quickly lose its edge.
"A good strategy applied too often becomes a bad one." - Investomine
The problem is, overtrading often feels justified. This is the "activity trap" - confusing constant action with actual progress. But markets reward precision, not volume. The best traders know when to pull back, especially during losing streaks, while less disciplined traders ramp up activity in a desperate attempt to recover losses. Recognizing these issues is the first step toward focusing on quality trades and executing them with precision.
How to Focus on High-Probability Setups
The key to avoiding overtrading is patience - waiting for trades that align with multiple factors. High-probability setups aren't guaranteed winners, but they stack the odds in your favor. By combining higher timeframe trends, critical support and resistance levels, and volume confirmation, you create "confluence" - a concept traders rely on to make informed decisions. This approach directly counters the urge to overtrade.
Start by identifying the Daily or 4-hour trend, then look for pullbacks on lower timeframes to confirm a momentum shift. The strongest trades occur when the broader trend aligns with your entry signal on a smaller timeframe. For instance, if the Daily chart shows an uptrend, wait for a pullback on the 5-minute or 15-minute chart that breaks a recent swing low, signaling a potential continuation of the trend.
"Imagine a professional sniper. They don't fire at every shadow that moves across the field; they wait hours, sometimes days, for the perfect alignment... Are you firing at every 5-minute candle flicker, or are you waiting for the high-probability kill zone?" - FXNX
Volume plays a crucial role in confirming whether a move has strength. Look for liquidity sweeps - when the price surpasses previous highs or lows, followed by a strong reversal. For example, in Opening Range Breakouts, the direction of the first candle often predicts the initial breakout with 77–80% accuracy. These statistical edges help you stay disciplined and selective with your trades.
Run 24/7 while you sleep. Keep bots, platforms, and trade copiers online on a dedicated VPS.
Low-latency VPS hosting for your trading platform.
From $59.99/mo
Fewer trades also mean lower costs. For example, a trader taking 10 trades a month might pay around $150 in spreads and commissions, whereas someone placing 100 trades could face $1,500 in costs. Selectivity not only improves trade quality but also reduces these frictional expenses.
Using Scanning Tools to Filter Trades
To stay selective, automate your trade filtering process. Platforms like TradingView allow you to create a "Liquid Universe" filter with specific criteria: stocks priced at $5 or more, a 90-day average volume of at least 1,000,000, and a Relative Volume between 1.3 and 1.8. This ensures you're only considering instruments with sufficient liquidity, making it easier to focus on high-probability opportunities.
Instead of constantly watching charts, use "Set-and-Alert" workflows. Set alerts 10–15 pips before your target price and at the exact level where momentum shifts. This method reduces decision fatigue and keeps you sharp for when the right setups appear. Interestingly, Monday tends to be the cleanest day for breakouts, with a 54% whipsaw rate on the ES 15-minute timeframe, while Wednesday sees a higher rate of 66.4%.
Every trade should pass a simple three-point checklist: higher timeframe alignment, a clear momentum shift on the lower timeframe, and volume confirmation. Aim for 1–3 high-quality trades per week. If a setup fails to meet all three criteria, step away. The time spent waiting isn't wasted - it's when you protect your capital while others fall into the trap of "boredom trades."
Using Technology to Filter Out Trading Noise
The market churns out thousands of signals every day, but the reality is that most of these are false breakouts or low-probability setups that can chip away at your profits. This is where technology steps in, simplifying the process by automating how signals are validated. Instead of manually sifting through every condition, tools like NinjaTrader and MetaTrader can be programmed to execute trades only when specific, measurable criteria are met.
By converting subjective trading rules into clear, algorithmic instructions, you eliminate guesswork. For instance, rather than relying on a "gut feeling" about a trend's strength, you can set your system to act only when the ADX indicator surpasses 25. Similarly, automated risk controls, like circuit breakers, can enforce discipline by halting trading if losses hit a predefined limit. For example, if your daily loss reaches 3%, the system automatically stops trading, protecting you from emotional decisions during volatile sessions.
"Traders need to aggregate and filter through tremendous amounts of data quickly and will rely on technology to help if it is available." - Mike Khouw, CNBC Contributor
Another effective tool is ATR-based position sizing, which adjusts your trade sizes based on the Average True Range indicator. This approach keeps your risk level consistent across varying market conditions without requiring manual recalculations. You can also add a heartbeat script that notifies you of connectivity issues, ensuring your strategy stays operational during critical market moves.
Keep your automation straightforward. If your strategy relies on more than 5–6 parameters to be effective, it may be over-optimized, focusing on noise rather than meaningful signals. The primary goal is to automate your discipline - replicating the careful approach you’d take manually, but without the fatigue or emotional bias. To keep these automated systems running flawlessly, a reliable VPS (Virtual Private Server) is a must.
QuantVPS Compatibility for Automated Strategies
To support these automated processes, QuantVPS offers the stable infrastructure necessary to keep your trading systems online 24/7. Automation demands uninterrupted connectivity and minimal latency to ensure trades are executed on time - both critical for maintaining the disciplined trading rules outlined above. QuantVPS is compatible with platforms like NinjaTrader and MetaTrader, providing the dedicated resources needed for smooth operation.
For example, the VPS Pro plan costs $99.99 per month and includes 6 CPU cores, 16 GB of RAM, and 150 GB of NVMe storage. This setup can handle 3–6 trading terminals simultaneously, all with low latency. For traders managing multiple strategies or more complex setups, the VPS Ultra plan at $189.99 per month offers 24 cores, 64 GB of RAM, and the capacity to run 6–10 terminals across 5–7 charts. This kind of infrastructure ensures your automated filters execute seamlessly, even during high-volume trading sessions.
Testing and Optimizing Your Trade Frequency
Once you've set up automated filters, the next step is to backtest historical data. Why? To determine the ideal trade frequency that maximizes your net profit after factoring in costs. The aim is to find that "sweet spot" where you’re capturing enough trading signals to stay profitable - without letting transaction costs eat into your gains or allowing emotional biases to creep in.
Start by testing different timeframes, such as weekly, monthly, and quarterly rebalancing intervals. For example, weekly rebalancing might lead to excessive turnover that could wipe out your alpha, while quarterly adjustments tend to retain 70–80% of gross alpha. The choice of rebalancing frequency isn’t just a minor tweak - it directly impacts how well your strategy performs in different market conditions.
"The choice of rebalancing frequency is not a minor implementation detail. It is a first-order determinant of whether a strategy actually makes money." – Quant Decoded
Use at least a decade’s worth of data to ensure you’re accounting for a variety of market conditions. Don’t forget to include realistic costs like bid-ask spreads and market impact. A smart approach is threshold-based rebalancing, where trades are only triggered if a position drifts 5% or more from its target. This can cut turnover by 30–50%, helping you strike a balance between maintaining your strategy’s edge and keeping trading costs under control.
Using Equity Curve Simulators
Equity curve simulators are powerful tools for visualizing how your account balance might evolve under different trade frequencies. These simulators don’t just show potential returns; they also highlight the depth and duration of drawdowns. This is crucial for gauging whether a strategy aligns with your risk tolerance before you commit real money. For instance, a high-frequency strategy might deliver slightly higher returns but could also expose you to longer or deeper drawdowns, which can test your psychological resilience.
Simulators are also great for identifying flaws in strategies that generate frequent small wins but are vulnerable to rare, large losses. Running Monte Carlo resampling can further test how your returns might vary across different trade sequences. These insights reinforce the importance of focusing on quality over quantity when it comes to trades, paving the way for disciplined risk management. If your backtesting and simulations are resource-intensive, the QuantVPS Ultra plan, priced at $189.99 per month, offers the computing power needed to run these tasks smoothly and without interruptions.
Risk Management for Disciplined Trading
Trading Frequency Impact on Returns and Costs Comparison
Discipline in trading begins with position sizing: limit your risk to just 1–2% of your account on any single trade. Why? The math doesn't lie. Risking 1% per trade means you can withstand a series of losses without severely damaging your account. Compare that to risking 5%, which can quickly drain your capital after just a few bad trades.
Another essential tool is setting daily loss limits, which act like a safety net. A common guideline is to cap your daily loss at the amount you typically earn on an average winning day. For instance, if your average profit on a good day is $500, stop trading once you've lost $500. This way, one losing day can be offset by one winning day. For beginners, a 1–2% daily limit is recommended, while more experienced traders might stretch that to 3%. The key is to stop trading immediately once you hit your limit. These measures not only protect your account but also give you the space to reflect on how your trading habits - like trade frequency - affect your overall performance.
Stay online and closer to execution. Choose a VPS location for CME futures, New York markets, London FX, API trading, and more.
Host your platform near the market route that matters.
From $59.99/mo
"Your daily loss limit protects you from yourself at your worst. That's it." – Ansh Das
But these rules aren't just about saving money - they're about protecting your mindset. High-frequency trading can quickly sap your mental energy, leading to poor decision-making and fatigue. When losses pile up, the urge to "revenge trade" can be strong. Successful traders know this and reduce their trade frequency during losing streaks, focusing only on high-quality opportunities. In contrast, those who fail often increase their activity, chasing losses and risking their entire account. By sticking to these risk controls, you can avoid overtrading and maintain a sharper focus on trades that matter.
Trade Frequency Impact: A Comparison
These risk management principles also highlight the direct connection between trade frequency and overall returns. Contrary to what some might think, trading more often doesn't necessarily lead to better results. In fact, it often leads to higher costs. For example, weekly rebalancing can result in annual trading costs of 4.0–5.0%, which can erase almost all of your gross alpha, leaving you with minimal net returns. On the other hand, quarterly rebalancing strikes a better balance: lower turnover, reduced costs, and improved net performance.
| Rebalancing Frequency | Annual Turnover | Estimated Trading Costs | Net Alpha (Approx.) |
|---|---|---|---|
| High (Weekly) | 400–600% | 4.0–5.0% | 0.0–1.0% |
| Medium (Monthly) | 150–250% | 1.5–2.5% | 2.0–3.0% |
| Low (Quarterly) | 80–120% | 0.8–1.2% | 2.3–2.7% |
| Very Low (Yearly) | 30–50% | 0.3–0.5% | 1.5–1.7% |
This table underscores an important takeaway: success in the market comes from precision, not excessive activity. By aligning your trading frequency with solid risk management practices, you can focus on quality over quantity, prioritizing high-probability setups instead of chasing every opportunity. The goal isn’t to trade more - it’s to trade smarter.
How QuantVPS Supports Better Trading Results
When you're focused on trading less but aiming for higher-quality setups, having reliable infrastructure is non-negotiable. QuantVPS hosts its servers in Tier IV data centers located in Chicago, New York, and London. These centers provide sub-millisecond latency - just 0.52ms - to the CME Group exchange, thanks to direct fiber-optic cross-connects. This setup ensures your automated strategies execute smoothly and without interruptions.
For traders using low-frequency strategies, uptime is essential. QuantVPS guarantees 99.999% uptime, equating to only about 5.26 minutes of downtime annually. As of March 2026, it has maintained 100% uptime over the past 180 days. This reliability is achieved through N+1 redundancy, continuous AI-powered monitoring, and private financial networks that bypass public internet congestion. Even during volatile market periods, these features prevent micro-outages (100–200ms) from causing order rejections.
QuantVPS also optimizes its hardware for trading performance. With AMD Ryzen 7950X3D CPUs and DDR5 ECC RAM, the platform minimizes execution delays during high-volatility events like CPI or NFP releases. Reviews on Trustpilot, averaging 4 out of 5 stars from over 64 users, highlight its fast execution speeds for Rithmic-connected futures and stable performance during news-driven market swings. Additionally, QuantVPS supports a wide range of trading platforms, including NinjaTrader 8, MetaTrader 4/5, Tradovate, TradeStation, Sierra Chart, MultiCharts, and Interactive Brokers TWS, ensuring compatibility with your automated strategies.
For the best results, traders should use the Chicago server for CME futures, while the New York (Equinix NY4) and London (LD4) servers are ideal for Forex trading [29, 30]. Before committing, tools like tracert can help verify your broker's live server location, further reducing latency and improving order execution accuracy. Selecting the right plan based on your trading needs ensures optimal performance and reliability.
Choosing the Right QuantVPS Plan
QuantVPS offers several plans tailored to different trading requirements:
| Plan | CPU Cores | RAM | Trading Capacity | Monthly Price | Annual Price (per month) | Best Use Case |
|---|---|---|---|---|---|---|
| VPS Lite | 4 Cores | 8 GB | 1–2 charts / 1–3 terminals | $59.99 | $41.99 | Ideal for beginners or small-scale automation with minimal chart usage |
| VPS Pro | 6 Cores | 16 GB | 3–5 charts / 3–6 terminals | $99.99 | $69.99 | Perfect for professional traders running multiple strategies or setups |
| VPS Ultra | 12–24 Cores | 32–64 GB | 5–7 charts / 6–10 terminals | $189.99 | $132.99 | Best for intensive setups with moderate backtesting or multiple strategies |
| Dedicated | 12–16+ Cores | 128 GB | 7+ strategies | $299.99 | $209.99 | Designed for institutional-grade trading or complex algorithmic strategies |
For traders prioritizing performance without overspending, the VPS Pro plan is a great option. At $69.99 per month with annual billing, it offers enough resources to handle multiple charts and terminals efficiently. Annual billing can save you about 20%, and applying coupon codes like "AFF30" can further reduce costs by nearly 50%.
Conclusion
Trading less doesn’t mean sitting idle - it’s about focusing on what truly counts. As highlighted earlier, the least active traders earned an annual return of 18.5%, compared to 11.4% for the most active traders - a difference largely caused by transaction costs like commissions, slippage, and market noise. Extra trades don’t just eat into profits; they also dilute focus and decision-making.
To move forward, prioritize trades with high-probability setups that meet well-defined criteria. Use tools like automated alerts and scanners to filter out distractions, backtest your strategies to determine the ideal trade frequency, and streamline your decision-making process to maintain your statistical edge. These steps lay the groundwork for consistent, disciplined trading.
Combining thorough testing with strict risk management strengthens this selective approach. Technology can transform trading into a more deliberate and calculated process. For example, equity curve simulators let you test strategies effectively, while a reliable trading infrastructure ensures smooth execution. Data from Funded Trader Markets reveals a key insight: successful traders scale back their activity during drawdowns, while less successful traders tend to increase it.
Think of cash as a strategic resource. Reserve it for setups that genuinely justify the risk. Remember, precision always outperforms activity. By trading less but trading smarter, you’re not missing out - you’re building a disciplined edge that leads to sustainable success.
FAQs
How do I know if I’m overtrading?
If you’re trading more frequently than your strategy or the market conditions call for, you might be overtrading. Other signs include making decisions driven by emotions rather than sticking to a clear plan or disregarding the rules you’ve set for yourself. You might also notice patterns like entering trades without solid setups, ramping up trades after experiencing losses, or feeling restless or anxious when you’re not actively trading. Spotting these habits is the first step toward staying disciplined and achieving better trading outcomes.
What’s a simple checklist for high-probability setups?
- Start with higher timeframes: Check if the broader trend supports your trade idea. For instance, if you're planning a short trade, ensure the daily and 4-hour charts show a bearish trend.
- Look for confluence factors: Pinpoint areas where multiple signals overlap. This could include supply zones or bearish order blocks aligning at a particular price level.
- Wait for confirmation: Don’t jump in too early. Let the price action validate your setup, such as through a rejection or a specific candle pattern that aligns with your strategy.
How can I find my best trade frequency with backtesting?
To pinpoint the best trade frequency for your strategy, start by backtesting at least 100 historical trades. Focus on key metrics such as win rate, profit factor (a value of 1.5 or higher is ideal), and maximum consecutive losses. Make sure your strategy proves profitable across different market conditions. Once you've done this, move on to forward testing with a minimum of 20 trades to confirm your findings. This step-by-step process helps you fine-tune your approach and identify the trade frequency that consistently works best.


