
Continuous futures data simplifies trading analysis by merging multiple futures contracts into a single, seamless dataset. This eliminates artificial price jumps caused by futures rollovers and ensures accurate backtesting, long-term trend analysis, and technical indicator calculations. Here's what you need to know:
- What it is: A synthetic price series combining individual futures contracts into one continuous dataset.
- Why it matters: Avoids misleading price gaps, improves backtesting accuracy, and enables long-term analysis.
-
Key methods:
- Front-month roll: Switches to the next contract at a fixed date.
- Volume-based roll: Switches when the next contract's liquidity surpasses the current one.
- Adjustment techniques: Back-adjusted for trend-following, ratio-adjusted for percentage returns, or perpetual for smooth transitions.
While continuous data is essential for analysis, it cannot be traded directly. Use it for strategy development within automated futures trading systems and rely on individual contracts for execution. Properly constructed continuous data ensures your trading decisions are based on accurate and reliable insights.
What Is Continuous Futures Data and Why CME Traders Need It

What Continuous Futures Data Is and What It Does
Continuous futures data is a synthetic price series created by combining multiple monthly or quarterly futures contracts into one seamless dataset. Unlike stocks, which can be traded indefinitely, futures contracts have a set expiration date - usually around 90 days of high liquidity. For any given asset, several contracts may trade at the same time, each with its own expiration date.
The challenge comes when trying to merge these contracts. If contracts are simply joined together without adjustment, pricing differences caused by market conditions like contango or backwardation can create artificial price jumps. For example, unadjusted data may show sudden and misleading price gaps at roll dates, distorting analysis.
Continuous futures data solves this issue by applying mathematical adjustments when switching between contracts. These adjustments account for price differences at roll dates, smoothing out the data and creating a consistent series that better reflects actual market behavior.
Benefits for CME Traders
For CME traders, continuous futures data offers several key advantages that go beyond its basic definition.
One major benefit is the ability to calculate long-term technical indicators. Indicators like a 200-day moving average require historical data that extends far beyond the lifespan of a single futures contract. Without continuous data, building such indicators would be nearly impossible.
Another advantage is improved backtesting accuracy. For example, an analysis of the "Skewness Effect" strategy in Lean Hogs futures initially showed poor results when using spliced, unadjusted data. However, when a first-of-month roll method with backward ratio adjustment was applied, the strategy consistently delivered profitable outcomes. This highlights how unadjusted data can misrepresent strategy performance, leading to flawed conclusions.
In addition, continuous data simplifies data management. Instead of manually switching between expiring contracts in charting tools or backtesting software, traders can work with a single, uninterrupted dataset. For instance, creating a continuous price series for Coffee futures dating back to 1973 involves merging roughly 253 individual contracts. Doing this manually would be a daunting task, but continuous data eliminates the need for such effort.
Active Contract vs. Front Contract Methods
When constructing continuous futures data, the choice of method - front contract or active contract - can significantly impact trading strategies.
The front-month contract is the one closest to expiration and typically has the highest liquidity and open interest. Traders often prefer it for its tighter spreads and better execution. On the other hand, the active contract method involves switching to the next contract earlier, usually when its volume or open interest surpasses that of the front-month contract. While these methods often align, they can differ in certain markets, such as interest rate or agricultural futures.
| Method | Roll Trigger | Best For | Key Consideration |
|---|---|---|---|
| Front Contract | Fixed date (e.g., last trading day) | Standardized backtesting | May roll during periods of low liquidity |
| Active Contract | Volume or open interest threshold | Capturing actual market flow | Requires real-time liquidity monitoring |
The choice between these methods affects how traders incorporate continuous data into their analysis and strategies, making it essential to select the most suitable approach for their specific goals.
How Continuous Futures Contracts Are Built
Run 24/7 while you sleep. Keep bots, platforms, and trade copiers online on a dedicated VPS.
Low-latency VPS hosting for your trading platform.
From $59.99/mo
Continuous Futures Adjustment Methods Comparison for CME Traders
This section dives into how individual futures contracts are combined into a continuous series, using specific roll and adjustment techniques to ensure data accuracy.
Rollover Rules: Date-Based vs. Volume-Based Methods
Creating continuous futures data involves two key decisions: when to roll from one contract to the next and how to handle price discrepancies during the transition. The rollover rule defines the exact timing of the switch, which directly impacts the quality of the data.
For traders on the CME, selecting the right rollover rule is essential to avoid distorting the data, especially when trading the most liquid futures contracts. Date-based methods rely on a set calendar schedule. The last-trading-day approach keeps traders in the front-month contract as long as possible but risks reduced liquidity when trading shifts earlier. Another option, the first-of-month method, rolls contracts on the first business day of the delivery month. While predictable and straightforward, it doesn't account for actual market activity. Some platforms, like TradeStation, use specific intervals - for example, rolling S&P 500 contracts six trading days before expiration.
Volume-based methods, on the other hand, focus on market activity rather than the calendar. These methods typically roll when the back-month contract's open interest or volume surpasses the front-month's . This approach matches market dynamics and ensures the subsequent adjustment methods reflect the most liquid contract. For Coffee futures (NYI), liquidity often drops about 27 days before expiration, making this a common roll point to avoid low-liquidity conditions that could disrupt price discovery.
"The basic mechanism of how to roll futures data is to get a collection of individual futures contracts and join them together at specific key dates throughout history."
- Arthur Maddock, CEO, PortaraCQG
Back-Adjustment Methods
Simply merging contracts without adjustments can lead to artificial price gaps, which can mislead analysis. For instance, in June 2021, a VIX futures series showed a 14.8% price jump on the roll date when contracts were spliced together, even though the actual market shift in the new contract was only 0.3%. Back-adjustment methods help smooth these gaps, ensuring the data remains reliable for backtesting and analysis.
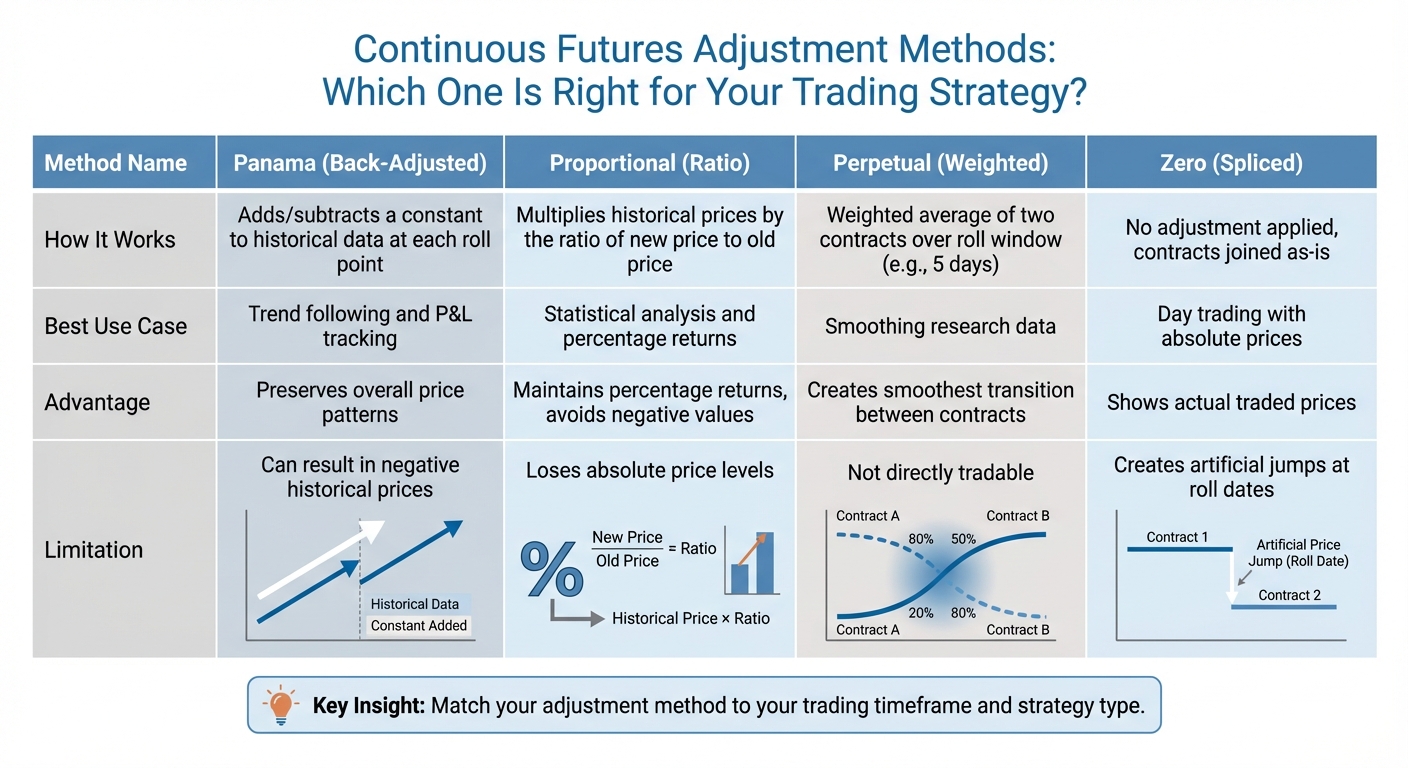
The Panama (back-adjusted) method shifts all historical prices by adding or subtracting a constant at each roll point. For example, if the new contract is $2.00 higher than the old one, all prior prices are adjusted upward by $2.00. This method preserves the overall price pattern, making it ideal for futures trading strategies like trend-following. However, during volatile periods, cumulative adjustments can sometimes push historical prices into negative territory .
The proportional (ratio) method adjusts historical prices by multiplying them by the ratio of the new price to the old price . This method maintains percentage returns and avoids negative values, making it suitable for statistical and volatility studies. However, it sacrifices absolute price levels in the process .
The perpetual (weighted) method creates a smooth transition by applying a weighted average of two contracts over a roll window, such as five days . For example, on the first day, the price might be 80% of the far contract and 20% of the near contract. By the fifth day, the series fully reflects the far contract. While this method produces the smoothest series, it doesn't represent a tradable instrument .
| Adjustment Method | Mechanism | Best For | Key Limitation |
|---|---|---|---|
| Panama (Back-Adjusted) | Adds/subtracts a constant to data | Trend following and P&L tracking | Can result in negative prices |
| Proportional (Ratio) | Multiplies data by price ratio | Statistical analysis and returns | Loses absolute price levels |
| Perpetual (Weighted) | Weighted average over roll window | Smoothing research data | Not directly tradable |
| Zero (Spliced) | No adjustment applied | Day trading with absolute prices | Creates artificial jumps at roll dates |
How Volume and Open Interest Are Mapped
After adjustments, accurately mapping volume and open interest is essential to ensure the continuous series reflects real market activity.
Volume and open interest data highlight which contract best captures trading activity. When constructing continuous data, these metrics are carefully tracked to avoid reflecting thin or illiquid conditions. For markets like Coffee, where multiple contracts are involved, monitoring volume shifts is especially important. Professional traders often rely on detailed audit trails that document roll dates and adjustment values. This transparency allows them to verify whether the historical data aligns with actual market conditions or has been skewed during the construction process.
"Incorrect continuous futures contracts can very easily transform into incorrect backtest... the usage of the spliced dataset would probably lead to wrong decisions."
- Radovan Vojtko, Head of Research, Quantpedia
How to Use Continuous Futures Data for CME Trading
Building on the methods discussed earlier, continuous futures data plays a crucial role in several trading applications. Its true strength lies in three main areas: conducting accurate backtests, analyzing long-term trends, and integrating clean data into daily trading workflows.
Backtesting and Strategy Validation
Raw futures contracts often introduce misleading price gaps. When contracts are stitched together without proper adjustments, price differences between the expiring contract and the new one can create artificial signals. For instance, a continuous VIX Futures series without adjustments might display gaps that could mislead backtests. A trading model using this unadjusted data might show profits or losses that wouldn’t occur in actual trading.
Continuous data eliminates these distortions, allowing technical indicators - like a 200-day moving average - to work correctly over extended periods. For trend-following strategies, back-adjusted data is widely used because it removes gaps while maintaining the overall price action across different contract months. If your strategy prioritizes percentage returns over absolute price levels, ratio-adjusted data ensures those returns stay intact without introducing negative historical prices.
By ensuring backtesting accuracy, continuous data also provides a solid foundation for effective trend analysis.
Using Continuous Data for Trend Analysis
Continuous futures data allows traders to identify trends more precisely over long periods. Without proper adjustments, market conditions like contango or backwardation can distort profitability, making a winning strategy appear unprofitable due to cumulative price jumps at each contract roll.
Matching your data to your trading timeframe is essential. For medium-to-long-term trend-followers, back-adjusted data preserves the natural price patterns needed to identify entry and exit points across multiple months. If your focus is on statistical measures or volatility-based trends, proportional adjustments ensure percentage returns remain accurate - exactly what your models rely on. For example, when liquidity in Coffee futures declines 27 days before expiration, a well-constructed continuous series will have already transitioned to the next contract, ensuring your analysis reflects the active market rather than a thinning one.
How to Integrate Continuous Data into Trading Workflows
Incorporating continuous data into your daily trading routine requires understanding a fundamental rule: Continuous contracts are for analysis only. You cannot execute trades directly on these contracts. Instead, use continuous data for generating signals and backtesting, while executing trades on the specific contracts your data tracks.
Start by choosing an adjustment method that aligns with your trading strategy. Use back-adjusted data for directional strategies where accurate price patterns are critical. Opt for ratio-adjusted data if your focus is on volatility or Value at Risk calculations. Instead of rolling contracts on fixed calendar dates, consider liquidity-based rollovers, transitioning to the back-month contract when it surpasses the front-month in trading activity. This ensures your data reflects the most liquid market conditions, avoiding distortions caused by thinly traded contracts.
Maintain a data audit trail that records each roll, the price spreads at those points, and any cumulative adjustments applied. This transparency helps verify whether unusual historical values stem from legitimate adjustments or data errors. For intraday traders, ensure your continuous intraday data is rolled based on daily settlement prices. This alignment ensures that intraday price movements match daily charts, preventing signals from breaking down when switching between timeframes.
Best Practices for Working with Continuous Futures Data
Understanding how continuous futures data is constructed and applied is only half the battle. Following these best practices ensures your analysis remains accurate and reliable.
Choosing the Right Rollover Method
The first step is selecting a rollover method that aligns with your asset type and trading strategy. For stock indices with predictable expiration dates, scheduled rollovers are often the best fit. On the other hand, for commodities like coffee, it’s better to roll early - around 27 days before expiration - when liquidity begins to drop.
When it comes to data adjustments:
- Back-adjusted data works well for analyzing long-term trends.
- Ratio adjustments are useful for measuring percentage returns.
- Zero-adjusted data is ideal for short-term analysis.
Stay online and closer to execution. Choose a VPS location for CME futures, New York markets, London FX, API trading, and more.
Host your platform near the market route that matters.
From $59.99/mo
Timing your rollovers is equally important. A good rule of thumb is to switch when the volume or open interest of the back-month contract surpasses that of the front-month contract. This approach ensures you’re always tracking the most liquid market.
Keeping Technical Analysis Consistent
Technical indicators, like a 200-day moving average, require more historical data than a single futures contract typically provides (which is often limited to about 90 days). Without continuous data, your analysis risks being incomplete, especially at rollover points where artificial price jumps can distort results.
To maintain consistency:
- Use back-adjusted data for trend-following indicators that depend on price patterns.
- Opt for ratio adjustments for indicators based on percentage returns rather than absolute prices, as this avoids unnecessary distortions.
- If you’re working with both daily and intraday data, ensure your continuous intraday series rolls are based on settlement prices. This alignment prevents breakdowns in signals when switching between timeframes.
By smoothing out rollovers and ensuring your indicators remain stable, you can maintain the accuracy of your analysis over time.
Tracking Adjustments and Historical Data
Accurate documentation of roll adjustments is critical for backtesting and strategy evaluation. Keep a detailed audit trail that records each roll’s contract, date, price spread, and cumulative adjustment. This ensures that any unusual values in your data can be traced back to legitimate adjustments rather than errors.
It’s important to note that back-adjustments are cumulative. The further back you go in your historical data, the more each contract is adjusted by the sum of all subsequent roll gaps. Negative values in back-adjusted series are normal - they reflect the cumulative cost of carry over time and do not indicate faulty data.
To stay on top of these transitions:
- Use features in your charting software like "Show Rollover Dates" or "Ratio Adjustment Points" to visually mark where rollovers occurred.
- Regularly compare your continuous intraday data with daily datasets to ensure they align and haven’t been distorted by non-settlement roll methods.
Limitations and Considerations When Using Continuous Futures Data
Continuous futures data is a powerful tool for analysis, but it comes with some important caveats that traders need to keep in mind. If you're trading on the CME or any other exchange, understanding these limitations can help you avoid costly mistakes. Let’s take a closer look at three primary challenges: non-tradability, synthetic pricing from back-adjustments, and liquidity issues.
Continuous Futures Cannot Be Traded
While continuous contracts are excellent for analysis, they are not tradable. These contracts are designed purely for market data purposes - they don't update orders on futures contracts. You can use them to spot trends, test strategies, or calculate indicators. But when it’s time to place a trade, you’ll need to work with a specific contract month. The execution of trades always depends on active, individual contract months rather than the continuous data series.
How Back-Adjustments Impact Historical Prices
One major drawback of continuous futures data is the use of back-adjustments, which create synthetic historical prices. These prices don’t reflect actual market transactions. Over time, the cumulative nature of these adjustments can distort historical data, especially in volatile markets. In extreme cases, this can even result in negative historical prices. While this approach is helpful for trend analysis, it falls short when calculating actual historical profit and loss.
Liquidity Differences in Actual Trading
Another issue lies in the difference between continuous data assumptions and real-world market liquidity. Continuous data often assumes smooth rollovers between contracts, but actual market conditions are rarely that simple. For instance, Coffee futures tend to experience a sharp drop in liquidity about 27 days before expiration. Even though a continuous series might suggest active trading up to the expiration date, the reality can include wide bid-ask spreads and thin order books, making it difficult to execute trades at the indicated prices.
"In the last 3 weeks where the contract was still open; it offered little in the way of liquidity except 'traps' for the unwary trader. If your continuous data isn't created without taking this into account, you may find what appear at first site to be valid rolls are in fact absolutely not." - Arthur Maddock, CEO, PortaraCQG
Understanding these limitations is essential for any trader using continuous futures data. While it’s a valuable resource for analysis, it’s not a substitute for the precision and realism required in actual trading.
Conclusion
Throughout this guide, we've explored how continuous futures data transforms fragmented contract information into a unified, actionable dataset. For CME traders, this type of data is a game-changer - it allows you to craft testable strategies by converting a series of short-lived contracts into a single, uninterrupted time series. This approach makes long-term trend analysis and reliable backtesting possible, eliminating the artificial price jumps that can otherwise skew strategy performance.
It's important to note that continuous data is meant for analysis and research purposes - not for executing trades. By smoothing out the noise caused by contract rollovers, it provides a clearer view of market behavior over time. Whether you're testing a new algorithm with Backtrader or examining multi-year trends, continuous futures data gives you the historical clarity needed to make informed decisions.
When working with continuous data, selecting the right adjustment method is key. Back-adjustments are ideal for maintaining absolute price levels, while proportional adjustments are better suited for calculating accurate percentage returns. Additionally, rolling contracts based on volume or open interest - rather than fixed calendar dates - ensures your data reflects the most liquid and tradeable periods of each contract.
The techniques and best practices outlined here simplify your workflow and enhance your trading strategies. By using continuous futures data effectively, you can focus more on developing strategies and less on the logistical challenges of managing contract expirations. Just keep the limitations in mind, and you'll be well-equipped to integrate this tool into your CME trading routine.
FAQs
What is continuous futures data, and how does it help CME traders with backtesting?
Continuous futures data combines individual futures contracts into one seamless price series. This method adjusts for rollovers and expiration dates, eliminating gaps or inconsistencies in the data. For CME traders, this is especially important for accurate backtesting, as it offers a more complete view of historical price trends and allows strategies to be tested under realistic market conditions.
Using continuous data helps traders evaluate strategies more effectively, pinpoint potential flaws, and fine-tune their approach. By removing distortions caused by contract transitions, it provides clearer insights and supports better decision-making in futures trading.
What’s the difference between front-month and volume-based roll methods in futures trading?
The front-month and volume-based roll methods differ primarily in how they determine the timing for rolling over a futures contract to the next one.
The front-month method sticks to a specific point in the contract's lifecycle, typically just before it expires. This ensures traders are consistently working with the most liquid, near-term contract - commonly referred to as the front-month contract.
On the other hand, the volume-based roll method takes a more dynamic approach. Instead of following a fixed schedule, it rolls contracts when the trading volume of the next contract surpasses that of the current one. By focusing on trading activity, this method prioritizes liquidity and aims to minimize slippage, adjusting to market conditions as they change.
While the front-month method is straightforward and widely adopted, it can sometimes lead to higher costs or liquidity issues as the contract approaches expiration. The volume-based method, with its flexibility, is often favored for improving trading efficiency and ensuring accuracy during backtesting.
Why is continuous futures data not tradable directly on the CME?
Continuous futures data isn’t something you can trade directly on the CME. Why? Because it’s a synthetic dataset. It’s created by stitching together prices from multiple individual futures contracts into one seamless price series. The purpose here isn’t trading - it’s analysis. Think backtesting strategies or refining workflows.
On the CME, each futures contract has its own expiration date and specific features, making them unique and tradable instruments. Continuous data, however, is all about giving traders a smoother historical view of market trends. By eliminating the interruptions caused by contract expirations or rollovers, it helps traders fine-tune their strategies without the usual hiccups.


