
The Ichimoku Cloud is a trading tool that combines trend, momentum, and support/resistance analysis into one system. Developed in the 1930s by Goichi Hosoda, it uses five key components to provide a clear market overview:
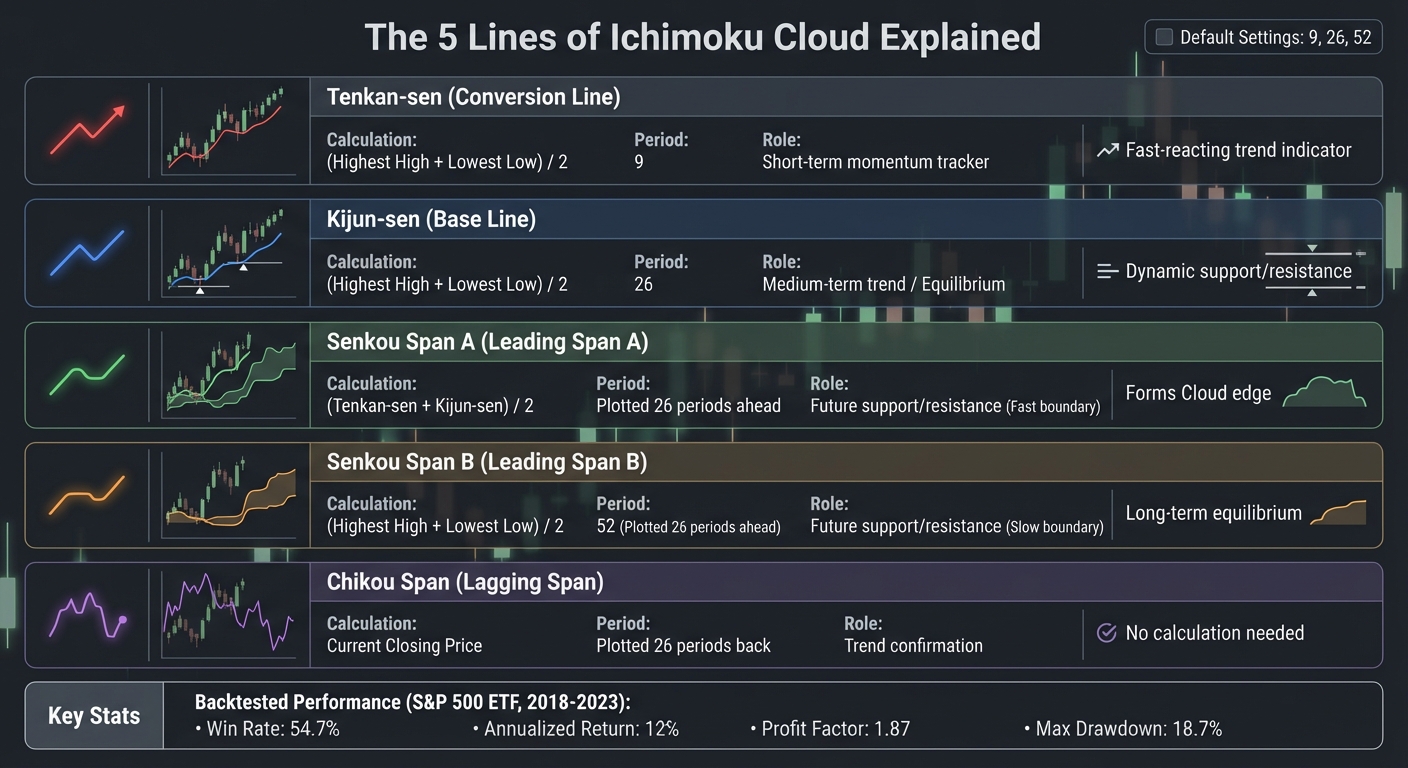
- Tenkan-sen (Conversion Line): Tracks short-term momentum (9-period midpoint).
- Kijun-sen (Base Line): Indicates medium-term trends (26-period midpoint).
- Senkou Span A & B (Cloud): Projects future support/resistance levels.
- Chikou Span (Lagging Span): Confirms trends by comparing current prices to past ones.
When the price is above the Cloud, it signals an uptrend; below the Cloud, a downtrend. Crossovers between the Tenkan-sen and Kijun-sen, combined with Cloud position and Chikou Span alignment, help traders identify entry and exit points. The Cloud's thickness and color also provide insight into market strength and potential reversals.
Backtests show that strategies using the Ichimoku Cloud can yield solid results, such as a 54.7% win rate and 12% annualized return on the S&P 500 ETF (2018–2023). It’s widely used across markets, including forex and crypto, and is often cited among the best indicators for day trading for its ability to filter out noise and highlight key trends. The system’s default settings (9, 26, 52) remain effective even in modern trading environments.
This tool works best in trending markets but requires caution during consolidation or high volatility. By mastering its components and applying disciplined risk management, you can make smarter trading decisions.
Understanding the 5 Lines of the Ichimoku Cloud
Ichimoku Cloud 5 Components: Calculation Formulas and Trading Roles
Let’s break down the five key components of the Ichimoku Cloud to better understand their calculations and how they contribute to market analysis. Each line plays a distinct role, and together, they provide a complete view of trends, momentum, and potential support or resistance levels. Knowing how these lines interact is essential for using the Ichimoku Cloud effectively in trading.
Tenkan-sen (Conversion Line)
The Tenkan-sen is calculated by averaging the highest high and lowest low over the last 9 periods. Its purpose is to track short-term momentum and quickly respond to day trading patterns and price changes.
This line acts as an immediate trend indicator. An upward slope signals growing bullish momentum, while a flat or downward slope suggests weakening or bearish pressure. In strong trends, prices often retrace to this line before continuing their movement, making it a useful reference for short-term trading decisions.
Kijun-sen (Base Line)
The Kijun-sen reflects medium-term trends and is calculated as the midpoint of the highest high and lowest low over the past 26 periods. It’s less reactive than the Tenkan-sen, offering a steadier view of the market.
This line often acts as dynamic support or resistance. When prices stray too far from the Kijun-sen, they tend to revert back, making it a "fair value" marker. For instance, on November 18, 2025, Kelvin Wong from OANDA noted a Tenkan/Kijun pullback on the USD/JPY hourly chart. The pair, in an uptrend, retraced to the Kijun-sen before resuming its bullish direction, providing a clear long-entry signal.
Senkou Span A (Leading Span A)
Senkou Span A is derived by averaging the Tenkan-sen and Kijun-sen, then projecting the result 26 periods into the future. This line forms the faster boundary of the Cloud.
A bullish twist occurs when Span A crosses above Span B, signaling a potential uptrend in advance. A bearish twist happens when Span A moves below Span B, hinting at a downward shift.
Senkou Span B (Leading Span B)
Senkou Span B represents long-term equilibrium and is calculated using the midpoint of the highest high and lowest low over the past 52 periods. Like Span A, it is projected 26 periods forward, forming the slower boundary of the Cloud.
Run 24/7 while you sleep. Keep bots, platforms, and trade copiers online on a dedicated VPS.
Low-latency VPS hosting for your trading platform.
From $59.99/mo
The space between Span A and Span B creates the Cloud (Kumo). A thick Cloud indicates stronger support or resistance, while a thinner Cloud suggests weaker barriers that prices can break through more easily. For example, on November 26, 2025, the AUD/USD pair broke above its Ichimoku Cloud on the hourly chart. Traders confirmed the bullish setup when Span A crossed above Span B, signaling a strong upward trend.
Chikou Span (Lagging Span)
The Chikou Span is unique because it doesn’t involve any calculations. It simply plots the current closing price 26 periods back, providing a visual comparison of today’s price against past price action.
Traders use this line for confirmation. A bullish breakout is more reliable when the Chikou Span is above the price candles from 26 periods ago, while bearish signals are stronger when it’s below past price levels.
| Component | Calculation Formula | Standard Period | Primary Role |
|---|---|---|---|
| Tenkan-sen | (Highest High + Lowest Low) / 2 | 9 | Short-term momentum |
| Kijun-sen | (Highest High + Lowest Low) / 2 | 26 | Medium-term trend / Equilibrium |
| Senkou Span A | (Tenkan-sen + Kijun-sen) / 2 | Plotted 26 periods ahead | Future support/resistance (Fast) |
| Senkou Span B | (Highest High + Lowest Low) / 2 | 52 (Plotted 26 periods ahead) | Future support/resistance (Slow) |
| Chikou Span | Current Closing Price | Plotted 26 periods back | Trend confirmation |
How to Read Price-Cloud Relationships
The relationship between price and the Ichimoku Cloud reveals whether a market is trending upward, downward, or moving sideways. Decoding these patterns helps traders determine the right moments to enter, exit, or wait.
Bullish and Bearish Setups
When the price is above the Cloud, it's a signal of a bullish trend, with the Cloud acting as a support zone. On the flip side, price below the Cloud indicates a bearish trend, where the Cloud becomes a resistance barrier. The Cloud's color provides extra context: a green Cloud (Senkou Span A above Senkou Span B) suggests bullish momentum, while a red Cloud leans bearish.
For example, on November 18, 2025, the USD/JPY hourly chart confirmed a bullish trend with a close above the Kijun-sen.
These insights set the stage for making strategic trading decisions, which will be explored in later sections.
Note: All time references have been adjusted to Eastern Time (ET) for U.S. readers.
Cloud Color and Thickness
The color of the Cloud offers a glimpse into potential market sentiment. A green Cloud points to bullish conditions, while a red Cloud hints at bearish tendencies. A "twist", where Senkou Span A crosses Senkou Span B, changes the Cloud's color and signals a potential shift in the market's forward structure.
"The cloud is a trend map, not a prediction engine. When the map describes a region with no clear road, the signals degrade."
- Trends and Breakouts
The Cloud's thickness measures the strength of support or resistance. A thick Cloud suggests a broad trading range with high volatility, making breakouts more impactful. A thin Cloud, however, reflects weaker support or resistance, allowing price to move through it more easily.
| Cloud Characteristic | Market Interpretation | Trading Implication |
|---|---|---|
| Thick Cloud | High volatility; strong support/resistance | Harder to break; significant if price penetrates |
| Thin Cloud | Low volatility; weak support/resistance | Easier to breach; less reliable for pullbacks |
| Cloud Twist | Potential trend change or transition | Signals structural shift; wait for confirmation |
| Price Inside Cloud | Market equilibrium; sideways movement | Avoid new trades; wait for breakout |
These visual cues are critical for understanding the market before analyzing transitional phases.
Transition Zones and Consolidation
When price moves within the Cloud, the market is in a state of balance, often leading to sideways, choppy movement.
"When price action is trapped within the Kumo, the market is considered to be in a state of equilibrium or 'no-man's land,' often resulting in choppy, sideways movement."
- FXNX
For instance, the AUD/USD pair demonstrated this behavior from November 24, 2025, 10:00 PM ET to November 25, 2025, 11:00 AM ET. During this time, the pair traded sideways inside the Cloud. Later, at 12:00 PM ET on November 25, the price broke above the Cloud, marking a shift from consolidation to a minor uptrend. This move was confirmed at 3:00 PM ET when Senkou Span A crossed above Senkou Span B.
Avoid initiating trades when the price is stuck within the Cloud. Instead, wait for a decisive candle close outside the Cloud's boundaries. It's also worth noting that the default Ichimoku settings of 9, 26, and 52 are widely used by institutional trading algorithms, often making the support and resistance levels they define highly influential in the market.
Trading Strategies Using the Ichimoku Cloud
The Ichimoku Cloud is a versatile tool that combines several indicators to help traders identify trends, entry points, and risk levels. Here's how you can build trading strategies around it.
Line Crossovers as Entry Signals
The Tenkan-sen/Kijun-sen crossover is a key signal for entering trades. A bullish signal occurs when the Tenkan-sen crosses above the Kijun-sen, and a bearish signal happens when it crosses below. The location of the crossover matters:
- Above the Cloud: Indicates strong bullish momentum.
- Below the Cloud: Signals strong bearish momentum.
- Inside the Cloud: Often leads to indecisive or choppy moves, making signals less reliable.
To confirm the validity of these signals, check the Chikou Span. For a buy signal, the Chikou Span should be above prior prices. For a sell signal, it should be below.
Backtesting this strategy (Tenkan-sen/Kijun-sen Cross + Cloud Alignment + Chikou Confirmation) on the S&P 500 ETF (SPY) from 2018–2023 showed promising results: a 54.7% win rate, a profit factor of 1.87, an annualized return of 12.0%, and a maximum drawdown of 18.7%. Exits are triggered when the Tenkan-sen crosses back in the opposite direction or when price closes beyond the Kijun-sen against your position.
Next, let’s refine entry timing with pullback strategies.
Pullback-Based Entry Strategies
In trending markets, the Kijun-sen often acts as a fair value zone, where price tends to pause or pull back before resuming the trend. This makes it an excellent point for entries.
- Bullish pullback entry: Ensure the price is above the Cloud and the Tenkan-sen is above the Kijun-sen. Wait for the price to touch or slightly dip below the Kijun-sen, then enter when a candle closes back above it.
- Bearish pullback entry: Reverse the conditions - price below the Cloud, Tenkan-sen below the Kijun-sen. Enter when a candle closes back below the Kijun-sen after a pullback.
For example, on November 18, 2025, at 8:00 AM ET, USD/JPY was in a minor uptrend, with price above a green Cloud and the Tenkan-sen above the Kijun-sen. At 12:00 PM ET, the price pulled back to the Kijun-sen. A bullish entry signal was confirmed when the hourly candle closed above the Kijun-sen at 1:00 PM ET, followed by a continuation of the trend.
Stay online and closer to execution. Choose a VPS location for CME futures, New York markets, London FX, API trading, and more.
Host your platform near the market route that matters.
From $59.99/mo
After identifying entry points, managing risk becomes crucial.
Stop-Loss and Risk Management
The Ichimoku Cloud provides clear visual cues for managing risk. Use the Kijun-sen as a trailing stop and place stop-loss levels slightly inside or beyond the Cloud. To maintain proper risk control, aim for at least a 1:2 risk-reward ratio and calculate your position size using the formula:
Position size = Maximum risk ÷ Stop-loss distance.
"The Ichimoku Cloud helps you manage risk by clearly defining support and resistance zones. The cloud itself, along with the Kijun-sen line, provides visual cues for placing entries, exits, and stop-loss orders."
- FXNX
For exits, you can choose between conservative and aggressive approaches. A conservative exit occurs when the Tenkan-sen and Kijun-sen cross in the opposite direction. An aggressive exit involves waiting for the price to break completely through the Cloud, which allows you to capture longer trends but may result in giving back more profits.
Lastly, consider the Cloud thickness before entering trades. A thick Cloud signals stronger support or resistance, indicating a more stable trend. In contrast, a thin Cloud suggests weaker levels and potential consolidation.
Using Ichimoku in Different Market Conditions
Fine-tuning Ichimoku strategies to suit varying market conditions is key to using the system effectively. Whether the market is trending, ranging, or highly volatile, Ichimoku's components can help you navigate price movements, avoid misleading signals, and focus on meaningful opportunities.
Trending Markets
In trending markets, the Ichimoku Cloud truly shines. The basics are straightforward: if the price is above the Cloud, it suggests a bullish trend, while price below the Cloud indicates a bearish trend. For added confirmation, check that the Tenkan-sen is above the Kijun-sen in bullish trends (and below in bearish trends) and that the Chikou Span is positioned above prior prices.
Start with the Daily chart to determine the overall trend direction. Once the trend is clear, switch to shorter timeframes, like the 4-hour or 1-hour charts, to find precise entry points that align with the broader trend.
However, when the market lacks a clear trend and shifts into a range, Ichimoku's signals require a different approach.
Ranging Markets
When the price moves within the Cloud, it signals a state of balance, often accompanied by sideways movement. In these conditions, Ichimoku tends to lose its edge. To improve accuracy, consider incorporating a momentum oscillator, such as the RSI, to identify overbought or oversold zones near range boundaries.
The safest strategy in ranging markets is to wait for the price to break out of the Cloud, signaling the start of a new trend. If you decide to trade within the range, use the Combined Method, ensuring that the Chikou Span confirms the signal to minimize false entries. Pairing Ichimoku with additional tools like momentum indicators can help refine your decisions until a clearer trend emerges.
Volatile markets, on the other hand, demand a different set of adjustments to handle rapid price swings.
Volatile Markets
In highly volatile markets, the Ichimoku Cloud acts as a filter, separating significant price movements from background noise. A thick Cloud indicates strong support or resistance levels, making breakouts more meaningful. Conversely, a thin Cloud suggests weaker levels, increasing the likelihood of false breakouts or "whipsaws."
To trade effectively in volatile conditions, wait for decisive Cloud breakouts before entering a position. Use ATR-based stops (e.g., 2.0× ATR) to account for larger price swings. Multi-timeframe analysis is crucial - ensure that the short-term price action aligns with the overall trend on higher timeframes. For extremely noisy markets, such as cryptocurrencies, consider adjusting Ichimoku parameters by 20–30% to reduce sensitivity to market noise.
| Market Condition | Cloud Characteristic | Recommended Approach |
|---|---|---|
| High Volatility | Thick Cloud | Wait for decisive breakouts; use wider ATR-based stops |
| Low Volatility | Thin Cloud | Exercise caution; higher risk of whipsaws |
| Consolidation | Price inside Cloud | Neutral bias; stay on the sidelines |
| Strong Trend | Steep Cloud angle | Follow the trend; use Kijun-sen as a trailing stop |
Conclusion
The Ichimoku Cloud is more than just a tool - it's a comprehensive trading system that combines trend analysis, momentum, and support/resistance levels into one framework. By understanding its five components - the Tenkan-sen (short-term momentum), Kijun-sen (medium-term equilibrium), Senkou Spans (future support/resistance), and Chikou Span (historical confirmation) - traders can gain a clearer perspective on market dynamics.
For high-probability setups, alignment is key. Look for a TK Cross that aligns with the trend, supported by a Chikou Span that stays clear of prior price levels.
"Consistency and patience aren't just good advice; they're the foundation."
This emphasizes the importance of respecting the trend, avoiding counter-trend trades, and staying disciplined during periods of consolidation, often referred to as "no-man's land."
To refine your approach, backtest at least 100 trades using a Backtrader Python tutorial to understand how the system performs across different market conditions. Use higher timeframes, such as the Daily chart, to determine the primary trend, and then shift to 4-hour or 1-hour charts for precise entries. Instead of relying on static stop-losses, consider dynamic ones based on the Kijun-sen or the edges of the cloud, which evolve with the trend.
Stick to the default settings (9, 26, 52), as these are widely used by institutional algorithms, making them effective for identifying self-fulfilling support and resistance levels. Incorporate multi-timeframe analysis and maintain a trading journal to fine-tune your strategy and stay mindful of trading psychology. Consistent application of these principles can help you adapt to various market conditions with confidence.
FAQs
What’s the simplest way to confirm an Ichimoku signal before entering a trade?
The easiest way to validate an Ichimoku signal is by using the Chikou Span as a final confirmation. For a bullish signal, ensure the Chikou Span is positioned above the price. On the flip side, for a bearish signal, it should be below the price. Additionally, check that the price is above the Cloud for a buy signal or below the Cloud for a sell signal, as the Cloud represents areas of support or resistance.
When should I change the default 9/26/52 settings for different assets or timeframes?
The default 9/26/52 settings for the Ichimoku Cloud were originally developed for historical Japanese markets, but they might not always suit modern trading environments. To get the most out of this tool, you should tailor these settings based on market conditions, asset types, and timeframes.
For markets with higher volatility, using longer periods can help reduce the "noise" and provide a clearer picture of trends. On the other hand, lower volatility markets might benefit from shorter periods, as these can offer increased sensitivity to price movements.
Additionally, the type of asset and the timeframe you're analyzing play a big role. For example, shorter timeframes like intraday charts may require different settings compared to longer-term charts like weekly or monthly ones. Adjusting these parameters can improve the accuracy and clarity of the signals, helping you better align the tool with the unique characteristics of the market you're trading.
Where should I place my stop-loss when trading with the Ichimoku Cloud?
When using the Ichimoku Cloud for trading, set your stop-loss strategically to manage risk. For long positions, position your stop-loss slightly below the Kijun-sen (Base Line) or just under the lower edge of the cloud. For short positions, place it slightly above the cloud or the Kijun-sen. These levels serve as important support and resistance zones, offering a safety net if the market moves against your trade.


