
The VIX futures curve is a tool that shows how the market expects volatility to change over time. It’s essential for traders who focus on volatility-based strategies. Here’s the key takeaway:
- Contango: This is when longer-term VIX futures are priced higher than near-term ones. It happens about 84% of the time and reflects calm markets. However, contango can erode the value of long volatility products like VXX and UVXY due to the "roll yield."
- Backwardation: This occurs when near-term futures are priced higher than longer-term ones. It’s less common (around 16% of the time) and signals market stress. Backwardation benefits long volatility strategies.
Key metrics like the M1:M2 spread (difference between the front and second-month futures) help traders identify whether the market is in contango or backwardation. For example, a steep contango often favors short volatility trades, while backwardation supports long volatility positions.
Understanding the VIX futures curve is crucial for navigating products like VXX, UVXY, and SVXY. Whether you're trading during calm or turbulent markets, this curve helps forecast volatility and informs strategy.
VIX Term Structure Explained | Volatility Trading Concept
Understanding Contango and Backwardation
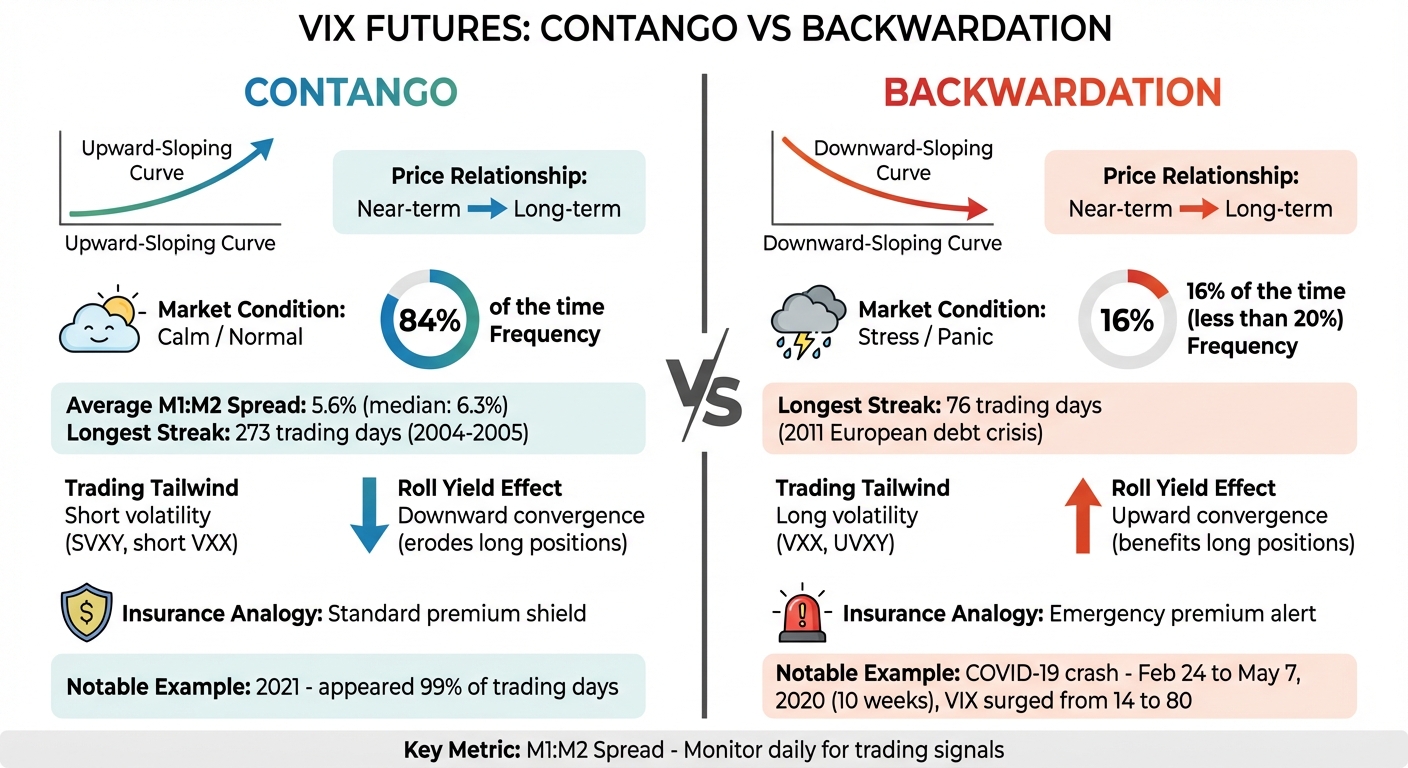
VIX Futures Contango vs Backwardation Comparison Chart
The VIX futures curve can take on two distinct shapes: contango and backwardation. Each shape carries unique implications for traders.
What Is Contango in VIX Futures?
Contango happens when longer-dated VIX futures are priced higher than near-term contracts, forming an upward-sloping curve. This is the market's way of reflecting a premium for long-term uncertainty - similar to how extended insurance policies cost more. Since the launch of VIX futures in 2004, contango has been the default state, occurring about 84% of the time.
The M1:M2 average daily contango stands at approximately 5.6% (median: 6.3%). This premium tends to peak when the spot VIX is very low, signaling calm market conditions. For example, during the bullish market of 2021, contango dominated, appearing on 99% of trading days, with backwardation occurring only twice.
However, contango poses challenges for long volatility positions. As futures contracts near expiration, they converge to the lower spot VIX price, creating a "roll yield" that can erode the value of products like VXX and UVXY. The longest stretch of continuous contango lasted 273 trading days between 2004 and 2005.
What Is Backwardation in VIX Futures?
Backwardation, on the other hand, occurs when near-term futures are priced higher than longer-dated contracts, resulting in a downward-sloping curve. This typically signals heightened market stress or panic.
"For VIX futures, backwardation is rare, and usually only occurs during periods of extreme financial stress." – Brett Friedman, Winhall Risk Analytics
During backwardation, immediate fears drive up the cost of near-term contracts as investors scramble for protection, even though longer-term volatility is expected to ease. Historically, backwardation has been much less common, appearing in less than 20% of trading days.
A notable example occurred during the COVID-19 crash. Backwardation began on February 24, 2020, as markets tumbled, and the curve stayed in this state until May 7, 2020 - a 10-week period during which the VIX surged from below 14 to over 80. The longest recorded stretch of backwardation, however, lasted 76 trading days during the 2011 European debt crisis.
Unlike contango, backwardation benefits long volatility positions. As futures approach expiration, they converge upward to meet the higher spot VIX price, potentially driving gains for products like VXX and UVXY.
Run 24/7 while you sleep. Keep bots, platforms, and trade copiers online on a dedicated VPS.
Low-latency VPS hosting for your trading platform.
From $59.99/mo
Contango vs. Backwardation: Key Differences
Here’s a side-by-side comparison of the two market states:
| Feature | Contango | Backwardation |
|---|---|---|
| Curve Slope | Upward-sloping (left to right) | Downward-sloping (left to right) |
| Price Relationship | Near-term < Long-term | Near-term > Long-term |
| Market Condition | Calm / Normal | Stress / Panic |
| Frequency | ~84% of the time | ~16% of the time |
| Trading Tailwind | Short volatility (SVXY, short VXX) | Long volatility (VXX, UVXY) |
| Insurance Analogy | Standard premium for future risk | Immediate surge in protection cost |
Market dynamics can shift quickly between these states. For instance, during bearish periods like 2022, backwardation became more frequent, appearing on 63 trading days. Knowing the differences between contango and backwardation is crucial for crafting effective volatility trading strategies.
How to Read the VIX Futures Curve
Building on the concepts of contango and backwardation, this section explains how to interpret the VIX futures curve for practical insights.
Interpreting Curve Shape and Slope
The VIX futures curve is a graphical representation of VIX futures prices across different expiration months, typically labeled as M1 (front month) through M8. To interpret the curve, compare the prices of near-term contracts with those of longer-dated ones to understand its overall shape.
An upward-sloping curve, where longer-dated futures are priced higher than near-term ones, suggests the market is pricing in a premium for future uncertainty - similar to paying more for a 12-month insurance policy compared to a one-month plan. On the other hand, a downward-sloping curve indicates backwardation, where near-term contracts are more expensive due to heightened immediate market stress.
The steepness of the curve is another key factor. Traders often examine the M1:M2 spread - the percentage difference between the front-month and second-month futures. Historically, this spread averages 5.6% (median 6.3%). Contango levels exceeding 8.99% rank in the top 70th percentile, while rare events like a 30-day to 182-day spread dropping below –4.95% - as seen on August 15, 2025 - occur only about 6.9% of the time.
Additionally, look for irregularities in the curve, such as localized peaks in specific months. These deviations often signal anticipated events, like tax deadlines or legislative debates, when the market expects increased risk.
Practical Tips for Analyzing Curve Dynamics
Start by tracking the M1:M2 spread daily. This metric can help determine whether volatility ETPs, such as VXX, are facing a headwind (in contango) or a tailwind (in backwardation). Platforms like VIXCentral.com provide free, real-time visualizations of the curve, making this analysis accessible for traders.
"M1:M2 VIX futures contango is definitely important and should be understood and viewed everyday for anybody who wants to be trading volatility ETPs. However, on its own, it's a non-starter." – Volatility Trading Strategies
Instead of focusing solely on absolute values, use percentile rankings to gauge whether current conditions are unusual. For instance, a contango level of 0% might appear neutral but actually falls in the bottom 16th percentile, indicating an unusually flat curve rather than a typical market state. To avoid false signals, look for readings above the 70th percentile when identifying potential trading opportunities.
Remember that as futures contracts approach expiration, their prices converge with the spot VIX. In contango, futures prices gradually decline toward the lower spot price, while in backwardation, they rise to meet the higher spot price. This convergence creates a roll yield, which can either help or hurt volatility positions depending on the curve's shape.
Extreme curve shapes can also act as reversal signals. For example, exceptionally steep contango - especially when the spot VIX is very low - often precedes a trend shift as the market reverts to historical norms. Between May and June 2025, tariff concerns pushed the curve into backwardation, but by August 15, 2025, it snapped back to extreme contango with a 30-day/182-day spread of –4.95.
Trading Strategies Based on the VIX Curve
Building on the earlier discussion of the VIX curve's behavior, these strategies allow traders to navigate market conditions more effectively. Each market phase - contango or backwardation - presents unique opportunities and risks, requiring tailored approaches.
Trading Strategies for Contango Markets
In contango markets, the predictable roll yield tends to erode long volatility positions, making short volatility strategies more appealing. One way to capitalize on this is by using inverse exchange-traded products like SVXY or SVIX, which benefit from the daily decay caused by contango. Additionally, traders can employ defined-risk put options on products such as VXX or UVXY to limit potential losses.
To refine trade signals, monitor the percentile rankings of current contango levels. Historical trends show that higher average contango years often align with better returns for short volatility strategies. Conversely, periods with lower contango or frequent backwardation have historically led to losses.
Backwardation, on the other hand, flips the script, offering a different set of opportunities.
Trading Strategies for Backwardation Markets
Backwardation creates conditions where VIX futures prices tend to drift upward toward the elevated spot price as expiration nears. This movement provides a favorable environment for long volatility strategies. For example, during the March 2020 COVID-19 crash, the CBOE LONGVOL Index achieved returns exceeding 300%. Similarly, the sharp inversion of the VIX curve in March 2018, driven by trade-war fears, rewarded traders holding long volatility positions.
To identify entry points during backwardation, closely watch the daily roll metric. This is calculated as the difference between the front VIX future and the spot VIX, divided by the number of business days to settlement. Historically, a reading below –0.10 points has indicated favorable conditions for long positions.
"In backwardation, convergence means the VIX futures price typically drifts up toward the spot price as expiration nears. This upward movement tends to support long call values even if volatility doesn't spike further." - Charles Schwab
Given the high costs often associated with VIX options, defined-risk strategies like bull call spreads can be a practical solution. For instance, buying an at-the-money call while selling an out-of-the-money call caps the maximum loss to the net premium paid, offering a cost-effective hedge against further market declines.
Timing exits is just as important as timing entries. During March 2020, VIX futures peaked at $53 before reverting to around $42 as mean reversion set in. This highlights the need to lock in gains before the market changes direction significantly.
Managing Risk in Volatility Trading
Whether trading in contango or backwardation, managing risk is critical to navigating the challenges of volatility markets. Volatility trading requires active, daily monitoring. Products like SVXY are best suited for short-term tactical moves rather than long-term holdings. For example, as of December 24, 2025, the three-year return for VXX was –76.02%, underscoring the long-term drag caused by contango roll costs.
Relying solely on a single metric, such as a 0% contango crossover, can be risky and lead to significant losses. During the March 2020 crash, the VIX futures curve didn’t shift into backwardation until February 24, and it didn’t return to contango until May 7, after the market had recovered substantially.
For traders seeking a more stable hedge less sensitive to sudden volatility spikes, mid-term products like VXZ or VIXM - which track fourth- through seventh-month futures - can provide steadier protection during extended periods of market turbulence. When shorting volatility in contango markets, it’s crucial to define and manage your maximum potential loss. The 2020 market turmoil showed just how quickly the VIX can surge - from 14 to 80 in a matter of weeks. Using options instead of direct short positions can help cap risk more effectively before entering a trade.
Stay online and closer to execution. Choose a VPS location for CME futures, New York markets, London FX, API trading, and more.
Host your platform near the market route that matters.
From $59.99/mo
QuantVPS: Infrastructure for VIX Futures Trading
Why Low Latency Matters in Volatility Trading
In the fast-paced world of volatility trading, milliseconds can make or break a trade. During periods of market turbulence, even the slightest delay can result in slippage, where your trade gets executed at a less favorable price. When trading strategies hinge on quick responses to sudden VIX movements, execution speed becomes the deciding factor between catching a profitable move or missing it entirely.
"Ultra-low latency is critical for rapid futures trade execution and minimizing slippage." - QuantVPS
QuantVPS Features for Futures Traders
QuantVPS servers, located in Chicago, are designed with high-performance hardware, including enterprise-grade AMD EPYC and Ryzen processors, high-speed DDR4/5 RAM, and NVMe M.2 SSD storage. This setup enables execution speeds of under 0.52 milliseconds while maintaining 99.999% uptime. Being close to the CME Group exchange further reduces network delays, giving traders a crucial edge in timing.
On January 1, 2026, QuantVPS hit a major milestone: traders executed over $10.87 billion in volume within a single 24-hour period using its servers. The network’s 1Gbps connection, with the ability to burst up to 10Gbps, ensures smooth data processing even during extreme market volatility. This infrastructure is built to integrate seamlessly with automated futures trading systems, keeping operations efficient and uninterrupted.
Platform Support for Automated Trading
QuantVPS doesn’t just focus on speed - it’s built for automation. The platform supports a wide range of popular futures trading platforms, such as NinjaTrader, Sierra Chart, TradeStation, Quantower, and Tradovate. It also works with key data feeds like Rithmic, CQG, and dxFeed, making it versatile for traders who rely on automated bots to analyze and act on multiple points in the VIX term structure.
A secure remote desktop gateway allows traders to manage strategies from anywhere, while the VPS takes care of execution 24/7. This ensures that algorithms remain responsive, even during overnight trading sessions, so you never miss an opportunity.
Conclusion
Key Takeaways
The VIX futures curve typically takes on one of two shapes: contango or backwardation. Contango, where longer-dated contracts are priced higher than near-term ones, is the more common scenario, occurring about 84% of the time since 2004. This upward slope works against long volatility products like VXX, creating a "bleed", while benefiting short volatility positions. On the other hand, backwardation, which shows up less than 20% of the time, indicates immediate market stress and flips the dynamic.
A key metric to watch is the first-to-second month spread - the relationship between the first- and second-month futures. For instance, a contango level of 15.23% ranks in the 95th percentile of historical data, suggesting strong opportunities for short volatility strategies. However, relying solely on a simple 0% crossover signal without considering additional filters, like percentile rankings, can lead to poor outcomes.
"M1:M2 VIX futures contango is definitely important and should be understood and viewed everyday... However, on its own, it's a non-starter." - Volatility Trading Strategies
These principles provide the groundwork for developing actionable trading strategies.
Next Steps for Traders
To stay ahead, monitor the VIX futures curve daily using platforms like VIXCentral. Focus on percentile rankings rather than absolute values to pinpoint higher-quality trade setups. For contango strategies, consider targeting expirations 4–5 months out, giving trades enough time to play out.
Additionally, having a robust trading infrastructure is essential, especially during volatility spikes. For example, during the February 2018 "Volpocalypse", the VIX surged 115.6% in a single day - from 17.31 to 37.32 - underscoring how split-second execution can make or break trades. Tools like QuantVPS's Chicago-based servers, offering ultra-low latency (0–1 ms) and full uptime, ensure reliable performance for automated strategies like those built with NinjaTrader algo trading tools, monitoring multiple metrics.
Whether you're capitalizing on contango decay or preparing for backwardation spikes, combining a well-thought-out strategy with dependable execution tools can give you a crucial edge in navigating the volatility markets.
FAQs
How do contango and backwardation in the VIX futures curve impact trading strategies?
The VIX futures curve indicates whether the market is in contango (where short-term contracts cost less than long-term ones) or backwardation (where short-term contracts are more expensive). In a contango scenario, traders holding long positions in VIX futures or volatility products like VXX often experience losses due to the negative roll yield when contracts are rolled forward. To take advantage of contango, traders might short volatility by selling VIX futures, buying short-volatility products like SVXY, or purchasing put options on VXX.
On the other hand, backwardation occurs when short-term contracts trade at a premium compared to long-term ones, leading to a positive roll yield for long positions. This setup supports long-volatility strategies, such as buying VIX futures, holding VXX, or employing calendar spreads to benefit from the curve's flattening. The slope of the VIX curve plays a crucial role here - contango tends to favor short-volatility trades, while backwardation aligns with long-volatility strategies.
What are the potential risks and rewards of trading VIX futures during contango?
During contango phases, VIX futures with longer expirations tend to trade at higher prices than near-term contracts or the spot price. This creates a phenomenon called roll decay, where long positions gradually lose value as the futures price moves closer to the lower spot price. For traders holding long positions, this can pose serious challenges, including the need to meet margin requirements and the risk of substantial losses due to the $1,000-per-point contract size.
Conversely, short-volatility strategies - like shorting volatility ETFs or purchasing put options on them - can take advantage of the positive roll yield that arises from the price difference between longer-dated and shorter-dated contracts. However, these strategies come with their own set of risks, particularly during sudden volatility spikes. Careful position management and close monitoring of market conditions are essential to mitigate potential losses.
How can traders use the M1:M2 spread to find volatility trading opportunities?
The M1:M2 spread measures the percentage difference between the front-month (M1) and second-month (M2) VIX futures. This metric helps traders evaluate the slope of the VIX futures curve and spot potential trading opportunities. The formula for calculating the spread is:
[ \text{M1:M2 %} = \frac{M2 - M1}{M1} \times 100 ]
When the spread shows a high positive value (e.g., over 15%), it suggests a steep contango - a scenario where longer-dated futures are priced higher than shorter-dated ones. This environment often benefits short-volatility strategies, such as buying SVXY, shorting VXX, or purchasing VXX puts, as roll decay tends to work in favor of these positions.
On the other hand, if the spread narrows or turns negative (backwardation), it signals that near-term volatility expectations are elevated, with front-month futures priced higher than the second-month. In such cases, long-volatility strategies like buying VXX, UVXY, or long VIX calls may be more effective.
Here’s how to make the most of the M1:M2 spread:
- Track the daily spread using platforms like VIXCentral.
- Compare it to historical benchmarks - steep contango, for instance, often aligns with the 90th percentile.
- Adapt your trading strategy based on the spread's behavior, while keeping an eye on the spot VIX to anticipate potential reversals.
By keeping tabs on the M1:M2 spread, traders can align their strategies with the market’s volatility dynamics and capitalize on roll-yield opportunities.


