
Volume analysis helps you understand the strength behind price movements by examining trading activity. It’s a vital tool for traders to confirm entries and exits, avoid false breakouts, and identify trends. Key strategies include:
- Volume Profile: Identifies key price levels like the Point of Control (POC) and Value Area for support and resistance.
- VWAP (Volume-Weighted Average Price): Tracks fair value and helps spot bullish or bearish trends.
- On-Balance Volume (OBV): Indicates buying or selling pressure and potential reversals through divergences.
For example, heavy volume during a breakout (150% of the 20-day average) signals institutional involvement and reliable momentum. Conversely, weak volume may indicate a false move. Tools like Relative Volume (RVOL) and volume spikes during consolidation patterns, alongside other essential indicators for day trading, also refine trade decisions.
Volume-based exit strategies rely on levels like the POC, High Volume Nodes (HVNs), and Value Area extremes. These levels help traders manage risk and lock in profits by aligning with market activity rather than arbitrary targets.
Volume Indicators for Confirming Trades
When it comes to confirming trading decisions, three volume-based indicators often take center stage: Volume Profile, VWAP, and On-Balance Volume (OBV). Each offers a unique perspective on market behavior, helping traders gauge the strength behind a potential trade setup. Let’s break down how each of these tools works.
Volume Profile Basics
Volume Profile displays trading activity at various price levels, showing where the majority of trades occurred. The Point of Control (POC) is a key feature - it highlights the price level with the highest traded volume during a session. This price often acts as a magnet when market direction is uncertain, as it represents a "fair" value where buyers and sellers found the most agreement.
- High Volume Nodes (HVN): These are areas with concentrated trading activity, often acting as zones of consolidation or profit targets.
- Low Volume Nodes (LVN): These are thinly traded areas where price tends to move quickly due to lower resistance.
An example of LVN in action occurred in September 2024 when Tesla (TSLA) rallied from $182 to over $230. The thin trading zone between $215 and $220 (an LVN) offered minimal sell pressure, helping the stock rebound and continue its upward momentum.
The Value Area (VA) represents roughly 70% of the traded volume and is bounded by the Value Area High (VAH) and Value Area Low (VAL). These levels often act as dynamic support and resistance. For instance, in January 2025, Apple (AAPL) traded within a value area near $243, with a VAH around $246. On January 6, 2025, the price tested the VAH at $245.99 but failed to hold, leading to a decline to $218.19 by January 21, 2025.
VWAP (Volume-Weighted Average Price)
VWAP, or Volume-Weighted Average Price, serves as a benchmark for assessing an asset's fair value during a session. It calculates the average price weighted by volume, making it particularly useful for institutions aiming to evaluate trade execution quality.
- Trading Above VWAP: This typically signals bullish sentiment and institutional buying.
- Trading Below VWAP: Indicates bearish pressure and potential selling.
Because early-session volume can be volatile, traders often wait 30–60 minutes after the market opens before relying on VWAP. Once established, VWAP acts as dynamic support in uptrends and resistance in downtrends. Tailoring the VWAP period to your trading style - such as using session VWAP for day trades or weekly/monthly VWAP for swing trades - can help align your strategy with broader market trends.
Run 24/7 while you sleep. Keep bots, platforms, and trade copiers online on a dedicated VPS.
Low-latency VPS hosting for your trading platform.
From $59.99/mo
On-Balance Volume (OBV)
OBV operates on the idea that volume often leads price movements. By adding volume on up days and subtracting it on down days, OBV tracks buying and selling pressure, often hinting at potential price moves before they happen.
- Bullish Divergence: Occurs when price forms lower lows, but OBV forms higher lows - suggesting that buying pressure is building despite the price decline.
- Bearish Divergence: Happens when price makes higher highs, but OBV fails to follow, signaling weakening upward momentum.
A historical example involves Starbucks (SBUX), which formed a lower low in July while OBV stayed above its June low - creating a bullish divergence. Interestingly, OBV broke its resistance level a full week before the stock price surged, eventually gaining over 30%.
Additionally, when OBV rises during a range-bound market, it can indicate accumulation. Drawing trendlines on OBV can also help identify potential breakout points.
These volume indicators, when used effectively, can provide deeper insights into market dynamics and help validate trade setups with greater confidence.
Using Volume Spikes and Breakouts to Confirm Entries
Volume Patterns in Market Trends: Trading Implications Guide
Building on tools like Volume Profile, VWAP, and OBV, let's dive into how volume spikes can validate trade entries. A breakout without accompanying volume often lacks the strength to sustain momentum. Think of it this way: price movement shows the direction, but volume is the fuel that drives it forward. When a stock breaks above resistance or below support, the volume behind the move reveals whether institutions are involved or if it's just retail traders chasing trends.
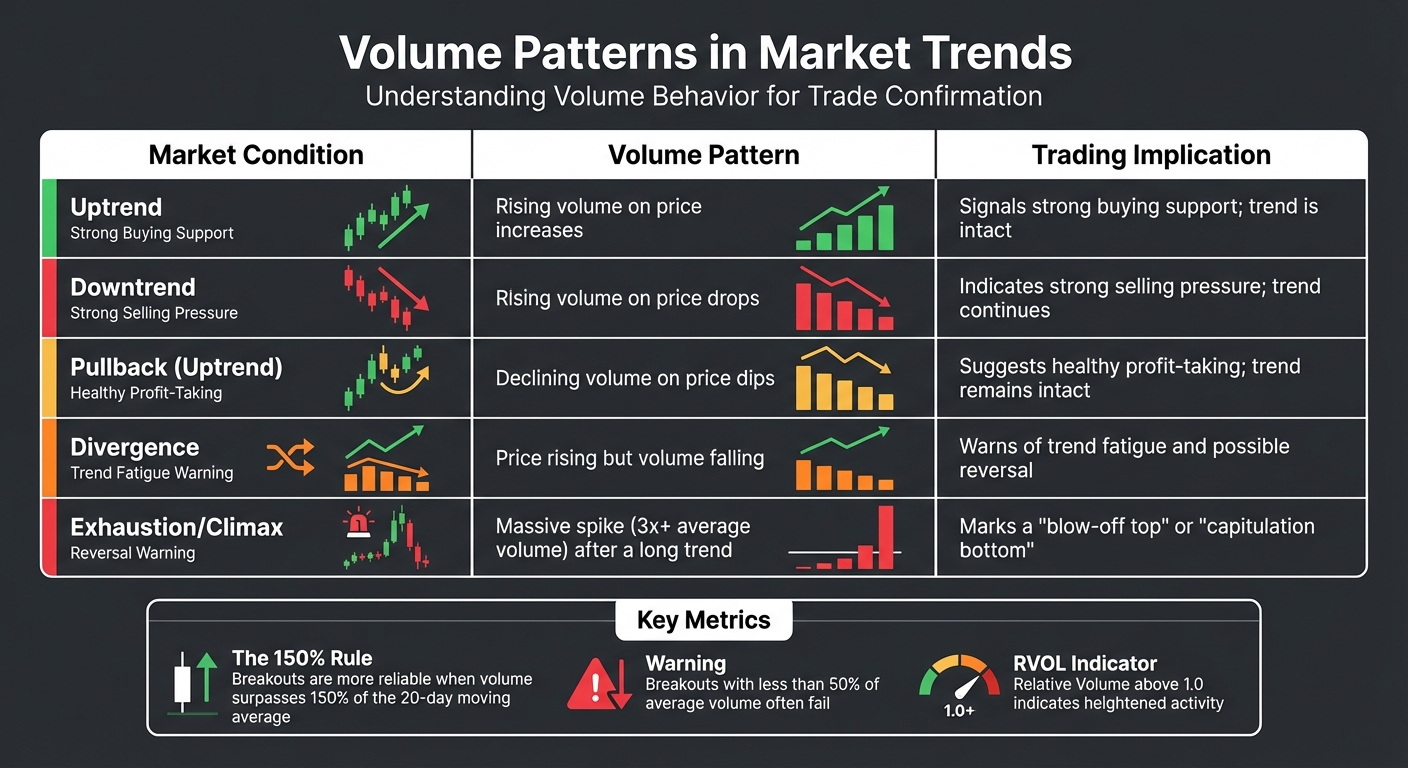
The 150% rule offers a solid benchmark: a breakout is more reliable when volume surpasses 150% of its 20-day moving average. This level suggests that large players - like mutual funds and hedge funds - are participating, which is essential for maintaining momentum. On the flip side, breakouts with less than 50% of the average volume often fail, turning into bull or bear traps.
Take Apple Inc. (AAPL) as an example. In April 2024, the stock broke above the $200 resistance level on heavy volume following an earnings report. This surge confirmed the bullish breakout and established a new support level. In contrast, Tesla (TSLA) showed a different scenario in October 2024. Between October 7 and October 11, the stock dropped about 10% on rising volume, signaling strong selling pressure and confirming a bearish reversal.
Relative Volume (RVOL) is another handy metric, comparing current volume to historical averages. An RVOL above 1.0 indicates heightened activity. Adding a 20-period or 30-period moving average to your volume chart can help you quickly spot when current volume significantly exceeds the baseline. During consolidation patterns like bull flags or cup-and-handle formations, volume typically declines as the pattern forms and then spikes sharply during the breakout. This "volume dry-up" followed by expansion signals that sellers are exhausted and buyers are ready to take control.
Volume Patterns in Market Trends for Trade Confirmation
Recognizing volume behaviors in different market conditions can help you separate healthy trends from those losing steam. Here's a quick summary of common volume patterns and their trading implications:
| Market Condition | Volume Pattern | Trading Implication |
|---|---|---|
| Uptrend | Rising volume on price increases | Signals strong buying support; trend is intact |
| Downtrend | Rising volume on price drops | Indicates strong selling pressure; trend continues |
| Pullback (Uptrend) | Declining volume on price dips | Suggests healthy profit-taking; trend remains intact |
| Divergence | Price rising but volume falling | Warns of trend fatigue and possible reversal |
| Exhaustion/Climax | Massive spike (3x+ average volume) after a long trend | Marks a "blow-off top" or "capitulation bottom" |
When volume spikes to more than three times the average at the end of a long trend, it often signals exhaustion rather than continuation. A classic example is the Alternative Harvest ETF (MJ), which peaked in 2018 on volume that was 32 times its prior average - a textbook case of climax volume marking a major top.
Using Volume Analysis to Time Your Exits
Setting arbitrary price targets for exits often leads to missed opportunities or premature decisions. Instead, rely on volume-based levels like the Point of Control (POC), Value Area boundaries, and High Volume Nodes (HVNs). These levels highlight where institutional activity and consensus pricing occur, offering more reliable insights into where the market might stall, reverse, or consolidate. By applying the same volume principles used for entry signals, you can better protect profits and manage losses.
Exit Strategies Based on Volume Profile Levels
Volume analysis isn't just for entries - it’s equally effective for exits. The POC, representing the price level with the highest traded volume, is a common target. Prices tend to gravitate toward this equilibrium point, making it a practical exit level. For example, in November 2024, the SPDR S&P 500 ETF (SPY) had a "naked POC" at $571 from late October. After gapping through this level on November 6 following the election, the price surged to $589 by November 8. This illustrates how price can override prior consensus when breaking through a naked POC.
HVNs also act as key zones for exits. These areas often cause price to slow down or reverse due to institutional accumulation or distribution.
Adam from Jumpstart Trading explains: "High volume nodes act like gravity. They tend to attract price and try to hold it there".
On the other hand, Low Volume Nodes (LVNs) function as "highways" where price moves quickly with minimal resistance. Exiting in the middle of an LVN is generally not recommended - waiting for the next HVN often provides a more strategic exit point.
Value Area extremes, such as the Value Area High (VAH) and Value Area Low (VAL), are also critical. These boundaries encompass roughly 70% of traded volume. When price tests these extremes but fails to hold, it often signals a rejection and a likely move back toward the POC. A case in point: in January 2025, Apple Inc. (AAPL) traded within a value area near $243, with a VAH at $246. On January 6, the price tested $245.99 but couldn’t sustain above the VAH. This rejection triggered exits, and the stock dropped to $218.19 by January 21, 2025.
Here’s a quick comparison of different volume-based exit methods:
| Exit Level | Market Behavior | Trade-off |
|---|---|---|
| POC | Price often stalls or consolidates here | Pros: High likelihood of being reached. Cons: May exit too early if a strong trend continues |
| VAH/VAL | Acts as structural resistance or support | Pros: Captures larger price rotations. Cons: Risk of reversal before reaching the extreme |
| HVN | Acts as a "gravity zone" for price | Pros: Logical structural exit. Cons: Consolidation can delay exits |
| LVN | Fast-moving price zone with low resistance | Pros: Quick profit realization. Cons: High rejection risk if breakout fails |
Identifying Exhaustion Through Heavy Volume Zones
Stay online and closer to execution. Choose a VPS location for CME futures, New York markets, London FX, API trading, and more.
Host your platform near the market route that matters.
From $59.99/mo
Heavy volume zones often signal that a trend is losing steam. For instance, if the price breaches the VAH but closes back inside, it indicates rejection and a likely return to the POC. A drop below VWAP further confirms a shift in fair value, signaling an exit.
In September 2024, Tesla (TSLA) approached an LVN in the $215–$220 range. On September 11, the price briefly dipped into the LVN before closing above the nearest HVN. This failed breakout prompted an exit, and the price continued upward to $261.75 by September 26. When price wicks into an LVN but rejects it, it’s often a sign of a failing breakout, suggesting an immediate exit.
Another key signal is institutional absorption - when aggressive market orders hit stacked limit orders, but the price fails to move further. This suggests that large players are absorbing the pressure, setting the stage for a reversal. Similarly, a shift from a trending profile to a "Neutral Profile", where the price closes near the Value Area instead of decisively moving away, can indicate a slowing trend. These patterns, combined with earlier volume spikes, highlight the effectiveness of volume analysis in timing exits.
Running Volume Analysis on QuantVPS for Fast Execution
When it comes to precise volume-based exit strategies, having a fast and reliable infrastructure is absolutely essential. These strategies depend on real-time, tick-by-tick Level 2 and Level 3 market data. Whether you're running algorithms like Adaptive VWAP or analyzing order flow imbalances, every millisecond counts. Without accurate, real-time volume data, liquidity information can quickly become outdated, leading to less favorable execution conditions.
"A delay of just a few milliseconds can render the liquidity information stale, causing the algorithm to execute aggressively into a market where the favorable depth has already disappeared." - QuantStrategy.io Team
QuantVPS is built to handle these high demands with ultra-low latency connections. It delivers sub-2ms speeds, including as low as 0.5ms to CME Group servers. The hardware setup includes AMD EPYC processors running at base speeds over 3.5GHz and NVMe storage capable of read-write speeds up to 3,500MB/s. This level of performance ensures that thousands of quote updates per second are processed seamlessly, keeping your volume indicators up to date. Plus, QuantVPS supports major trading platforms like NinjaTrader, MetaTrader 4/5, TradingView, Quantower, MotiveWave, and Sierra Chart with pre-installed configurations.
Reliability is another key factor. QuantVPS guarantees a 99.99% uptime SLA, backed by redundant power and network systems. This ensures your algorithms can continuously monitor volume indicators without interruptions. For high-frequency traders, QuantVPS provides a serious edge - offering a 400% speed improvement thanks to servers located near financial hubs like Chicago, New York, London, and Tokyo.
The infrastructure is particularly well-suited for platforms like Sierra Chart, valued for its lightweight design and speed. This is critical for order flow tools that demand constant data updates. If you're leveraging Quantower's advanced features or Sierra Chart's Level 5 package, you'll need robust processing power to handle real-time data normalization and color-coded indicators without delays.
QuantVPS plans start at $41.99 per month (billed annually) for the VPS Lite option, with dedicated server configurations offering up to 128GB of RAM for more demanding algorithmic tasks.
Combining Multiple Volume Indicators for Better Signals
By integrating tools like Volume Profile, VWAP, and OBV, traders can uncover more reliable market signals. Each tool brings a unique perspective: Volume Profile offers a historical view of key trading levels, while VWAP highlights the current fair value. When these tools are combined, they provide both spatial and temporal context, reducing market noise and sharpening trade entries.
"Volume Profile provides the spatial context (where trades matter), and VWAP provides the temporal context (what is fair value right now)." - QuantStrategy.io Team
Here's how this works in practice: VWAP can act as a directional filter. If the price is trading above VWAP, it suggests focusing on long setups. Conversely, if the price is below VWAP, short setups might be more appropriate. Volume Profile then pinpoints precise levels for entry. For instance, in January 2026, a futures contract neared a Point of Control (POC) at $5,000 while trading above a VWAP of $4,990. Aggressive market orders created a strong bid wall at the POC, signaling a high-confidence long entry.
Adding OBV to this mix further validates the strength behind price movements. For example, if the price breaks through a High Volume Node but OBV is declining, it could indicate weak institutional support, making the breakout less reliable. On the other hand, a price test at the POC accompanied by a spike in OBV suggests strong institutional participation. Research supports this approach, showing that combining multiple volume indicators can increase strategy win rates by about 5%. Specific setups, such as VWAP Reversion, have been shown to achieve a 61% win rate.
Additionally, blending volume analysis with moving averages improves trend identification accuracy by 18%, with 75% of profitable trades linked to above-average volume. Even classic chart patterns like Head and Shoulders see a higher success rate - 83% when confirmed by volume, compared to just 60% without it. Combining these tools creates a more comprehensive and effective trading strategy.
Conclusion
Volume analysis offers a clear lens into the conviction behind price movements, helping traders confirm both entries and exits with greater precision. Instead of relying solely on price action, tools like Volume Profile, VWAP, and OBV add depth to your analysis. They reveal not just where price is moving but whether the market is genuinely accepting those levels. This dual perspective sharpens your entries while fine-tuning your exit strategy.
For example, breakouts accompanied by volume exceeding 150% of the 20-day average are far more dependable than those with weak participation. Similarly, trades using Volume by Price boast a 78% success rate in trending markets, while VWAP mean reversion strategies deliver a 65% win rate. These aren't minor tweaks - they're the difference between informed trading and blind guessing, allowing you to follow the footprints left by institutional players.
Speed is critical when acting on volume signals, and QuantVPS provides sub–1 ms latency, ensuring you can respond instantly to key market shifts.
Risk management also gets a boost with volume-based strategies. Placing stops behind Low Volume Nodes or trailing them along developing Points of Control anchors your decisions to market structure rather than arbitrary levels, reducing unnecessary risk.
FAQs
How do I set up Volume Profile levels for my chart?
To set up Volume Profile levels, start by adding the Volume Profile indicator to your trading platform. Once added, configure its settings to suit your analysis needs. Choose the period or range you want to analyze, such as Visible Range or Session Volume Profile. You can also tweak parameters like the number of bars or time frames to zero in on critical areas.
The indicator's histogram displays the volume traded at each price level, helping you pinpoint potential support and resistance zones. These zones are based on areas of high or low trading activity, offering valuable insights for your strategy.
What timeframe should I use for VWAP in day vs. swing trades?
When it comes to day trading, VWAP works best on shorter intraday timeframes such as 1-minute to 15-minute charts. For swing trading, an anchored VWAP is more effective, as it allows you to track institutional fair value levels over multi-day periods. By aligning VWAP usage with your trading style and time horizon, you can better adapt it to meet your specific goals.
How can I avoid getting trapped in low-volume breakouts?
To steer clear of low-volume breakouts, incorporate volume analysis as a key confirmation tool. A robust breakout typically comes with a noticeable volume surge - often exceeding 150% of the 20-day average volume - signaling strong market participation. You can use tools like Volume Profile or VWAP to assess trading activity at breakout levels. Pairing these indicators with retest strategies can help weed out false signals and sharpen your entry timing.


