
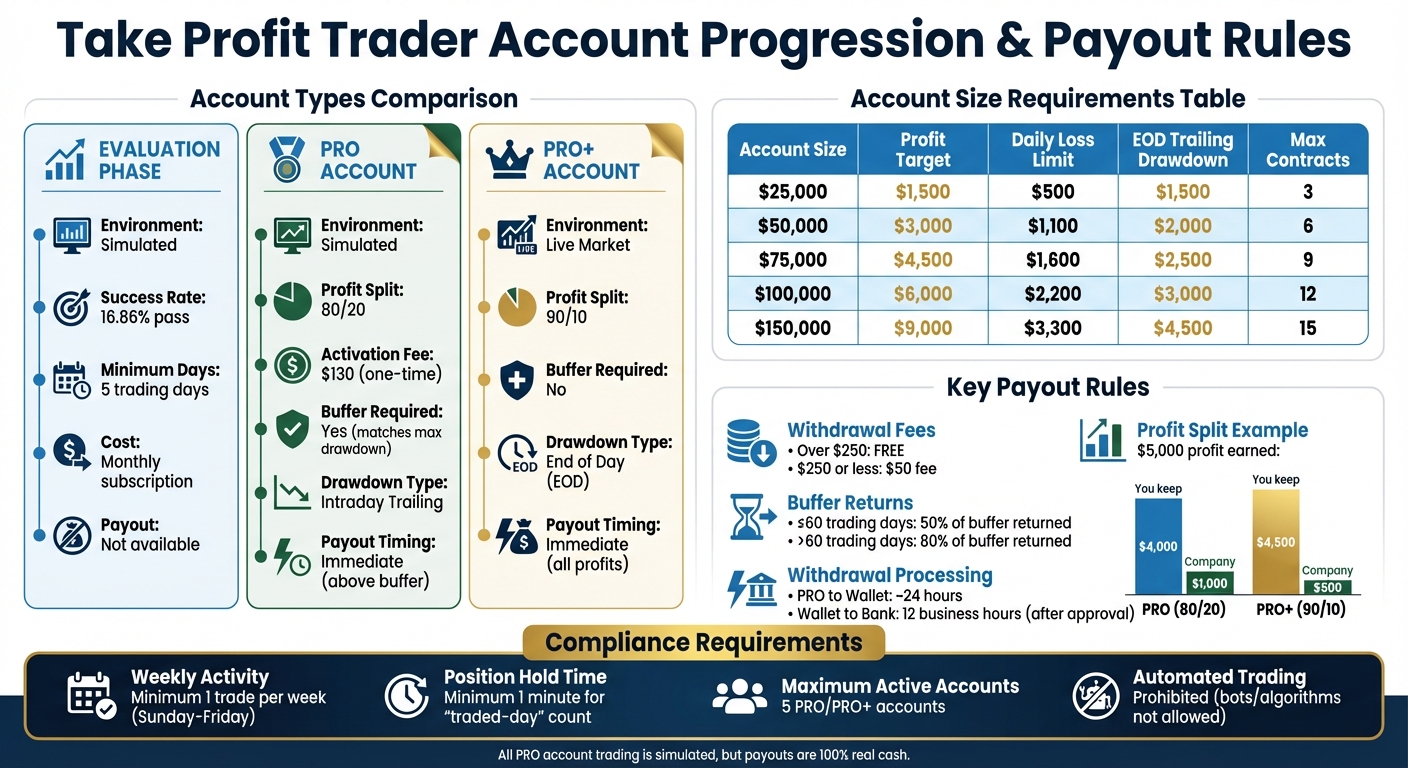
Take Profit Trader is a futures trading firm offering simulated accounts between $25,000 and $150,000. While trading occurs in a simulated environment, the profits you withdraw are real. Here's a quick breakdown of the key payout rules and processes compared to other firms:
- Profit Splits: Standard PRO accounts offer an 80/20 split, while PRO+ accounts provide a 90/10 split.
- Buffer Zone: You must exceed a specific account balance (e.g., $52,000 for a $50,000 account) to withdraw profits without restrictions.
- Withdrawal Fees: Withdrawals over $250 are free, while amounts $250 or less incur a $50 fee.
- Early Withdrawals: Withdrawing before 60 trading days results in only 50% of the buffer being returned; after 60 days, 80% is returned.
- Activation Fee: Transitioning to a PRO account requires a one-time $130 fee.
To qualify for payouts, you must first pass the Evaluation Phase by meeting profit targets and adhering to strict risk management rules. PRO accounts operate in a simulated environment, while PRO+ accounts trade in live markets and eliminate the buffer requirement.
Quick Tip: Timing your withdrawals and maintaining consistent trading can maximize your earnings.
Take Profit Trader Account Comparison: Evaluation vs PRO vs PRO+ Accounts
Account Progression and Payout Eligibility
Evaluation Phase Requirements
The journey begins with the Evaluation Phase, where you trade in a simulated environment to showcase your trading skills. To move forward, you’ll need to hit a specific profit target based on your account size. For instance, a $50,000 account requires $3,000 in profits, while a $150,000 account has a $9,000 target.
In this phase, strict risk management rules come into play. You’ll need to stay within the Daily Loss Limit and the End of Day (EOD) Trailing Drawdown for your account size. For example, a $50,000 account has a $1,100 daily loss limit and a $2,000 EOD trailing drawdown. Additionally, you must trade for at least 5 days to complete the evaluation.
Here’s a quick breakdown of the targets and limits for different account sizes:
| Account Size | Profit Target | Daily Loss Limit | EOD Trailing Drawdown | Max Position Size |
|---|---|---|---|---|
| $25,000 | $1,500 | $500 | $1,500 | 3 Contracts |
| $50,000 | $3,000 | $1,100 | $2,000 | 6 Contracts |
| $75,000 | $4,500 | $1,600 | $2,500 | 9 Contracts |
| $100,000 | $6,000 | $2,200 | $3,000 | 12 Contracts |
| $150,000 | $9,000 | $3,300 | $4,500 | 15 Contracts |
In 2024, 16.86% of traders successfully passed this phase and advanced to PRO status. Completing this step sets you up for the next stage, where better payout opportunities await.
Moving to PRO Account
Once you meet the profit target and complete the minimum 5 trading days, you can transition to a PRO account. This step requires a one-time $130 activation fee, which replaces the monthly subscription you paid during the evaluation phase. While the PRO account operates in a simulated environment, the profits you withdraw are real cash.
Run 24/7 while you sleep. Keep bots, platforms, and trade copiers online on a dedicated VPS.
Low-latency VPS hosting for your trading platform.
From $59.99/mo
With a PRO account, you gain access to immediate payouts. However, to qualify for full 80% profit withdrawals, you must maintain a balance beyond the Buffer Zone. For example, a $50,000 account needs to reach a balance of $52,000 before standard withdrawals are allowed.
If you make an early withdrawal, the payout structure changes: accounts active for 60 days or less receive 50% of profits, while those active for more than 60 days get 80%. For traders with consistent performance, there’s an opportunity to upgrade to a PRO+ account, which offers a 90/10 profit split and eliminates the buffer requirement.
How Payouts Work
Buffer Zone and Trailing Drawdown
The buffer zone is set to match your account's maximum drawdown. For example, if you have a $50,000 account with a $2,000 buffer, any profits above $52,000 are available for withdrawal right away.
"When you make it on day one you can take it on day one. There's no withdrawal restrictions on your profits above the buffer." – Take Profit Trader
Once your account becomes PRO-activated, profits above the buffer can be withdrawn immediately. However, the buffer itself is only released when the account is closed. If the account has been active for 60 days or less, 50% of the buffer is returned. If it’s been active for more than 60 days, 80% is returned.
PRO accounts use an intraday trailing drawdown, which tracks your account balance throughout the trading day. On the other hand, PRO+ accounts use an End of Day (EOD) drawdown system. This allows for more flexibility during trading sessions and removes the need for a buffer entirely.
Now, let’s dive into how profit splits work in PRO and PRO+ accounts.
Profit Splits in PRO and Live Accounts
Profit sharing depends on the type of account you have. PRO accounts feature an 80/20 split. For instance, if you earn $5,000 in profits, you take home $4,000. PRO+ accounts offer a better deal with a 90/10 split, meaning you’d keep $4,500 from the same $5,000.
Another key difference is that PRO+ accounts operate in live markets instead of simulated environments. They also don’t require a buffer zone, so every dollar you earn is available for withdrawal immediately.
| Feature | PRO Account | PRO+ Account |
|---|---|---|
| Profit Split | 80/20 | 90/10 |
| Buffer Requirement | Yes (Matches Max Drawdown) | Not required |
| Drawdown Type | Intraday Trailing | End of Day (EOD) |
| Environment | Simulated (SIM) | Live Market |
Withdrawal Timing and Fees
When transferring funds from your PRO account to your TPT Wallet, the process typically takes around 24 hours. Once you request a payout from the wallet, it goes through admin approval, which is completed within 12 business hours.
Before withdrawals, you’ll need to complete tax forms (W-9 for U.S. residents or W-8 BEN for international traders) and verify your identity through pop-up forms.
For withdrawals over $250, there are no fees. However, amounts of $250 or less incur a $50 fee. U.S. residents can use Plaid for nearly instant bank transfers, while international traders can choose PayPal or Wise, with payouts processed within 12 business hours.
How to Maximize Your Payouts
Trading Strategies for Better Payouts
Boosting your earnings starts with disciplined trading. Focus on smaller positions and aim for steady, consistent gains that stay within your daily limits. For example, maintaining a $2,000 buffer on a $50,000 account serves as a critical safety net. Additionally, completing over 60 trading days can increase your buffer return from 50% to 80%. On a $2,000 buffer, that’s an extra $600 - just by keeping track of your trading days.
For even better returns, consider upgrading to a PRO+ account. This gives you a 90/10 profit split and immediate access to your earnings. Combined with solid trading strategies, having the right tools can make a big difference in how you execute trades.
Using Technology to Support Trading
Having reliable technology is a must for successful trading. A dependable setup ensures you avoid issues that could jeopardize your payouts. For instance, connectivity problems during crucial moments could lead to rule violations. Using a dedicated VPS (Virtual Private Server) for trading helps maintain constant connectivity, reducing the risk of downtime errors.
Take Profit Trader supports over 15 platforms, including NinjaTrader, Tradovate, and Rithmic. Hosting these platforms on one of the best VPS for futures trading with ultra-low latency and a 100% uptime guarantee ensures your orders are executed exactly as planned. This setup helps you stay within position limits and prevents execution delays that could lead to violations, such as exceeding maximum contract sizes - errors that could result in account liquidation.
To keep your PRO account active, the platform requires at least one trade per calendar week. Reliable hosting with automated monitoring ensures you never miss this requirement due to forgotten logins or technical glitches, helping you protect your payout eligibility.
Account Requirements and Compliance
Stay online and closer to execution. Choose a VPS location for CME futures, New York markets, London FX, API trading, and more.
Host your platform near the market route that matters.
From $59.99/mo
Activity Requirements and Rule Compliance
To keep your PRO account active, you need to make at least one trade every week, from Sunday to Friday. A "traded-day" counts when an open position is held for at least one minute. If you're unable to meet this rule due to personal circumstances, reach out to support beforehand. In some cases, exceptions can be made if you provide proper documentation.
Breaking key risk rules will lead to immediate account liquidation. These rules include exceeding the Daily Loss Limit, surpassing maximum positions (e.g., 6 contracts on a $50,000 account), triggering the Intraday Trailing Drawdown, holding positions past 4:10 PM EST, or trading during restricted times - like one minute before and after high-impact news events.
The use of trading bots or automated algorithms is strictly forbidden. The Terms of Service clearly state:
"Traders are fully responsible for the use of any trade copiers or third-party automation tools... TakeProfit Trader is not liable for losses, violations, or account actions arising from trade copier activity".
Additionally, you are limited to a maximum of five active PRO/PRO+ accounts at any given time.
Following these rules is crucial, not just for keeping your account in good standing, but also for managing your funds effectively.
Tracking Withdrawals and Account Balance
It's important to keep an eye on your account balance and the buffer zone to ensure you're eligible for payouts. The TPT Wallet is your go-to tool for tracking deposits and withdrawals. Before requesting a payout, funds must first be transferred from your PRO account to your Wallet.
For your first withdrawal, you'll need to electronically sign a tax form. Make sure your browser allows pop-ups to avoid any delays. Once a withdrawal request is made, it typically appears in your wallet within 24 hours, with final approval often happening within 12 business hours. Withdrawals over $250 are free, but smaller amounts come with a $50 fee.
Everything You NEED to Know About PAYOUTS (Take Profit Trader)

Conclusion
Understanding TPT's payout rules is key to turning simulated profits into actual earnings. Stick to the buffer and risk guidelines to secure your full share of profits. Keep in mind that withdrawals over $250 are fee-free, but smaller amounts come with a $50 charge. Knowing these details can help you make smarter and more timely decisions.
The timing of account closure also plays a big role in maximizing your buffer returns. Waiting at least 60 trading days before withdrawing boosts your buffer return from 50% to 80%.
Technology plays a vital role in keeping trading smooth and protecting your earnings. Reliable tools ensure uninterrupted trading and timely payouts. While Take Profit Trader permits automation tools and trade copiers, traders are fully responsible for their setup and any violations that might occur. Using a dependable VPS, like QuantVPS, ensures your platform stays connected around the clock, minimizing technical hiccups that could affect your account or earnings.
Following the rules is non-negotiable - only 16.86% of traders advanced in 2024. For those who reach PRO status and stay compliant, real payouts are within reach:
"The profits in your PRO account are SIM, but the money you are paid is 100% real".
FAQs
What’s the difference between PRO and PRO+ accounts?
The PRO and PRO+ accounts differ mainly in profit sharing, withdrawal rules, and eligibility criteria.
With a PRO account, you get an 80/20 profit split, meaning you keep 80% of your profits. However, there’s a catch: you must maintain a buffer equal to the maximum drawdown before you can withdraw profits. For instance, if you have a $50,000 account with a $2,000 buffer, your account balance needs to reach $52,000 before you can withdraw 80% of your profits. During the first 60 trading days, withdrawals within the buffer are limited to 50% of profits, but after that, the limit increases to 80%.
The PRO+ account, on the other hand, offers a more generous 90/10 profit split, letting you keep 90% of your earnings. Instead of a buffer, it uses an end-of-day (EOD) drawdown model, making it a more flexible option. However, it’s not open to everyone - it’s available by invitation only. To qualify, you need to show consistent high profits in a PRO account or achieve a single-day profit of $10,000. The upgrade process takes 4–6 business days, during which trading might be temporarily paused. But be cautious: if your account drops below $5,000 in profits before the upgrade is finalized, you could lose your eligibility.
What is the buffer zone, and how does it impact my ability to withdraw profits?
The buffer zone represents your account's maximum drawdown and plays a key role in determining your withdrawal options. To withdraw profits at the full 80% rate, your account balance must surpass this buffer zone. If your balance remains within the buffer zone, profits can only be withdrawn by closing your account. In that scenario, the payout depends on your account's age: 50% of the buffer zone if the account is less than 60 trading days old, and 80% if it’s older than 60 days.
For the best payout, work to exceed the buffer zone before making a withdrawal request. This way, you can fully benefit from the payout structure without any deductions.
What happens if I withdraw profits before completing 60 trading days?
If you decide to withdraw profits before completing 60 trading days, you’ll receive 50% of the buffer zone profits - essentially half of what you’ve earned in that zone. However, once you hit the 60-day mark, your payout jumps to 80% of the buffer zone profits. This setup is designed to motivate traders to stay engaged and consistent over a longer period.


